Project Evaluationof Foreign Tourists On Their Visit To The Site Hanoi Old Quarter.pdf
Bạn đang xem bản rút gọn của tài liệu. Xem và tải ngay bản đầy đủ của tài liệu tại đây (1.8 MB, 20 trang )
<span class="text_page_counter">Trang 1</span><div class="page_container" data-page="1">
<b>EVALUATIONOF FOREIGN TOURISTS ON THEIR VISIT TO THESITE: HANOI OLD QUARTER</b>
Name : Duong Thi Thanh Giang Pham Thi Mai
Nguyen Thi Ly Nguyen Thi Huyen Hoang Thi Quynh Chi
Lecturer : Ms. Nguyen Thi Thao
<b>HANOI OPEN UNIVERSITYFACULTY OF TOURISM</b>
ENGLISH FOR TOURISM – PET 5
</div><span class="text_page_counter">Trang 2</span><div class="page_container" data-page="2"><b>TABLE OF CONTENT</b>
</div><span class="text_page_counter">Trang 3</span><div class="page_container" data-page="3"><b>I. INTRODUCTION1.Background the project </b>
Vietnam is a small and beautiful country with a victorious history, profound patriotism, and wonderful landscapes. Tourism has become one of the major sectors within the economy of Vietnam. Having a tropical climate, Vietnam is well-known for its breathtaking scenery such as hills, alleys, majestic mountains in the north and white sand beaches in the south. It has a long coastline, so tourism is especially valued in places like Hanoi, Sapa, Danang, and Ho Chi Minh City, which are the most popular destinations for foreign tourists. In the last few years, Vietnam has also welcomed a record-high number of international visitor arrivals. When visiting Vietnam, international tourists cannot ignore the famous Hanoi Old Quarter, which is the soul of the capital of a thousand years of civilization and where travelers can find well-preserved colonial buildings, ancient pagodas, and unique museums within the city center. We can see that this place is an important tourist destination. To learn more about the landscape and good services here, the Hanoi Open University conducted an "Analysis Report on the Evaluation of the Hanoi Old Quarter."
This report has been written at the request of the Pre-intermediate English for Tourism 5 course of the Hanoi Open University in order to improve professional skills so that students know how to build surveys, interview customers and make reports. Through this report, the research team hopes to provide some more information to help assess and recognize the current status of tourism service quality in Hanoi Old Quarter in particular and domestic tourist destinations in general. So, there are appropriate solutions to promote the development of an increasingly strong tourism market in the future.
<b>2.The significance of the project</b>
The tourism industry has been greatly affected by the current COVID-19 pandemic. Therefore, as tourism students, we need to act and study together on the issues related to the tourism industry to find solutions to restore and develop the industry. After the pandemic is over, tourism is the stepping stone to boosting the economy. Therefore, it gives us an objective view of the quality of service in tourism and how to improve it.
<b>3.Objectives of the project</b>
</div><span class="text_page_counter">Trang 4</span><div class="page_container" data-page="4">Firstly, this research will help us know the services quality tourism in HaNoi Old Quarter
Secondly, we can find out the causes affecting the different rating levels of customers to offer solutions to improve and orient the development of service quality tourism in HaNoi Old Quarter
Furthermore, this study creates a reference for company tourism to consider improving the service quality of their company, to meet the increasing demands of tourists.
Finally, doing the project is an opportunity for us to improve our data analysis, interviewing and presentation skills. From there, support for further study and career
<b>4.Methodology of the study</b>
In the project, we used the method of collecting data through online questionnaires by Google Forms. We first sent the questionnaire to groups related to the tourism industry and received 20 customer reviews. Then, we collect data and analyze it from pie chart and bar chart. We chose excel and word to analyze data.
The second is the survey method, directly interviewing a few customers to obtain detailed information about customer reviews. So that we find out the solution to inprove service quality tourism in HaNoi Old Quarter
In addition, we also consult online on some related previous reports to make our report more complete and objective.
<b>5.Scope of the project</b>
In terms of time, the survey took place within 1 month. (December 20, 2021 -January 20, 2022)
Regarding the location, it is through an online survey posted on tour groups on social networking sites such as Facebook, Instagram, Zalo, etc.
Regarding the participants, all customers who have experienced the service quality in Hanoi Old Quarter
<b>6.Structure of the project report</b>
In addition to the title page, table of contents, references and appendices, the main content of the thesis consists of 3 chapters:
Chapter I: INTRODUCTION
</div><span class="text_page_counter">Trang 5</span><div class="page_container" data-page="5">This chapter talks about the background, significance, objectives, methodology, scope, structure.
Chapter II: BODY
This is the result of a survey of 20 participants and in-depth interviews with 5 tourists. Survey of visitors' evaluation after they have experienced the service quality tourism in HaNoi Old Quarter. Based on guest interview information to draw diagrams, comments and assessments on issues: Basic information about customers,human, tourism resource, food, acomodation and shop
Chapter III: CONCLUSIONS AND RECOMMENDATIONS
We summarize the main evaluations of the customer's comments in our conclusions and projects and then give some ideas and recommendations to improve the services quality tourism in Hanoi Old Quarter
<b>II. BODY</b>
<b>1. DESCRIPTION OF DATA COLLECTION PROCESSS1.1. Use networks</b>
With the development of the social network, all tourists use it as a tool for work and leisure. In addition, searching for tourists also becomes easier and faster. It would be an easy way for them if they could make a questionnaire with flexible options, no time limit, and even cost-effective printing.
Post the questionnaire on sites that foreigners frequently use, such as Twitter, WhatsApp, and Facebook, to get information. In addition, getting information from travel agencies is also a quick and easy way to do research.
<b>1.2. Ask foreigners who travelled to Hanoi, one by one through relatives,friends</b>
Another way to get information from customers is to use personal relationships. A study's results will become more accurate the larger the number of participants. However, finding them through social media is not enough. And asking people who have traveled and used services in Hanoi's Old Quarter directly is a way to help us get the most accurate information.
Through personal relationships and the development of technology and social networks, we can easily access the subject of research.
<b>1.3. Information selection</b>
</div><span class="text_page_counter">Trang 6</span><div class="page_container" data-page="6">Once a sufficient number of tourists are available for the study, it is important to select the information. The votes that are considered unsatisfactory are to choose only one answer from start to finish, if the choices are in conflict with each other,... Unsatisfactory assessments will make the results of the study inaccurate and the data unconvincing. And worse, it can lead our research in the wrong direction and affect the results of our research too.
<b>2. Result and discussion2.1. Overview:</b>
<b>a. Personal information ofparticipants</b>
The first chart shows the percentage of countries which participants come from with 4 main continents: Asia, America, Oceania and Europe. It is clear that the participants of Asia account for the most part with 70 percent. This proportion is 3 times more than the European participants. It just takes
</div><span class="text_page_counter">Trang 7</span><div class="page_container" data-page="7">about one over five of the total interviewees. The lowest percentages of participants are Americas and Ocenia with only 5%.
The second chart illustrates the proportion of many different age ranges of participants. Age is distributed into different age ranges: under 17 years old, from 17 to 30, and over 30 years old. We can see that most participants are between the ages of 17 and 30 years old. They are the younger generation of society. Meanwhile, teenagers, adults, and the elderly made up a very small proportion of the interviewees, accounting for approximately 5%.This is a very small proportion compared to the total number of participants.
<small>85.00%5.00%</small>
<small>5.00% 5.00%</small> Information resources
<small>Social network WebsiteTravel agencyFriends & Relatives</small>
<small>5.00% 5.00%</small>
Reasons for traveling
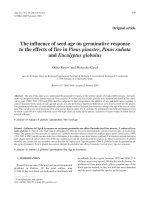
The chart demonstrates the different information resources that participants address in their search for the destination. The sources are very diverse, with social networks such as Facebook. Instagram, Twitter, ... As we can see clearly in the chart, social networking was chosen by the participants with the largest percentage (approximately 90%). While social networks constituted a majority of the participants, the remaining sources of information, such as websites, travel agencies, or friends and relatives, only accounted for very small percentages, with just 5 percent.
</div><span class="text_page_counter">Trang 8</span><div class="page_container" data-page="8">The second chart represents different reasons (with 3 main reasons, which are business, studying, and leisure) why interviewees decide to travel. It can be clearly seen that the most important reason people choose to travel is leisure. This reason contained a majority of up to 90%. The other remaining reasons for people’s travel, which are studying and business, just included only 5%. This proportion is too small compared to the reason for leisure.
<b>2.2. Tourism resources:</b>
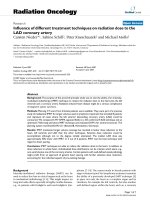
The bar chart shows the satisfaction level of participants with Hanoi Old Quarter in 5 terms: diversity, attractiveness, cleanliness, information resources, and entrance fee, ranging from strongly disagreed to strongly agreed.
</div><span class="text_page_counter">Trang 9</span><div class="page_container" data-page="9">In overview, the survey visitors had good personal evaluations of destinations, with the highest number of resources for information. However, the site’s entrance fee still unsatisfies some of them.
It is clear the majority of respondents chose the level of satisfaction and very satisfied with the term diversity, with 90%, which is the highest figure shown on the chart.
By contrast, satisfaction with cleanliness was the lowest; just 30% of them evaluated both levels as satisfied and very satisfied.
The percentage of tourists who felt satisfied was the same with attractions, information resources, and entrance fees, at more or less 80%. However, in the entrance fee term, 5% of visitors are evaluated as unsatisfied, making this the only term that has negative feedback from the guests.
The proportion of those evaluated at the neutral level for cleanliness is the tallest, as high as half of them. Standing in the second position is the entrance fee, with which 1/3 of the participants didn’t have good responses.
In conclusion, most surveyed guests shared a high level of satisfaction with destinations in Hanoi Old Quarter. However, a few guests felt unsatisfied with the cleanliness or entrance fee of the sites.
The landscape at tourist spots is rated quite well by international visitors. They are interested in the diversity of destinations, including those with ancient architecture from the French colonial period. In particular, they are impressed by the architecture of houses combined with stores on the streets, which brings a feeling of being both busy and bustling and ancient and poetic.
This is also a tourist area that is focused on by the local government, so the information about the destination is also equipped, helping guests easily understand the cultural and historical values of the places. Besides, many destinations with very low or even free fares are also factors that bring satisfaction to visitors. The environmental hygiene factor has an average rating. Some tourists expressed dissatisfaction with hygiene at tourist attractions. At most tourist attractions, there are recycle bins, but because the previous tourists were not aware, and there is also a lack of cleaners, it leads to a situation of throwing garbage indiscriminately at the destination, causing unsightly beauty. In addition, there are many small eateries that
</div><span class="text_page_counter">Trang 10</span><div class="page_container" data-page="10">pour water directly onto the sidewalk. These are the factors that affect visitor satisfaction.
The bar chart displays the participants’ evaluation of their experience related to public services. There are 3 terms with Linkert 5, from very unsatisfied to very satisfied.
Overall, customer satisfaction is just average. Besides, this chart also shows many negative reviews from guests, especially about public toilets.
It can be seen that the levels of "satisfied" and "very satisfied" of guests with social security accounted for the highest number, with half of them. This level was reduced by nearly 30% with the transportation issue. Overall, public toilet services were the lowest overall, with roughly the same figures (just more than 20%). Regarding the level of "Neutral", the transportation column accounted for the highest number of guests with 60% of guests, nearly twice as high as the "public toilet" columns. On the other hand, the level of "unsatisfied" at public toilets was twice as high as social security. In particular, there was one guest who gave a negative rating for the quality of "public toilets" at the highest level, "totally dissatisfied."
In conclusion, the majority of guests do not have a good impression of public service on these sites. There are still a large number of guests who are not satisfied. DISCUSSION:
</div><span class="text_page_counter">Trang 11</span><div class="page_container" data-page="11">Traffic problems have long been a burning problem in Hanoi city in general and the Hanoi Old Quarter in particular. The situation of motorbikes encroaching on the pavement, traffic jams and chaos still exists in many streets. Tourists, especially foreign tourists, feel unsafe and even afraid when participating in traffic.
Through in-depth interviews, tourists said that they were introduced to Hanoi as a friendly destination, but the presence of some beggars and street vendors on the street made them feel unsafe. whole.
Public toilets in Hanoi's Old Quarter are too few. Even so, they are not clean enough. This is an issue that needs to be improved to bring comfort to visitors.
<b>2.3. Food and beverage</b>
DESCRIPTION
</div><span class="text_page_counter">Trang 12</span><div class="page_container" data-page="12">The chart shows the satisfaction level of the surveyed tourists with the food in Hanoi Old Quarter in 3 statements: food is delicious, restaurants are clean, and it is easy to find restaurants, ranging from strongly disagree to strongly agree.
Overall, many participants had a good evaluation of the food, especially its deliciousness. A very large number of tourists selected strongly agreed to rate the delicious and easy-to-find restaurant at a lower rate for the cleanliness of places. I strongly agree that it was selected by 11 tourists in the category of "delicious", making it the highest figure at this level amongst all categories. followed by easy-to-find restaurants and hygiene of places with 8 and 6 respectively.
There is not a great deal of difference between the rates of tourists choosing to I agree with the good hygiene of places (9 people) and the delicious criteria. It was easy to find a restaurant (8 people).
The small number of tourists is only neutral satisfaction with the food of the destination.
In particular, there were not any selections for "disagree" or "strongly disagree" in these categories.
In conclusion, most surveyed guests shared a high level of satisfaction with the deliciousness of the food, the good hygiene of places, and how easily they could find restaurants.
According to the chart, most guests were satisfied with the food in Hanoi's Old Quarter in terms of deliciousness, cleanliness of places, and ease of finding a restaurant. One of them was not difficult to find a restaurant because of the variety of restaurants here. Guests told me that "the food was amazing and it made me want to come back once again." As can be seen, food in Hanoi's Old Quarter is one of the things that attracts tourists.
Incidentally, one guest was dissatisfied with the hygiene of restaurants. It was messy, and paper trash was littered on the floor.
<b>2.4. Accomodation:</b>
</div>