Inflammatory Markers and the Risk of Coronary Heart Disease in Men and Women doc
Bạn đang xem bản rút gọn của tài liệu. Xem và tải ngay bản đầy đủ của tài liệu tại đây (151.32 KB, 13 trang )
Inflammatory Markers and
the Risk of Coronary
Heart Disease in Men and
Women
n engl j med
351;25
www.nejm.org december
16, 2004
The
new england journal
of
medicine
2599
original article
Inflammatory Markers and the Risk of Coronary
Heart Disease in Men and Women
Jennifer K. Pai, M.H.S., Tobias Pischon, M.D., M.P.H., Jing Ma, M.D., Ph.D.,
JoAnn E. Manson, M.D., Dr.P.H., Susan E. Hankinson, Sc.D.,
Kaumudi Joshipura, B.D.S., Sc.D., Gary C. Curhan, M.D., Sc.D., Nader Rifai, Ph.D.,
Carolyn C. Cannuscio, Sc.D., Meir J. Stampfer, M.D., Dr.P.H.,
and Eric B. Rimm, Sc.D.
From the Departments of Epidemiology
(J.K.P., T.P., J.E.M., S.E.H., K.J., G.C.C.,
M.J.S., E.B.R.) and Nutrition (T.P., M.J.S.,
E.B.R.), Harvard School of Public Health;
the Division of Preventive Medicine (J.K.P.,
J.E.M.) and Channing Laboratory (T.P., J.M.,
S.E.H., G.C.C., M.J.S., E.B.R.), Department
of Medicine, Brigham and Women’s Hos-
pital and Harvard Medical School; the
Department of Oral Health Policy and Ep-
idemiology, Harvard School of Dental Med-
icine (K.J.); the Department of Laboratory
Medicine, Children’s Hospital (N.R.); and
the Department of Pathology, Harvard
Medical School (N.R.) — all in Boston; the
Department of Epidemiology, German In-
stitute of Human Nutrition, Potsdam-
Rehbruecke, Germany (T.P.); and Merck
Research Laboratories, West Point, Pa.
(C.C.C.). Address reprint requests to Dr.
Rimm at the Departments of Epidemiology
and Nutrition, Harvard School of Public
Health, 665 Huntington Ave., Boston, MA
02115, or at
Ms. Pai and Dr. Pischon contributed equal-
ly to this article.
N Engl J Med 2004;351:2599-610.
Copyright © 2004 Massachusetts Medical Society.
background
Few studies have simultaneously investigated the role of soluble tumor necrosis fac-
tor
a
(TNF-
a
) receptors types 1 and 2 (sTNF-R1 and sTNF-R2), C-reactive protein, and
interleukin-6 as predictors of cardiovascular events. The value of these inflammatory
markers as independent predictors remains controversial.
methods
We examined plasma levels of sTNF-R1, sTNF-R2, interleukin-6, and C-reactive pro-
tein as markers of risk for coronary heart disease among women participating in the
Nurses’ Health Study and men participating in the Health Professionals Follow-up
Study in nested case–control analyses. Among participants who provided a blood sam-
ple and who were free of cardiovascular disease at baseline, 239 women and 265 men
had a nonfatal myocardial infarction or fatal coronary heart disease during eight years
and six years of follow-up, respectively. Using risk-set sampling, we selected controls
in a 2:1 ratio with matching for age, smoking status, and date of blood sampling.
results
After adjustment for matching factors, high levels of interleukin-6 and C-reactive pro-
tein were significantly related to an increased risk of coronary heart disease in both sex-
es, whereas high levels of soluble TNF-
a
receptors were significant only among wom-
en. Further adjustment for lipid and nonlipid factors attenuated all associations; only
C-reactive protein levels remained significant. The relative risk among all participants
was 1.79 for those with C-reactive protein levels of at least 3.0 mg per liter, as compared
with those with levels of less than 1.0 mg per liter (95 percent confidence interval, 1.27
to 2.51; P for trend <0.001). Additional adjustment for the presence or absence of dia-
betes and hypertension moderately attenuated the relative risk to 1.68 (95 percent con-
fidence interval, 1.18 to 2.38; P for trend=0.008).
conclusions
Elevated levels of inflammatory markers, particularly C-reactive protein, indicate an
increased risk of coronary heart disease. Although plasma lipid levels were more
strongly associated with an increased risk than were inflammatory markers, the level
of C-reactive protein remained a significant contributor to the prediction of coronary
heart disease.
abstract
Copyright © 2004 Massachusetts Medical Society. All rights reserved.
Downloaded from www.nejm.org at RIKSHOSPITALET HF on February 18, 2008 .
n engl j med
351;25
www.nejm.org december
16
,
2004
The
new england journal
of
medicine
2600
nflammation plays an essential role
in the development of insulin resistance and
type 2 diabetes mellitus, the initiation and pro-
gression of atherosclerotic lesions, and plaque dis-
ruption.
1,2
Interleukin-6 and tumor necrosis fac-
tor
a
(TNF-
a
) are inflammatory cytokines and the
main inducers of the secretion of C-reactive protein
in the liver.
3
C-reactive protein is a marker of low-
grade inflammation, and recent studies suggest that
this protein has a role in the pathogenesis of athero-
sclerotic lesions in humans.
4
The effects of TNF-
a
are mediated by two receptors, type 1 and type 2
(TNF-R1 and TNF-R2), which circulate in soluble
forms (sTNF-R1 and sTNF-R2, respectively) and
can be measured with greater sensitivity and reli-
ability than can TNF-
a
itself.
5
The soluble receptors
may attenuate the bioactivity of TNF-
a
but may also
serve as slow-release reservoirs and promote in-
flammation in the absence of free TNF ligand.
6
Nonetheless, only a few studies have examined
the relationship between levels of sTNF-R1, sTNF-
R2, and interleukin-6 and the risk of coronary heart
disease.
7-10
The predictive value of C-reactive pro-
tein for screening and its causal relationship to cor-
onary heart disease remain matters of controver-
sy.
11-17
We prospectively examined the association
between inflammatory markers and the risk of cor-
onary heart disease and the role of potential media-
tors among men and women in a nested case–con-
trol analysis.
study population
The Nurses’ Health Study (NHS) and the Health Pro-
fessionals Follow-up Study (HPFS) are prospective
cohort investigations respectively involving 121,700
female U.S. registered nurses who were 30 to 55
years old at baseline in 1976 and 51,529 U.S. male
health professionals who were 40 to 75 years old
at baseline in 1986. Information about health and
disease is assessed biennially, and information
about diet is obtained every four years by means of
self-administered questionnaires.
18,19
From 1989
through 1990, a blood sample was requested from
all participants in the NHS, and 32,826 women pro-
vided one. Similarly, between 1993 and 1995, a
blood sample was provided as requested by 18,225
men in the HPFS. Participants who provided blood
samples were similar to those who did not, albeit the
men who provided samples were somewhat young-
er than those who did not. In the NHS, among wom-
en without cardiovascular disease or cancer before
1990, we identified 249 women who had a nonfatal
myocardial infarction or fatal coronary heart disease
between the date of blood drawing and June 1998.
In the HPFS, we identified 266 men who had a non-
fatal myocardial infarction or fatal coronary heart
disease between the date of blood drawing and the
return of the 2000 questionnaire. Using risk-set
sampling,
20
we randomly selected controls in a 2:1
ratio who were matched for age, smoking status,
and date of blood sampling from the subgroup of
participants who were free of cardiovascular dis-
ease at the time coronary disease was diagnosed in
the case patients. Within the NHS cohort, an addi-
tional matching criterion was fasting status at the
time of blood sampling.
assessment of coronary heart disease
Study physicians who were unaware of the partici-
pant’s exposure status confirmed the diagnosis of
myocardial infarction on the basis of the criteria of
the World Health Organization (symptoms plus ei-
ther diagnostic electrocardiographic changes or
elevated levels of cardiac enzymes). Deaths were
identified from state vital records and the National
Death Index or reported by the participant’s next of
kin or the postal system. Fatal coronary heart dis-
ease was confirmed by an examination of hospital
or autopsy records, by the listing of coronary heart
disease as the cause of death on the death certifi-
cate, if coronary heart disease was the underlying
and most plausible cause, and if evidence of previ-
ous coronary heart disease was available.
assessment of other factors
Anthropometric, lifestyle, and dietary data were de-
rived from the questionnaire administered in 1990
to women and 1994 to men, with missing infor-
mation substituted from previous questionnaires.
Body-mass index was calculated as the weight in
kilograms divided by the square of the height in
meters. Average nutrient intake was computed with
the use of a semiquantitative food-frequency ques-
tionnaire. Physical activity was expressed in terms of
metabolic equivalent (MET)–hours. The question-
naires and the validity and reproducibility of mea-
surements have been described previously.
18,21
measurement of biochemical variables
Blood samples from women were collected in tubes
treated with liquid sodium heparin, and those from
men were collected in EDTA-treated tubes. The
i
methods
Copyright © 2004 Massachusetts Medical Society. All rights reserved.
Downloaded from www.nejm.org at RIKSHOSPITALET HF on February 18, 2008 .
n engl j med
351;25
www.nejm.org december
16, 2004
inflammatory markers and the risk of coronary heart disease in men and women
2601
tubes were then placed on ice packs, stored in Styro-
foam containers, returned to our laboratory by over-
night courier, centrifuged, and divided into aliquots
for storage in liquid-nitrogen freezers (¡130°C or
colder).
The levels of C-reactive protein were determined
by means of a highly sensitive immunoturbidimetric
assay with the use of reagents and calibrators from
Denka Seiken; this assay has a day-to-day variability
of 1 to 2 percent. Levels of sTNF-R1, sTNF-R2, and
interleukin-6 were measured by means of enzyme-
linked immunosorbent assays (R&D Systems),
which have a day-to-day variability of 3.5 to 9.0 per-
cent. Levels of inflammatory markers were largely
unaffected by transport conditions and reproducible
within subjects over time.
22,23
Total, high-density
lipoprotein (HDL), and directly obtained low-den-
sity lipoprotein (LDL) cholesterol and triglycerides
were measured according to standard methods with
the use of reagents from Roche Diagnostics and
Genzyme. Study samples were sent to the labora-
tory for analysis in randomly ordered batches, and
the laboratory personnel were unaware of a sam-
ple’s case–control status.
The study protocol was approved by the institu-
tional review board of the Brigham and Women’s
Hospital and the Human Subjects Committee Re-
view Board of Harvard School of Public Health.
exclusions
After the exclusion of participants with missing data
on biomarker levels, our data sets consisted of 708
women (239 patients and 469 controls) and 794
men (265 patients and 529 controls). The assay for
interleukin-6 required slightly more plasma than we
originally reserved for this assay among women.
Therefore, analyses involving interleukin-6 were re-
stricted to the subgroup of 676 women for whom
interleukin-6 levels were available.
statistical analysis
We analyzed the two cohorts separately. Inflamma-
tory markers were divided into quintiles, from the
lowest to highest levels, on the basis of the sex-spe-
cific distributions among the controls. With risk-set
sampling, the odds ratio derived from the logistic
regression directly estimates the hazard ratio and,
thus, the relative risk.
20
We analyzed the association
between biomarker levels and the risk of coronary
heart disease using both conditional and uncon-
ditional logistic regression, with adjustment for
matching factors. Because both analyses provided
essentially the same results, we present the results
of unconditional logistic regression, which parallel
the results in the subgroup analyses.
In our multivariable model, we further adjusted
for parental history of coronary heart disease before
the age of 60 years (yes vs. no), alcohol intake (non-
drinker, 0.1 to 4.9 g per day, 5.0 to 14.9 g per day,
15.0 to 29.9 g per day, or at least 30.0 g per day),
body-mass index (less than 20, 20 to 24, 25 to 29,
30 to 34, or 35 or more), physical activity (in quin-
tiles from lowest to highest level), ratio of total to
HDL cholesterol (in quintiles from lowest to high-
est ratio), and use of postmenopausal hormone
therapy (yes vs. no — for women only). Finally, we
also added a history of diabetes (yes vs. no) and hy-
pertension (yes vs. no) at baseline to the model to
assess the effect of these potential mediators. Base-
line was defined as the year blood was drawn.
Correlation coefficients were calculated with the
use of age-adjusted Spearman partial-correlation
coefficients. To test for linear trend, we used the me-
dian levels of inflammatory markers in the control
categories as a continuous variable. To pool the esti-
mates of relative risk for men and women, we used
the weighted average of estimates according to the
random-effects model of DerSimonian and Laird.
24
All P values are two-tailed, and P values below
0.05 were considered to indicate statistical signifi-
cance. All analyses were performed with the use of
SAS software, version 8.2 (SAS Institute).
baseline characteristics
Women in whom coronary heart disease developed
during follow-up had significantly higher baseline
levels of sTNF-R1 and sTNF-R2 than did control
women; however, the levels did not differ signifi-
cantly between men in whom coronary heart dis-
ease developed during follow-up and men in the
control group (Table 1). In the case of both men and
women, patients had significantly higher baseline
levels of interleukin-6 and C-reactive protein than
controls.
The levels of sTNF-R1 and sTNF-R2 showed a
high degree of correlation with each other (Table 2).
The correlation with and between the other inflam-
matory markers was moderate and ranged from
0.27 for sTNF-R1 and C-reactive protein to 0.45 for
interleukin-6 and C-reactive protein. The levels of
inflammatory markers were moderately inversely
associated with HDL cholesterol levels.
results
Copyright © 2004 Massachusetts Medical Society. All rights reserved.
Downloaded from www.nejm.org at RIKSHOSPITALET HF on February 18, 2008 .
n engl j med
351;25
www.nejm.org december
16
,
2004
The
new england journal
of
medicine
2602
* Data on women are from the Nurses’ Health Study and include eight years of follow-up, and data on men are from the
Health Professionals Follow-up Study and include six years of follow-up. Matching criteria were age, smoking status, and
date of blood sampling; among women, additional matching criteria included fasting status at the time of blood sam-
pling. Plus–minus values are means ±SD. To convert values for cholesterol to millimoles per liter, multiply by 0.02586. To
convert values for triglycerides to millimoles per liter, multiply by 0.01129. sTNF-R1 and sTNF-R2 denote soluble tumor
necrosis factor receptor types 1 and 2, CHD coronary heart disease, and MET-hr metabolic equivalent–hours. The body-
mass index is the weight in kilograms divided by the square of the height in meters.
†
P values for the difference between patients and controls (unadjusted) were determined by Student’s t-test for variables
expressed as means ±SD, by Wilcoxon’s rank-sum test for variables expressed as medians, and by the chi-square test for
variables expressed as percentages.
‡ Current aspirin use was defined as every one to four days for women and as two or more times per week for men.
§ The metabolic syndrome is defined by the presence of at least three of the following five abnormalities: a body-mass in-
dex of at least 25, a triglyceride level of at least 150 mg per deciliter (1.7 mmol per liter), an HDL cholesterol level of less
than 50 mg per deciliter for women or less than 40 mg per deciliter for men, a history of hypertension or a history of diabetes
or the development of diabetes during follow-up, or a glycosylated hemoglobin level of at least 7 percent at baseline.
¶Data on interleukin-6 levels were missing for 32 women.
Table 1. Baseline Characteristics of Women and Men in Whom Coronary Heart Disease Developed during Follow-up
and Matched Controls.*
Characteristic Women Men
Patients
(N=239)
Controls
(N=469) P Value
†
Patients
(N=265)
Controls
(N=529) P Value
†
Age (yr)
60.4±6.5 60.2±6.5 — 65.2±8.3 65.1±8.3 —
Current smoker (%) 31.4 31.8 — 12.4 11.5 —
Body-mass index 26.9±5.7 25.3±4.3 <0.001 26.2±3.5 25.7±3.5 0.05
Parental history of CHD before
60 yr of age (%)
21.3 12.4 0.002 15.1 11.0 0.10
Postmenopausal (%) 89.9 87.3 0.31 — — —
Postmenopausal hormone
therapy among postmeno-
pausal women (%)
31.7 41.0 0.03 — — —
Medications (%)
Aspirin
‡
15.1
21.3 0.05 39.1 34.9 0.25
Cholesterol-lowering drug 4.2 2.6 0.24 8.8 6.9 0.32
History of hypertension (%) 57.7 28.8 <0.001 42.3 30.6 0.001
History of diabetes (%) 19.7 6.4 <0.001 9.4 4.4 0.005
Metabolic syndrome (%)§ 43.9 18.3 <0.001 40.4 26.1 <0.001
Total fat intake (% of energy) 31.8±5.8 31.7±6.1 0.82 31.0±6.7 30.3±7.0 0.23
Saturated fat intake (% of energy) 10.8±2.5 10.7±2.7 0.84 10.4±2.7 10.1±2.9 0.12
Alcohol consumption (g/day)
Median 0.9 1.8 <0.001 5.5 7.0 0.11
Interquartile range 0.0–3.7 0.0–8.6 0.9–15.4 0.9–18.3
Physical activity (MET-hr/wk)
Median 11.0 11.5 0.26 22.8 27.3 0.06
Interquartile range 3.9–22.7 5.1–23.0 8.5–44.7 11.8–48.9
sTNF-R1 (pg/ml) 1438±585 1267±354 <0.001 1513±502 1506±541 0.86
sTNF-R2 (pg/ml) 2777±987 2489±710 <0.001 2991±869 2945±870 0.48
Interleukin-6 (pg/ml)¶
Median 1.99 1.65 0.001 1.86 1.53 0.01
Interquartile range 1.30–3.05 1.15–2.65 1.10–3.07 0.98–2.88
C-reactive protein (mg/liter)
Median 3.10 2.20 <0.001 1.68 1.08 <0.001
Interquartile range 1.30–7.50 1.00–5.10 0.76–3.15 0.52–2.38
Cholesterol (mg/dl)
Total 235.4±40.1 225.7±38.7 0.002 214.7±39.9 204.7±36.7 <0.001
LDL 142.9±34.1 132.2±36.4 <0.001 135.6±36.4 127.0±31.1 0.001
HDL 51.5±14.7 60.5±17.4 <0.001 42.1±11.3 45.9±12.5 <0.001
Total-to-HDL cholesterol ratio 4.91±1.55 4.02±1.31 <0.001 5.37±1.41 4.74±1.40 <0.001
Triglycerides (mg/dl) 157.6±96.7 126.3±76.3 <0.001 181.8±116.7 153.8±121.1 0.002
Copyright © 2004 Massachusetts Medical Society. All rights reserved.
Downloaded from www.nejm.org at RIKSHOSPITALET HF on February 18, 2008 .
n engl j med
351;25
www.nejm.org december
16, 2004
inflammatory markers and the risk of coronary heart disease in men and women
2603
main effects
After adjustment for matching factors, women in
the highest quintile of each inflammatory marker,
as compared with women in the lowest quintile, had
a significantly increased risk of coronary heart dis-
ease — by a factor of 1.95 to 2.57 — with signifi-
cant trends across quintiles (Table 3). After addi-
tional adjustment for the presence or absence of a
parental history of coronary heart disease before
the age of 60 years, alcohol intake, level of physical
activity, the ratio of total to HDL cholesterol, body-
mass index, and the use or nonuse of postmeno-
pausal hormone therapy, these associations were
attenuated and no longer significant, except for
C-reactive protein (model 2 in Table 3). Addition-
al adjustment for the presence or absence of diabe-
tes and hypertension, which are potentially in the
causal pathway, further reduced the association for
all inflammatory markers.
Among men, we did not find an association be-
tween the levels of soluble TNF-
a
receptors and
the risk of coronary heart disease (Table 3). Men in
the highest quintile of interleukin-6 had a 57 per-
cent increase in the risk of coronary heart disease,
as compared with men in the lowest quintile, after
adjustment for matching factors, although this as-
sociation was not significant and was further atten-
uated after multivariable adjustment. However, we
found a significant association between C-reactive
protein levels and the risk of coronary heart disease.
Multivariable adjustment and adjustment for the
presence or absence of hypertension and diabetes
* sTNF-R1 and sTNF-R2 denote soluble tumor necrosis factor receptor types 1 and 2, CRP C-reactive protein, TC total cho-
lesterol, LDL low-density lipoprotein cholesterol, HDL high-density lipoprotein cholesterol, and BMI body-mass index.
† Seventeen women were excluded from the analysis of interleukin-6 because they had missing values.
‡ P<0.001.
§ P<0.05.
¶P<0.01.
Table 2. Age-Adjusted Spearman Partial-Correlation Coefficients between Selected Cardiovascular Risk Factors
among 469 Control Women and 529 Control Men.*
Sex and
Risk Factor Risk Factor
sTNF-R1
sTNF-R2
Interleu-
kin-6† CRP TC LDL HDL TC:HDL BMI
Women
sTNF-R1
—
sTNF-R2 0.77‡ —
Interleukin-6 0.31‡ 0.28‡ —
CRP 0.29‡ 0.28‡ 0.44‡ —
TC ¡0.07 ¡0.09§ ¡0.05 0.03 —
LDL 0.02 <0.01 ¡0.03 0.04 0.87‡ —
HDL ¡0.30‡ ¡0.36‡ ¡0.15¶ ¡0.17‡ 0.08 ¡0.22‡ —
TC:HDL 0.22‡ 0.27‡ 0.09 0.15‡ 0.45‡ 0.67‡ ¡0.83‡ —
BMI 0.30‡ 0.27‡ 0.26‡ 0.37‡ 0.12§ 0.18‡ ¡0.33‡ 0.37‡ —
Men
sTNF-R1
—
sTNF-R2 0.67‡ —
Interleukin-6 0.32‡ 0.28‡ —
CRP 0.27‡ 0.28‡ 0.45‡ —
TC ¡0.16‡ ¡0.13‡ ¡0.17‡ 0.03 —
LDL ¡0.16‡ ¡0.11§ ¡0.16‡ ¡0.003 0.86‡ —
HDL ¡0.25‡ ¡0.21‡ ¡0.20‡ ¡0.24‡ 0.20‡ 0.13¶ —
TC:HDL 0.15‡ 0.12¶ 0.10§ 0.25‡ 0.39‡ 0.39‡ ¡0.80‡ —
BMI 0.16‡ 0.14‡ 0.23‡ 0.40‡ 0.04 0.01 ¡0.28‡ 0.31‡ —
Copyright © 2004 Massachusetts Medical Society. All rights reserved.
Downloaded from www.nejm.org at RIKSHOSPITALET HF on February 18, 2008 .
n engl j med
351;25
www.nejm.org december
16
,
2004
The
new england journal
of
medicine
2604
moderately attenuated this relationship; after ac-
counting for these variables, men in the highest
quintile of C-reactive protein, as compared with
those in the lowest quintile, had a relative risk of cor-
onary heart disease of 2.55 (95 percent confidence
interval, 1.40 to 4.65; P for trend=0.02).
For comparison, in the final multivariable-adjust-
ed model (including the presence or absence of di-
abetes and hypertension and C-reactive protein lev-
els), the relative risk of coronary heart disease for
the highest quintile of the ratio of total to HDL cho-
lesterol, as compared with the lowest quintile, was
4.33 (95 percent confidence interval, 2.11 to 8.90;
P for trend <0.001) in women and 3.29 (95 percent
confidence interval, 1.84 to 5.90; P for trend <0.001)
in men.
subgroup analyses
Overall, we found no significant interactions be-
tween various low and high cardiovascular risk
groups and the association of biomarkers with the
risk of coronary heart disease, although the associ-
ation of C-reactive protein was generally stronger in
low-risk subgroups. For example, in the multivari-
Table 3. Relative Risks of Coronary Heart Disease during Follow-up, According to the Quintile of Plasma Levels of Inflammatory Markers
at Baseline.*
Variable† Quintile of Plasma Level
P for
Trend‡
1
2 3 4 5
relative risk (95 percent confidence interval)
Women
sTNF-R1
Median — pg/ml
880 1083 1221 1379 1744
Quintile value — pg/ml <928 928–1146 1147–1296 1297–1508 ≥1509
Model 1 (matching factors) 1.0 1.21 (0.69 –2.11) 1.20 (0.68 –2.09) 1.56 (0.90 –2.70) 2.57 (1.50 –4.39) <0.001
Model 2 (multivariable) 1.0 1.08 (0.60 –1.97) 0.91 (0.50–1.67) 1.14 (0.63–2.08) 1.50 (0.82–2.74) 0.12
Model 3 (model 2+diabetes
and hypertension)
1.0 1.06 (0.57–1.97) 0.90 (0.48–1.69) 1.02 (0.54–1.90) 1.24 (0.66–2.34) 0.43
sTNF-R2
Median — pg/ml
1718 2060 2365 2724 3405
Quintile value — pg/ml <1892 1892–2223 2224–2549 2550–3019 ≥3020
Model 1 (matching factors) 1.0 1.72 (0.97–3.04) 1.92 (1.09–3.39) 2.19 (1.24–3.88) 2.51 (1.41–4.45) 0.003
Model 2 (multivariable) 1.0 1.39 (0.75–2.56) 1.48 (0.80–2.74) 1.41 (0.76–2.60) 1.36 (0.72–2.58) 0.59
Model 3 (model 2+diabetes
and hypertension)
1.0 1.40 (0.74–2.65) 1.38 (0.73–2.62) 1.30 (0.69–2.46) 1.20 (0.62–2.33) 0.96
Interleukin-6§
Median — pg/ml
0.82 1.23 1.65 2.37 4.15
Quintile value — pg/ml <1.08 1.08–1.44 1.45–1.91 1.92–2.91 ≥2.92
Model 1 (matching factors) 1.0 1.42 (0.81–2.51) 1.15 (0.65–2.05) 1.98 (1.16–3.40) 1.92 (1.11–3.31) 0.01
Model 2 (multivariable) 1.0 1.16 (0.63–2.13) 0.96 (0.51–1.79) 1.32 (0.72–2.40) 1.33 (0.73–2.43) 0.30
Model 3 (model 2+diabetes
and hypertension)
1.0 1.08 (0.58–2.03) 0.81 (0.42–1.55) 1.01 (0.54–1.89) 1.05 (0.56–1.97) 0.79
C-reactive protein
Median — mg/liter
0.50 1.18 2.20 4.02 9.14
Quintile value — mg/liter <0.80 0.80–1.70 1.71–2.91 2.92–5.96 ≥5.97
Model 1 (matching factors) 1.0 1.28 (0.74–2.23) 1.03 (0.59–1.81) 1.54 (0.91–2.63) 2.18 (1.30–3.64) <0.001
Model 2 (multivariable) 1.0 1.17 (0.64–2.14) 0.81 (0.43–1.52) 1.17 (0.64–2.14) 1.86 (1.00–3.46) 0.008
Model 3 (model 2+diabetes
and hypertension)
1.0 1.23 (0.66–2.32) 0.89 (0.46–1.72) 1.22 (0.65–2.30) 1.61 (0.84–3.07) 0.08
Copyright © 2004 Massachusetts Medical Society. All rights reserved.
Downloaded from www.nejm.org at RIKSHOSPITALET HF on February 18, 2008 .
n engl j med
351;25
www.nejm.org december
16, 2004
inflammatory markers and the risk of coronary heart disease in men and women
2605
able-adjusted model (excluding the presence or ab-
sence of hypertension and diabetes), the relative risk
in the highest as compared with the lowest quintile
of C-reactive protein was 2.53 among women with
a body-mass index of less than 25 (95 percent con-
fidence interval, 1.04 to 6.18; P for trend=0.02) and
6.25 among men with a body-mass index of less
than 25 (95 percent confidence interval, 2.28 to 17.1;
P for trend=0.005). Similarly, among participants
with LDL cholesterol levels of less than 130 mg per
* The group of women included 239 patients and 469 controls with eight years of follow-up. The group of men included 265 patients and 529
controls with six years of follow-up. sTNF denotes soluble tumor necrosis factor receptor. Quintiles and median values of plasma inflamma-
tory markers are based on values in controls. For each relative risk, quintile 1 served as the reference group.
† Model 1 was adjusted for matching factors (age, smoking status, and the month of blood sampling). Among women, data were also adjusted
for fasting status at the time of blood sampling. Model 2 was adjusted for matching factors, presence or absence of a parental history of cor-
onary heart disease before the age of 60 years, alcohol intake, level of physical activity, ratio of total cholesterol to HDL cholesterol, and body-
mass index. Among women, the multivariable model was also adjusted for the use or nonuse of postmenopausal hormone therapy.
‡ P values for trend are based on the median levels of inflammatory markers in quintiles of the controls.
§ A total of 32 women were excluded from the analyses for interleukin-6 owing to missing values for interleukin; 224 patients and 452 controls
were analyzed.
Table 3. (Continued.)
Variable† Quintile of Plasma Level
P for
Trend‡
1
2 3 4 5
relative risk (95 percent confidence interval)
Men
sTNF-R1
Median — pg/ml
1005 1205 1391 1627 2124
Quintile value — pg/ml <1111 1111–1301 1302–1510 1511–1793 ≥1794
Model 1 (matching factors) 1.0 1.01 (0.63–1.63) 1.13 (0.70–1.82) 0.96 (0.58–1.57) 1.06 (0.64–1.77) 0.90
Model 2 (multivariable) 1.0 0.95 (0.57–1.58) 1.00 (0.60–1.65) 0.84 (0.49–1.42) 0.85 (0.49–1.46) 0.48
Model 3 (model 2+diabetes
and hypertension)
1.0 0.94 (0.56–1.56) 0.99 (0.60–1.65) 0.82 (0.48–1.40) 0.78 (0.45–1.36) 0.32
sTNF-R2
Median — pg/ml
1969 2421 2812 3209 4090
Quintile value — pg/ml <2242 2242–2614 2615–2966 2967–3564 ≥3565
Model 1 (matching factors) 1.0 0.80 (0.49–1.31) 0.90 (0.55–1.47) 1.12 (0.69–1.82) 1.12 (0.68–1.86) 0.33
Model 2 (multivariable) 1.0 0.68 (0.40–1.15) 0.81 (0.48–1.36) 0.94 (0.56–1.57) 0.91 (0.54–1.56) 0.78
Model 3 (model 2+diabetes
and hypertension)
1.0 0.72 (0.42–1.21) 0.81 (0.48–1.37) 0.98 (0.59–1.65) 0.92 (0.53–1.58) 0.80
Interleukin-6
Median — pg/ml
0.69 1.09 1.53 2.43 5.73
Quintile value — pg/ml <0.88 0.88–1.29 1.30–1.89 1.90–3.15 ≥3.16
Model 1 (matching factors) 1.0 1.09 (0.66–1.81) 1.19 (0.72–1.98) 1.52 (0.93–2.48) 1.57 (0.95–2.57) 0.06
Model 2 (multivariable) 1.0 0.94 (0.55–1.60) 0.99 (0.59–1.69) 1.25 (0.74–2.10) 1.31 (0.78–2.21) 0.17
Model 3 (model 2+diabetes
and hypertension)
1.0 0.97 (0.57–1.65) 0.98 (0.58–1.68) 1.24 (0.73–2.09) 1.31 (0.77–2.22) 0.19
C-reactive protein
Median — mg/liter
0.27 0.60 1.08 2.05 5.24
Quintile value — mg/liter <0.44 0.44–0.80 0.81–1.49 1.50–2.78 ≥2.79
Model 1 (matching factors) 1.0 1.81 (1.04–3.17) 2.00 (1.15–3.50) 2.74 (1.59–4.71) 3.29 (1.91–5.65) <0.001
Model 2 (multivariable) 1.0 1.75 (0.97–3.14) 1.83 (1.02–3.30) 2.27 (1.26–4.09) 2.73 (1.51–4.96) 0.007
Model 3 (model 2+diabetes
and hypertension)
1.0 1.75 (0.97–3.16) 1.74 (0.96–3.15) 2.14 (1.18–3.88) 2.55 (1.40–4.65) 0.02
Copyright © 2004 Massachusetts Medical Society. All rights reserved.
Downloaded from www.nejm.org at RIKSHOSPITALET HF on February 18, 2008 .
n engl j med
351;25
www.nejm.org december
16
,
2004
The
new england journal
of
medicine
2606
deciliter (3.4 mmol per liter), the corresponding rel-
ative risks were 3.54 (95 percent confidence inter-
val, 1.19 to 10.5; P for trend=0.01) for women and
2.52 (95 percent confidence interval, 1.09 to 5.83;
P for trend= 0.04) for men. Among participants
without hypertension, the corresponding relative
risks were 1.87 (95 percent confidence interval,
0.77 to 4.56; P for trend=0.02) for women and 3.01
(95 percent confidence interval, 1.41 to 6.44; P for
trend=0.02) for men.
clinical cutoff points for c-reactive
protein
We further categorized the study participants, on
the basis of recently proposed cutoff points for
C-reactive protein, as having low levels (less than
1.0 mg per liter), moderate levels (1.0 to 2.9 mg per
liter), and high levels (at least 3.0 mg per liter).
25
In these analyses, participants with high levels of
C-reactive protein, as compared with those with low
levels, had a relative risk of coronary heart disease
of approximately 1.8 after adjustment for covari-
ates (including body-mass index and lipid levels)
(Table 4). When we pooled the risk estimates for
men and women, the final multivariable-adjusted
relative risk (including adjustment for the presence
or absence of diabetes and hypertension) was 1.68
in the group with high levels of C-reactive protein,
as compared with the group with low levels (95 per-
cent confidence interval, 1.18 to 2.38; P for trend=
0.008) (Table 4). This is similar to the pooled esti-
mate (relative risk, 1.48; 95 percent confidence
interval, 1.08 to 2.04; P for trend=0.03) after we
controlled for covariates from the Framingham risk
score,
26
including age, presence or absence of hy-
pertension and diabetes, ratio of total to HDL cho-
lesterol, and smoking status.
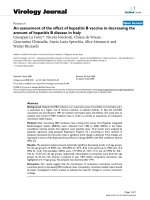
We found a gradient of risk of coronary heart
disease within each increasing category of C-reac-
tive protein and ratio of total to HDL cholesterol
(Fig. 1). This finding supports the hypothesis that
the levels of C-reactive protein may predict risk be-
yond the information afforded by lipid levels. How-
ever, despite the independent associations, the gra-
dient of risk associated with lipid levels was greater
than that for C-reactive protein levels.
additional analyses
When we stratified our analysis according to the
time to an event in two-year intervals, the relative
risk of coronary heart disease associated with
C-reactive protein levels remained relatively stable
over time (data not shown). When we repeated our
main analyses after excluding participants with
C-reactive protein levels of at least 10.0 mg per liter,
we found essentially the same results. C-reactive
protein levels may be affected by hormone therapy.
10
However, results were similar when we used quin-
tiles of C-reactive protein based on levels in women
in the control group who reported never using hor-
mones.
In these two nested case–control studies, we found
that high plasma levels of C-reactive protein were
associated with an increased risk of coronary heart
disease among women and men without previous
cardiovascular disease. Elevated plasma levels of
sTNF-R1 and sTNF-R2 were related to an increased
risk among women, but not men. We found only a
moderate suggestion of increased risk associated
with elevated levels of interleukin-6. For all mark-
ers, associations were substantially attenuated and
— with the exception of C-reactive protein — no
longer significant after adjustment for cardiovas-
cular risk factors, particularly body-mass index and
the presence or absence of diabetes and hyperten-
sion. These findings are consistent with a role of
these inflammatory markers in the elevated risk of
cardiovascular events that is associated with type 2
diabetes and hypertension.
TNF-
a
and interleukin-6 are the main inducers
of hepatic production of acute-phase proteins, in-
cluding C-reactive protein.
3
These inflammatory
markers are associated with biologic and environ-
mental risk factors for cardiovascular events, includ-
ing components of the metabolic syndrome (obe-
sity, insulin resistance, diabetes, hypertension, and
low HDL cholesterol levels), and lifestyle factors,
such as smoking, abstinence from alcohol, and
physical inactivity.
27-29
Compelling evidence suggests that inflamma-
tion causally contributes to several precursors of car-
diovascular disease. TNF-
a
and interleukin-6 can
cause insulin resistance in animal models, and plas-
ma levels of C-reactive protein and interleukin-6
have been shown to predict type 2 diabetes in hu-
mans.
30,31
The increased cytokine synthesis in obe-
sity may promote insulin resistance and impaired
glucose uptake, type 2 diabetes, and ultimately, cor-
onary heart disease.
30
In line with these hypothe-
ses, we found that plasma levels of interleukin-6
and C-reactive protein, in particular, were related to
discussion
Copyright © 2004 Massachusetts Medical Society. All rights reserved.
Downloaded from www.nejm.org at RIKSHOSPITALET HF on February 18, 2008 .
n engl j med
351;25
www.nejm.org december
16, 2004
inflammatory markers and the risk of coronary heart disease in men and women
2607
the risk of coronary heart disease and that the risks
were attenuated after adjustment for the presence
or absence of diabetes and hypertension.
TNF-
a
has a limited half-life and is difficult to
measure in large-scale epidemiologic studies.
5,6
In
a nested case–control study, Ridker et al. reported a
multivariable-adjusted relative risk of recurrent cor-
onary events of 2.5 (95 percent confidence interval,
1.3 to 5.1) among men whose TNF-
a
levels exceed-
ed the 95th percentile, as compared with men with
lower levels.
32
Cesari et al. reported a relative risk of
of coronary events of 1.79 (95 percent confidence
interval, 1.18 to 2.71) among elderly participants
without cardiovascular disease who had the high-
est of three levels of TNF-
a
, as compared with
those who had the lowest levels.
8
The value of as-
* Data on women are from the Nurses’ Health Study and include eight years of follow-up, and data on men are from the
Health Professionals Follow-up Study and include six years of follow-up. The subjects with the lowest level of C-reactive
protein (CRP) served as the reference group. TC:HDL denotes the ratio of total cholesterol to high-density lipoprotein
cholesterol.
† Model 1 was adjusted for matching factors (age, smoking status, and month of blood sampling); data for women were
also adjusted for fasting status at the time of blood sampling. Model 2 was adjusted for matching factors, as well as the
presence or absence of a parental history of coronary heart disease before the age of 60 years, alcohol intake, level of
physical activity, and use or nonuse of hormone therapy among postmenopausal women. Model 5 was adjusted for ev-
erything listed in model 4 as well as the presence or absence of diabetes and hypertension.
‡ P values for trend are based on median levels in the three C-reactive protein groups in the controls.
Table 4. Relative Risks of Coronary Heart Disease during Follow-up According to the Baseline Level of C-Reactive
Protein.*
Variable† CRP <1.0 mg/liter CRP 1.0–2.9 mg/liter CRP ≥3.0 mg/liter P for Trend‡
relative risk (95 percent confidence interval)
Women
No. of patients
41 73 125
No. of controls 114 170 185
Model 1 (matching factors) 1.0 1.22 (0.77–1.93) 1.93 (1.25–2.99) <0.001
Model 2 (multivariable) 1.0 1.21 (0.75–1.96) 1.94 (1.21–3.10) 0.002
Model 3 (model 2+body-mass
index)
1.0 1.16 (0.71–1.90) 1.71 (1.04–2.80) 0.02
Model 4 (model 3+TC:HDL) 1.0 1.09 (0.66–1.82) 1.64 (0.98–2.75) 0.02
Model 5 (model 4+diabetes and hy-
pertension)
1.0 1.17 (0.69–2.00) 1.53 (0.89–2.62) 0.09
Men
No. of patients
86 108 71
No. of controls 254 175 100
Model 1 (matching factors) 1.0 1.90 (1.34–2.71) 2.20 (1.46–3.32) <0.001
Model 2 (multivariable) 1.0 1.88 (1.31–2.69) 2.17 (1.43–3.31) 0.002
Model 3 (model 2+body-mass
index)
1.0 1.85 (1.28 –2.68) 2.08 (1.34–3.23) 0.006
Model 4 (model 3+TC:HDL) 1.0 1.71 (1.17–2.49) 1.91 (1.22–3.00) 0.02
Model 5 (model 4+diabetes and hy-
pertension)
1.0 1.60 (1.09–2.34) 1.79 (1.14–2.83) 0.03
Men and Women
Model 1 (matching factors)
1.0 1.61 (1.22–2.14) 2.07 (1.54–2.79) <0.001
Model 2 (multivariable) 1.0 1.61 (1.20–2.14) 2.06 (1.51–2.82) <0.001
Model 3 (model 2+body-mass
index)
1.0 1.57 (1.17–2.11) 1.90 (1.37–2.65) <0.001
Model 4 (model 3+TC:HDL) 1.0 1.46 (1.08–1.98) 1.79 (1.27–2.51) <0.001
Model 5 (model 4+diabetes and hy-
pertension)
1.0 1.44 (1.05–1.96) 1.68 (1.18–2.38) 0.008
Copyright © 2004 Massachusetts Medical Society. All rights reserved.
Downloaded from www.nejm.org at RIKSHOSPITALET HF on February 18, 2008 .
n engl j med
351;25
www.nejm.org december
16
,
2004
The
new england journal
of
medicine
2608
sessing circulating levels of TNF-
a
is unknown,
since such levels can be very low and unstable. The
levels of soluble TNF-
a
receptors may be more sta-
ble and may better reflect longer-term average cir-
culating levels of TNF-
a
, although data on the role
of soluble TNF-
a
receptors in coronary heart dis-
ease are scarce.
7,33
It is unclear why we found a dif-
ference in risk between men and women associat-
ed with elevated levels of soluble TNF-
a
receptors;
however, others also have found differences be-
tween women and men with respect to lipids
34
and
in the overall prediction of risk.
35
Similarly, mech-
anisms of insulin sensitivity, rather than inflamma-
tion, may contribute more to the risk of coronary
heart disease in women than men.
Findings of an association between interleukin-
6 levels and the risk of coronary heart disease have
been inconsistent.
8,10,36
In our study, this associa-
tion was substantially reduced and no longer sig-
nificant after multivariable adjustment.
C-reactive protein is the most extensively stud-
ied inflammatory marker in prospective settings.
In an early meta-analysis of 11 prospective studies,
the relative risk of coronary heart disease in subjects
with the highest of three C-reactive protein levels, as
compared with those with the lowest levels, was 2.0
(95 percent confidence interval, 1.6 to 2.5) among
population-based studies.
37
Eleven other prospec-
tive studies have since been published. In an updat-
ed meta-analysis, Danesh et al. reported an overall
odds ratio of 1.58 (95 percent confidence interval,
1.48 to 1.68) among subjects with the highest of
three levels of C-reactive protein, as compared with
subjects with the lowest level.
16
This risk estimate
is similar to that in our comparisons of C-reactive
protein levels of at least 3.0 mg per liter with those
of less than 1.0 mg per liter. However, the degree of
adjustment for traditional cardiovascular risk fac-
tors differed markedly among the studies included
in the meta-analysis.
An important question is whether knowing the
level of C-reactive protein adds materially to risk
prediction. In the Women’s Health Study, Ridker
et al. reported that the level of C-reactive protein was
a stronger predictor than the LDL cholesterol level
and that it added to the information provided by the
Framingham risk score.
12,38
Comparing C-reactive
protein levels of at least 3.0 mg per liter with those
of less than 1.0 mg per liter, they reported a relative
risk of 1.5 (95 percent confidence interval, 1.2 to
1.9) after adjustment for the Framingham risk score
and the presence or absence of diabetes.
38
In the Atherosclerosis Risk in Communities
Study, Ballantyne et al. reported a relative risk of
coronary heart disease of 1.72 (95 percent confi-
dence interval, 1.24 to 2.39) among subjects with a
C-reactive protein level of at least 3.0 mg per liter,
as compared with subjects with a level of less than
1.0 mg per liter (adjusted for components of the Fra-
mingham risk score, including the presence or ab-
Figure 1. Multivariable-Adjusted Relative Risk of Coronary Heart Disease
among Women (Panel A) and Men (Panel B), According to the Baseline
Level of C-Reactive Protein (CRP) and the Quintile of the Ratio of Total
to HDL Cholesterol.
Data on women are from the Nurses’ Health Study and include eight years
of follow-up, and data on men are from the Health Professionals Follow-up
Study and include six years of follow-up. The model was adjusted for age,
smoking status, date of blood sampling, presence or absence of a parental
history of coronary heart disease before the age of 60 years, alcohol intake,
level of physical activity, and body-mass index. Among women, the multivari-
able model was also adjusted for fasting status at the time of blood sampling
and the use or nonuse of postmenopausal hormone therapy. In each panel,
the subjects in quintile 1 who had a CRP level of less than 1.0 mg per liter
served as the reference group.
Relative Risk of Coronary
Heart Disease
12.0
14.0
10.0
8.0
4.0
2.0
6.0
0.0
1 2 3 4 5
Quintile of Total:HDL Cholesterol
16.0
Relative Risk of Coronary
Heart Disease
12.0
14.0
10.0
8.0
4.0
2.0
6.0
0.0
1 2 3 4 5
Quintile of Total:HDL Cholesterol
16.0
A
B
≥3.0 mg of CRP/liter
1.0–2.9 mg of CRP/liter
<1.0 mg of CRP/liter
Women
Men
Copyright © 2004 Massachusetts Medical Society. All rights reserved.
Downloaded from www.nejm.org at RIKSHOSPITALET HF on February 18, 2008 .
n engl j med
351;25 www.nejm.org december 16, 2004
inflammatory markers and the risk of coronary heart disease in men and women
2609
sence of diabetes).
14
In the Monitoring Trends and
Determinants in Cardiovascular Disease (MONICA)
study, comparing C-reactive protein levels of at
least 3.0 mg per liter with those of less than 1.0 mg
per liter, Koenig et al. reported a hazard ratio of
2.21 (95 percent confidence interval, 1.49 to 3.27),
adjusted for the Framingham risk score.
13
In con-
trast, in the Rotterdam Study, measuring the level of
C-reactive protein did not improve the prediction
of coronary events beyond that afforded by the Fra-
mingham risk score, with an odds ratio of 1.2 (95
percent confidence interval, 0.6 to 2.2) among par-
ticipants in the highest quartile of C-reactive protein,
as compared with those in the lowest quartile.
39
In our analysis, the pooled relative risk among
men and women classified according to clinical cut-
off points for the levels of C-reactive protein was
1.48 (95 percent confidence interval, 1.08 to 2.04;
P for trend=0.03) after we accounted for covariates
in the Framingham risk score, including the pres-
ence or absence of diabetes. Our results are similar
to those of Ridker et al.
38
and Ballantyne et al.,
14
as
well as those of the recent meta-analysis by Danesh
et al.,
16
a fact that suggests that after adjustment
for the Framingham risk score, the relative risk as-
sociated with a clinical cutoff point of at least 3.0
mg per liter, as compared with a cutoff of less than
1.0 mg per liter, is probably moderately less than
previously suggested in the guidelines for the clin-
ical assessment of inflammatory markers issued by
the American Heart Association and the Centers for
Disease Control and Prevention (relative risk, 1.5 vs.
approximately 2.0).
25
Nevertheless, our findings
support the theory that the level of C-reactive pro-
tein provides an additional measure of the risk of
coronary heart disease beyond that afforded by the
Framingham risk score.
Our study has some limitations. As with any
observational study design, there is the possibility
of unmeasured confounding. However, we con-
trolled for most known cardiovascular risk factors.
Though we obtained only a single blood sample at
baseline, previous studies have shown the levels of
biomarkers to be relatively stable over time.
22,23
Since the ranges of anthropometric variables in our
cohorts were quite broad, the biologic relationships
found should be widely generalizable. Though we
excluded men and women with missing data on
blood levels, generalizability should be minimally
affected because the participants were similar to
those who did not provide blood samples.
Although the Framingham risk score is a tool for
estimating the 10-year risk of coronary heart disease
among healthy subjects,
26
it does not include other
well-established risk factors, such as body-mass in-
dex, alcohol intake, level of physical activity, or the
presence or absence of a parental history of coro-
nary heart disease.
40
Therefore, to examine the role
of inflammatory markers in coronary heart disease,
we used an etiologic approach in our main analyses,
to take into account the pathophysiology of coro-
nary heart disease and include the major cardiovas-
cular risk factors, beyond those included in the Fra-
mingham risk score, for comparison.
Our questionnaires did not include questions on
the use of hydroxymethylglutarylcoenzyme A reduc-
tase inhibitors (statins) because these drugs were
not widely used at time of blood sampling. Howev-
er, the reported use of cholesterol-lowering drugs
was generally low in both cohorts.
In conclusion, our findings suggest that high
levels of C-reactive protein are associated with an in-
creased risk of coronary heart disease among men
and women and that the level of C-reactive protein
is a significant marker of the risk of coronary heart
disease, even after careful multivariable adjustment.
Though all other associations were attenuated after
multivariable adjustment, high levels of sTNF-R1
and sTNF-R2 may be also associated with an in-
creased risk and deserve further exploration in other
populations. From a clinical standpoint, although
the ratio of total to HDL cholesterol was more
strongly associated with the risk of coronary heart
disease than were the levels of inflammatory mark-
ers, the level of C-reactive protein was still a signif-
icant contributor to the prediction of coronary heart
disease.
Supported by grants (HL35464, CA55075, AA11181, and
HL34594) from the National Institutes of Health and by a grant
from Merck Research Laboratories. Dr. Pischon is a Jetson Lincoln
fellow, supported in part by an unrestricted gift from Mr. Lincoln.
Ms. Pai is supported by an institutional training grant (HL07575)
from the National Heart, Lung, and Blood Institute.
Dr. Cannuscio was an employee of Merck at the time the research
was conducted. Dr. Manson is listed as a coinventor of a patent filed
by Brigham and Women’s Hospital related to inflammatory mark-
ers and diabetes mellitus. Dr. Rimm reports having received grant
support from Merck.
We are indebted to Alan Paciorek, Helena Ellis, and Jeanne Spar-
row for coordinating the collection of samples and for laboratory
management, and to Lydia Liu for programming review.
Copyright © 2004 Massachusetts Medical Society. All rights reserved.
Downloaded from www.nejm.org at RIKSHOSPITALET HF on February 18, 2008 .
n engl j med 351;25 www.nejm.org december 16, 2004
2610
inflammatory markers and the risk of coronary heart disease in men and women
references
1. Libby P. Inflammation in atherosclero-
sis. Nature 2002;420:868-74.
2. Pradhan AD, Ridker PM. Do atheroscle-
rosis and type 2 diabetes share a common
inflammatory basis? Eur Heart J 2002;23:
831-4.
3. Yudkin JS, Kumari M, Humphries SE,
Mohamed-Ali V. Inflammation, obesity,
stress and coronary heart disease: is inter-
leukin-6 the link? Atherosclerosis 2000;148:
209-14.
4. Blake GJ, Ridker PM. Inflammatory bio-
markers and cardiovascular risk prediction.
J Intern Med 2002;252:283-94.
5. Diez-Ruiz A, Tilz GP, Zangerle R, Baier-
Bitterlich G, Wachter H, Fuchs D. Soluble
receptors for tumour necrosis factor in clin-
ical laboratory diagnosis. Eur J Haematol
1995;54:1-8.
6. Aderka D. The potential biological and
clinical significance of the soluble tumor ne-
crosis factor receptors. Cytokine Growth
Factor Rev 1996;7:231-40.
7. Benjafield AV, Wang XL, Morris BJ.
Tumor necrosis factor receptor 2 gene
(TNFRSF1B) in genetic basis of coronary ar-
tery disease. J Mol Med 2001;79:109-15.
8. Cesari M, Penninx BW, Newman AB, et
al. Inflammatory markers and onset of car-
diovascular events: results from the Health
ABC study. Circulation 2003;108:2317-22.
9. Ridker PM, Hennekens CH, Buring JE,
Rifai N. C-reactive protein and other mark-
ers of inflammation in the prediction of car-
diovascular disease in women. N Engl J Med
2000;342:836-43.
10. Pradhan AD, Manson JE, Rossouw JE, et
al. Inflammatory biomarkers, hormone re-
placement therapy, and incident coronary
heart disease: prospective analysis from the
Women’s Health Initiative observational
study. JAMA 2002;288:980-7.
11. Ridker PM, Cushman M, Stampfer MJ,
Tracy RP, Hennekens CH. Inflammation, as-
pirin, and the risk of cardiovascular disease
in apparently healthy men. N Engl J Med
1997;336:973-9. [Erratum, N Engl J Med
1997;337:356.]
12. Ridker PM, Rifai N, Rose L, Buring JE,
Cook NR. Comparison of C-reactive protein
and low-density lipoprotein cholesterol lev-
els in the prediction of first cardiovascular
events. N Engl J Med 2002;347:1557-65.
13. Koenig W, Lowel H, Baumert J, Meis-
inger C. C-reactive protein modulates risk
prediction based on the Framingham Score:
implications for future risk assessment: re-
sults from a large cohort study in southern
Germany. Circulation 2004;109:1349-53.
14. Ballantyne CM, Hoogeveen RC, Bang H,
et al. Lipoprotein-associated phospholipase
A2, high-sensitivity C-reactive protein, and
risk for incident coronary heart disease in
middle-aged men and women in the Athero-
sclerosis Risk in Communities (ARIC) study.
Circulation 2004;109:837-42.
15. Packard CJ, O’Reilly DS, Caslake MJ, et
al. Lipoprotein-associated phospholipase A2
as an independent predictor of coronary
heart disease: West of Scotland Coronary
Prevention Study Group. N Engl J Med 2000;
343:1148-55.
16. Danesh J, Wheeler JG, Hirschfield GM,
et al. C-reactive protein and other circulat-
ing markers of inflammation in the predic-
tion of coronary heart disease. N Engl J Med
2004;350:1387-97.
17. Hackam DG, Anand SS. Emerging risk
factors for atherosclerotic vascular disease:
a critical review of the evidence. JAMA 2003;
290:932-40.
18. Rimm EB, Giovannucci EL, Stampfer MJ,
Colditz GA, Litin LB, Willett WC. Reproduc-
ibility and validity of an expanded self-admin-
istered semiquantitative food frequency
questionnaire among male health profes-
sionals. Am J Epidemiol 1992;135:1114-26.
19. Colditz GA, Manson JE, Hankinson SE.
The Nurses’ Health Study: 20-year contribu-
tion to the understanding of health among
women. J Womens Health 1997;6:49-62.
20. Prentice RL, Breslow NE. Retrospective
studies and failure time models. Biometrika
1978;65:153-8.
21. Willett W, Lenart E. Reproducibility and
validity of food-frequency questionnaires.
In: Willett W, ed. Nutritional epidemiology.
New York: Oxford University Press, 1998:
101-47.
22. Pai JK, Curhan GC, Cannuscio CC, Rifai
N, Ridker PM, Rimm EB. Stability of novel
plasma markers associated with cardiovas-
cular disease: processing within 36 hours of
specimen collection. Clin Chem 2002;48:
1781-4.
23. Pischon T, Hankinson SE, Hotamisligil
GS, Rifai N, Willett WC, Rimm EB. Habitual
dietary intake of n-3 and n-6 fatty acids in re-
lation to inflammatory markers among US
men and women. Circulation 2003;108:155-
60.
24. Takkouche B, Cadarso-Suarez C,
Spiegelman D. Evaluation of old and new
tests of heterogeneity in epidemiologic meta-
analysis. Am J Epidemiol 1999;150:206-15.
25. Pearson TA, Mensah GA, Alexander RW,
et al. Markers of inflammation and cardio-
vascular disease: application to clinical and
public health practice: a statement for health-
care professionals from the Centers for Dis-
ease Control and Prevention and the Ameri-
can Heart Association. Circulation 2003;
107:499-511.
26. Wilson PW, D’Agostino RB, Levy D, Be-
langer AM, Silbershatz H, Kannel WB. Pre-
diction of coronary heart disease using risk
factor categories. Circulation 1998;97:1837-
47.
27. Ridker PM, Buring JE, Cook NR, Rifai N.
C-reactive protein, the metabolic syndrome,
and risk of incident cardiovascular events: an
8-year follow-up of 14 719 initially healthy
American women. Circulation 2003;107:
391-7.
28. Pischon T, Hankinson SE, Hotamisligil
GS, Rifai N, Rimm EB. Leisure-time physi-
cal activity and reduced plasma levels of obe-
sity-related inflammatory markers. Obes Res
2003;11:1055-64.
29. Imhof A, Froehlich M, Brenner H, Boe-
ing H, Pepys MB, Koenig W. Effect of alco-
hol consumption on systemic markers of in-
flammation. Lancet 2001;357:763-7.
30. Pradhan AD, Manson JE, Rifai N, Buring
JE, Ridker PM. C-reactive protein, interleu-
kin 6, and risk of developing type 2 diabetes
mellitus. JAMA 2001;286:327-34.
31. Hotamisligil GS. The role of TNFalpha
and TNF receptors in obesity and insulin re-
sistance. J Intern Med 1999;245:621-5.
32. Ridker PM, Rifai N, Pfeffer M, Sacks F,
Lepage S, Braunwald E. Elevation of tumor
necrosis factor-alpha and increased risk of
recurrent coronary events after myocardial
infarction. Circulation 2000;101:2149-53.
33. Cesari M, Penninx BW, Newman AB, et
al. Inflammatory markers and cardiovascular
disease (The Health, Aging and Body Com-
position [Health ABC] Study). Am J Cardiol
2003;92:522-8.
34. Richey Sharrett A, Coady SA, Folsom
AR, Couper DJ, Heiss G. Smoking and dia-
betes differ in their associations with sub-
clinical atherosclerosis and coronary heart
disease — the ARIC Study. Atherosclerosis
2004;172:143-9.
35. Jousilahti P, Vartiainen E, Tuomilehto J,
Puska P. Sex, age, cardiovascular risk fac-
tors, and coronary heart disease: a prospec-
tive follow-up study of 14 786 middle-aged
men and women in Finland. Circulation
1999;99:1165-72.
36. Ridker PM, Rifai N, Stampfer MJ, Hen-
nekens CH. Plasma concentration of inter-
leukin-6 and the risk of future myocardial
infarction among apparently healthy men.
Circulation 2000;101:1767-72.
37. Danesh J, Whincup P, Walker M, et al.
Low grade inflammation and coronary heart
disease: prospective study and updated meta-
analyses. BMJ 2000;321:199-204.
38. Ridker PM, Cook N. Clinical usefulness
of very high and very low levels of C-reactive
protein across the full range of Framingham
Risk Scores. Circulation 2004;109:1955-9.
39. van der Meer IM, de Maat MP, Kiliaan
AJ, van der Kuip DA, Hofman A, Witteman
JC. The value of C-reactive protein in cardio-
vascular risk prediction: the Rotterdam Study.
Arch Intern Med 2003;163:1323-8.
40. Pearson TA, Blair SN, Daniels SR, et al.
AHA guidelines for primary prevention of
cardiovascular disease and stroke: 2002 up-
date: Consensus Panel guide to comprehen-
sive risk reduction for adult patients without
coronary or other atherosclerotic vascular
diseases. Circulation 2002;106:388-91.
Copyright © 2004 Massachusetts Medical Society.
Copyright © 2004 Massachusetts Medical Society. All rights reserved.
Downloaded from www.nejm.org at RIKSHOSPITALET HF on February 18, 2008 .