RESEARCH ON GENETIC DIVERSITY OF DIFFERENT NATIVE MELIENTHA SUAVIS IN VIETNAM''S NORTHERN MOUNTAINOUS AREA BY SIMPLE SEQUENCE REPEAT MARKERS
Bạn đang xem bản rút gọn của tài liệu. Xem và tải ngay bản đầy đủ của tài liệu tại đây (783.53 KB, 10 trang )
No.24_December 2021 |p.39-46
TẠP CHÍ KHOA HỌC ĐẠI HỌC TÂN TRÀO
ISSN: 2354 - 1431
/>
GENETIC RELATIONSHIPS OF SEVERAL LOCAL
MELIENTHA SUAVIS PIERRE IN VIETNAM’S NORTHERN
MOUNTAINOUS AREA BY SIMPLE SEQUENCE REPEAT
MARKERS
Nong Thi Hai Yen1, Nguyen Minh Tuan1, Nguyen Xuan Vu1, Luu Hong Son1, Vu Thi Hanh2, Duong Huu Loc1*,
1Thai Nguyen University of Agriculture and Forestry, Thai Nguyen city, Vietnam
2 ViettNam National University, Ha Noi, Vietnam
Email andress:
/>
Article info Abstract:
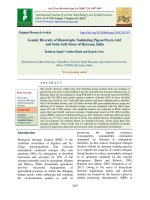
Recieved: 10/6/2021 The study aims to evaluate the genomic diversity of some local melien-
Accepted: 1/12/2021 tha suavis Pierre SSR technique. By using 10 primer pairs to analyze 20
melientha suavis Pierre lines shows that the number of Alleles were from
Keywords: 2 to 4 alleles and the polymorphic information contents ranged from 0.05
Melientha suavis Pierre, to 0.15. Forty-one alleles were identified with avarage of 0.15 alleles.
genetic diversity, molecu- The SSR technique shows that the differences among the varieties genes
lar indicator, biodiversty, based on the number of alleles and the polymorphic information contents.
local M. suavis. P. It means that the gene of the local melientha suavis Pierre has been
divided into 5 groups. The genetic variation coefficience among largest
genetic dif-ferences is obtained approximately 3%.
|39
No.24_December 2021 |p.6-13
TẠP CHÍ KHOA HỌC ĐẠI HỌC TÂN TRÀO
ISSN: 2354 - 1431
/>
NGHIÊN CỨU ĐA DẠNG DI TRUYỀN HỆ GEN TẬP ĐỒN
RAU NGĨT RỪNG BẢN ĐỊA (MELIENTHA SUAVIS PIERRE)
KHU VỰC MIỀN NÚI PHÍA BẮC VIỆT NAM
Nông Thị Hải Yến1, Nguyễn Minh Tuấn1, Nguyễn Xuân Vũ1, Lưu Hồng Sơn1, Vũ Thị Hạnh2, Dương Hữu
Lộc1*,
1Đại học Nông Lâm - Đại học Thái Nguyên, Việt Nam
2 Khoa Khoa học & Công nghệ thực phẩm, Đại học Quốc Gia, Việt Nam
Địa chỉ email:
/>
Thông tin bài viết Tóm tắt
Ngày nhận bài: 10/6/2021 Nghiên cứu này mong muốn tìm ra sự khác biệt về vật chất di truyền học của
Ngày duyệt đăng:1/12/2021 tập đoàn cây Rau ngót rừng bản địa lâu năm, trồng từ hạt thu thập tại khu vực
Miền núi phía Bắc Việt Nam. Qua kết quả nghiên cứu đã chỉ ra về sự đa dạng
Từ khóa: di truyền về hệ gen ở tập đoàn Melientha suavis Pierre bằng kỹ thuật SSR sử
Melientha suavis Pierre, dụng thống kê các phân đoạn DNA, minh chứng sự sai khác đó qua nội dung
đa dạng di truyền, đa triển khai ở 10 cặp chỉ thị và trên 20 mẫu giống ngót rừng bản địa đã ghi nhận;
dạng sinh học, hệ gen, cây số alen giao động từ 2 đến 4 alen và chỉ số đa dạng giao động từ 0,05 đến 0,15,
bản địa. đã phát hiện được 41 alen, số alen đạt trung bình là 0,15 alen. Thơng qua một
số kỹ thuật trong sinh học phân tử đã cho thấy hệ gen giữa một mẫu giống có
xuất hiện sự sai khác thông qua ở số lượng các alen và chỉ số đa dạng. Điều đó
chỉ ra rằng, hệ gen của tập đồn cây ngót rừng bản địa miền núi phía Bắc
Việt Nam trồng từ hạt đã có sự phân ly, phân bố thành 5 nhóm chính. Bằng
minh chứng hệ gen khoảng cách di truyền khác xa nhất khi so sánh một sô
giống trong nghiên cứu với hệ số khác biệt là 3,0% và phân loại các giống theo
sơ đồ về mối quan hệ di truyền.
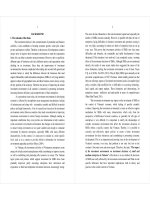
1. Introduction and proof of the genetic diversity of the genome by
molecular biomarkers.
Melientha suavis Pierre (other names: cassava
plant) is a rare and special forest vegetable with high This study is applied from the basic field of life
commercial value on the market listed in the Viet- sciences and meeting current practice to bring data
nam Red Book. This is an endemic vegetable in the of indigenous genetic resources to the public,
limestone mountains, having the scientific name contribut-ing to the embellishment and preservation
Me-lientha Suavis Pierre, belonging to the family of human genomes, information data to shed more
Opil-iaceae, order Santalales. The northern light on bio-diversity and especially conservation of
mountainous ecological region, where the research indigenous genetic resources in the Northern
samples were collected, has a tropical monsoon Mountains region of Vietnam.
climate and com-plex topography, so a number of
different climate sub-regions have been formed. 2. Materials and Methods
The diversity of climate and changes in living en- 2.1. Plant samples
vironment is one of the causes leading to the diversity
of biological characteristics to adapt to external con- Twenty indigenous citrus grown in the mountain-
ditions. This is considered to be one of the reasons for ous region of Northern Vietnam were collected for
the diversity of the genome of the native plant species this study studied. Sample symbols and collection
population, and is the basis for research, evaluation, loca-tions are shown in Table 1.
40|
No.24_December 2021 |p.6-13
Table 1. Location of citrus types used in the study
Sr.no Sampling location Code nam Sr.no Sampling location Code name
1 Vo Nhai, Thai Nguyen 01VN-TN 11 Bac Son, Lang Son 11BS-LS
2 Dinh Hoa, Thai Nguyen 02DH-TN 12 Huu Lung, Lang Son 12HL-LS
3 Dong Hy, Thai Nguyên 03DH-TN 13 Tan Trao, Tuyên Quang 13TT-TQ
4 Na Ri, Bac Kan 04NR-BK 14 Luc Yen, Yen Bai 14LY-YB
5 Phu Thong, Bac Kan 05PT-BK 15 Van Chan, Yen Bai 15VC-YB
6 Ba Be, Bac Kan 06BB-BK 16 Nho Quan, Ninh Binh 16NQ-NB
7 Hoa An, Cao Băng 07HA-CB 17 Thanh Son, Phu Tho 17TS-PT
8 Nguyen Binh, Cao Băng 08NB-CB 18 My Duc, Ha Noi 18MD-HN
9 Bao Lac, Cao Bang 09BL-CB 19 Bac Quang, Ha Giang 19BQ-HG
10 Luc Nam, Bac Giang 10LN-BG 20 Binh Lieu, Quang Ninh 20BL-QN
2.2. Methods ment was conducted with 10 pairs of SSR primers,
the nucleotide sequences of primer pairs for PCR-
Experiment collection: Samples used for DNA SSR reaction, as proclaimed by Goh Pik Seah ELCY
collection were taken from young shoots and leaves, (2011). Primers were synthesized by Genotech, Ko-
and stored for no more than 1 week at -20 oC before rea Advanced Institute of Science and Technology -
doing the experiment. Evaluation of genomic diver- KAIST (South Korea), and the order of primers pre-
sity was performed by SSR technique. The experi- sented in Table 2.
Table 2: SSR primers used in this study
Primer Forward primer (F) & Dimen- Base Primer Forward primer (F) & Dimen- Primer
name Reverse primer (R) from sion type name Reverse primer (R) from sion name
(bp)) (bp)
SSR- 5’ to 3’ (TC)5 SSR-006 5’ to 3’
001 CT
F GTCAATACGATCCAC- (TC)5 F ATAAAATGAGGGCG- (CT)8(G)
GGG CCAG
231-259 203-207 (CT)
TTGAGCCAAAGAAC- GCATTTTCA- 6(TG)8
R CAGTCTCGCA
R GGTG
CAGCTGCTGAAGAA- TTTGCAAAGTTGG-
SSR- F CAACA 214–218 (AGC)6 SSR-007 F GAGGA 268–282 (CAG)4
002 GTTGCT-
TAAAAATCCCGTCAC-
SSR- R GAACTTGTCCGC
003 R CGC
SSR- ATCTAGGGTTTTGC- 218–228 CAG)5 AAATAGAGCACGGG- (ACC)3
004 F CGGA F CCAT
SSR-008 GCATCGCTATTGC- 278–312 (GCT)
SSR- ATCCGTACACGCTG- (ACC)3
005 R CACT R CGTTA
CCACGT- TTAGCCCAACAGTG-
F GCTTTCAACCAT F CCC 280–300 (TGC)5
AGGGAAGGGAGTG- 171–176 (CCG)4 SSR-009
R CAATG GGAAGCGCTT-
R GAACCTTT
AGATTGCAGACTGG- (TG)2 GAGATGCAGACGGCT-
F CGAA 204–268 (T)2 SSR-010 F CAC 253–281 (GT)9
(TG)4
DNA extraction protocol mins), remove the floating part of solution, repeat this
step 1-2 times. Add 800µl of extraction buffer (Tris
DNA is extracted from the young leaves of each HCl 0,1M pH 8; EDTA 0,5M pH 8; NaCl 6M; -Me-
sample. Using 300 mg of young leaves and grind in captoethanol 0,14M; CTAB 4%), incubate at 65oC for
liquid nitrogen into a fine powder, then add 1ml of 90 minutes to extract DNA. Store the sample at room
wash buffer (Tris-HCl 1M pH 8, EDTA 0,5M pH 8, temperature for 10 minutes, add 0.8 ml of Chlo-
Sorbitol 0,35M, Na2HPO4 0,4%), shaking the test tube roform/Isoamyl alcohol (24:1), gently shake the tube
for 40 seconds, then centrifuge (12000 rpm, 4oC, 12
|41
No.24_December 2021 |p.6-13
for 15 minutes. Then centrifuge 12,000 rpm for 15 Evaluation of PCR-labeled probes was conducted
minutes at 4oC and use the pipette to suck the upper by agarose gel electrophoresis
layer into new eppendorf 2ml tube. Add equal Isopro-
panol volume (cool) and gently shake, store the sam- Agarose gel electrophoresis
ple at 4oC for 30 minutes, centrifuge at 12000 rpm for
10-15 minutes at 4oC. Remove the floating solution, The product obtained from PCR-SSR reaction is
wash the DNA precipitate with 500μl alcohol 70%, electrophoresed on 0.8% agarose gel, in buffer TAE
centrifuge 12,000rpm for 4 minutes at 4oC, repeat this 1X and run electrophoresis at 110 volts for 1 hour.
step 2 times. Then remove the floating solution and After that, imbue gel with 0.5% EtBr solution, which
keep only the precipitate of DNA. Dry the DNA in the is capable of intermingling with the nucleic acid bas-
ventilated cabinet and then add 50μl of deionized wa- es that illuminate them under ultraviolet (UV) with
ter and store it at -200C before conducting other tests. wavelength of λ ≈ 300 nm in the form of orange red
Total DNA was determined by spectroscopic method. lines, easy to observe or capture to evaluate the re-
sults of the experiment [8].
The principle of the method is based on the absorp-
tion of light at the wavelenght of 260nm and 280nm Data processing and building of genetic cor-
purine and pyrimidine bases. One unit of OD260nm(Op- relation tree diagram
tical Density 260 nm) is equal to a concentration of 50
μg/ml for the double-stranded DNA solution which is Based on the image results of electrophoresis of
calculated by the formula: CDNA (µg/ml) = OD260nm x PCR products and the emergence of SSR bands of
50 x dilution coefficient The DNA solution was con- Citrus for each pair of primers as the basis for data
sidered to be clean (without protein) when the ration analysis. Data analysis on digitalization convention:
OD260nm /OD280nm is between 1.8 - 2.0 [8]. Number (1) appearance of SSR band. Number (0)
does not appear SSR band.
PCR – SSR reaction
The digitized data is processed by computer to
The PCR - SSR reaction is based on PCR technique, analysis data. Of which, the H - genetic variation in-
which allows rapid cloning of a DNA sequence many dex for each molecular marker is determined by the
times in a few hours. PCR is performed inside the ther- Microsoft Office Excel 2007 with the formula.
mal cycler where DNA template, Taq-polymerase, spe-
cialized primers and four type of dNTPs were included H = 1 - ∑ Pi2
[8]. The PCR reaction performs the following steps: Mix
the above-mentioned components in 2ml eppendorp tube (Pi is the allele repeat frequency of ith of each
and transfer the mixture to a 25 μl PCR tube. molecular marker).
Table 3: PCR-SSR Reaction component The tree diagram was built to determine the
genet-ic distance of the crop varieties using NTSYS
Sr.no Component Concentra- Volume (µl) - ver-sion running on personal computer 2.0 [8].
tion
1 10x Buffer 3. Results and discussion
2.5
3.1. The Polymorphic of the SSR markers of
2 MgCl2 25mM 1.5 me-lientha suavis Pierre samples
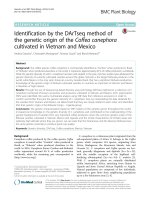
3 Forward primer 10 pmol 1.0 Results of total DNA electrophoresis on 0.8%
agarose gel; 60 minutes; the Intron 1000bp marker
4 Reverse primer 10 pmol 1.0 showed that all 20 samples were suitable for
conduct-ing subsequent use (Figure 1), according to
5 dNTPs 100 µM 1.5 the simul-taneous use of methods to determine
concentration and DNA by spectroscopy.
6 AND taq polymerase 200 ƞg/μl 0.2
7 AND structure 200 ƞg/μl 2.0
8 Deionized water 15.3
Total
vol- 25
ume
The mixture is centrifuged at 3000 rpm, so that the
above components settled to the bottom of the PCR tube
and then PCR reaction is about to happen. The heat cy-
cle for the reaction is 95oC for 4 minutes; repeat 33 cy-
cles with 95 oC/45 seconds, 47oC to 59oC (depending on
primer)/45 seconds, 72oC/1 min; 72 oC/9 minutes; stor-
age of product at 4oC.
42|
No.24_December 2021 |p.6-13
Figure 1. Total DNA electrophoresis spectrum obtained from melientha suavis Pierre samples
The results are based on the analysis of 10 Melientha suavis Pierre samples using 20 primer pairs of SSR
marker. Size of alleles, number of alleles and variation index of the primers are presented in Table 4.
Table 4: Number of alleles and variation index of SSR primer pairs
Sr.No Name of Allele size Number Variation Sr.No Name of SSR Allele size Number Variation
SSR prim- (bp) of allele index primer pair (bp) of allele index
1 6
2 er pair 209–217 3 0,392 7 SSR 006 278–312 6 0,211
3 SSR 001 214–218 2 0,059 8 SSR 007 280–300
4 SSR 002 218–228 4 0,095 9 SSR 008 256–281 5 0,391
5 SSR 003 171–176 2 0,050 10 SSR 009 204–268
SSR 004 268–282 4 0,072 SSR 010 253–281 2 0,059
SSR 004
6 0,466
6 0,430
Average 4.15 0.55 Average 4.15 0.55
The variation index H is evaluated as the degree in the genome. The presence of markers and the rel-
of appearance of the primer pair in each sample. In ative distance between them reflect the degree of
the experiment, the variation index is calculated on variability among individuals, crops, or species in
the basis of the presence or absence of SSR band in the population. Creatures have the ability to
each primer, sample/kind of melientha suavis Pierre duplicate their DNA with high accuracy, but many
to determine the genetic variation index H for each mechanisms can modify DNA structure, as simple
molecular marker. Overall evaluation in 10 pairs of as base pairs or more complicated as inversion,
results marker shows that; allele number is ranging repetition, or seg-mentation, etc. so, molecular
from 2 to 8 alleles and the variation index is ranging marker is considered as an effective tool for
from the lowest 0.15 to the highest 0.466 [4] [10]. evaluating genetic variation for crop selection.
Table 4 shows that the SSR 006, SSR 009 and SSR The experiment results show that the variance in-
010 primer pairs show the highest variation with 8 al- dex of the SSR index is varied from 0.050 to 00.466,
leles and indicated the lowest variation of SSR 002, the average value for the SSR marker is 0.15. This
SSR 004 and SSR 008 with 2 alleles. The average val- marker is asymptotic compared to the research con-
ue is 4.15 allele per molecular marker. This result ducted by Hidaka T (2012) on 24 kinds of Citrus in
shows that the number of alleles is equivalent to Northern Japan (average variation index of 0.56) [9].
evaluations of Goh Pik Seah ELCY (2011) or Behrouz Results taken from PCR-SSR reaction, products are
Golein (2012) and many geneticists interested in checked on agarose gel 0.8%. Results show that,
melientha suavis Pierre. The number of alleles is among 10/10 SSR markers which are used for the
normally having from 2 to 12 alleles per marker analysis of genetic variation, all 20 SSR markers are
polymorphic, electrophoresis of 22 lines/crops have
In terms of the index variation (H) value, the in- SSR bands with size of 100 bp to 300 bps (figure 2
dex is reflected as the markers on the DNA sequence
|43
No.24_December 2021 |p.6-13
and 3). This is the database used for the NTSYS - version running on personal computer 2.0. to determine co-
efficients which are the same or different of the melientha suavis Pierre by tree diagram.
Figure 2. PCR electrophoresis spectrum of SSR 001 primer pair
Figure 3. PCR electrophoresis spectrum of SSR 009 primer pair
Results of PCR electrophoresis analysis of 10 comparison with the Hidaka T (2012) on 24 citrus
pairs of primers for 20 indigenous Melientha suavis va-rieties in Northern Japan (average variation index
Pierre cultivars, PCR clones specific for each SSR of 0.56 and had an average of 6.45 alleles of total 30
molecular marker and SSR fragment size close to SSR markers [9]
corresponding size of each SSR marker.
The average of total alleles in the experiment
Analysis of DNA fragments which are cloned were lower than those reported, here it is assumed
showed 41 alleles, with the average of 4.15 alleles. that the native Melientha suavis Pierre consortium is
This indicates that the genomes of indigenous Me- genet-ically more conservative than that reported by
lientha suavis Pierre growing from seeds have a sig- pre-vious studies in the consortium of native trees.
nificant separation. SSR technique revealed the dif- This indicated that Melientha suavis Pierre in the
ferent of genome between cultivars in the number of Northern Mountains of Vietnam has high genetics
alleles and variation indexes. The result of this exper- but still still exhibits diversity [7].
iment is lower than in previous experiments on citrus
genetic variation as proclaimed by Kinley Dorji et. al The genetic differences of cultivated variety
(2015) on Melientha suavis Pierre cultivars in 50 Asian
countries with average allele of 7.82 [3], or in The genetic variance of cultivated variety in the
research was analyzed based on SSR molecu-
44|
No.24_December 2021 |p.6-13
lar markers with NTSYS 2.0 software. From that we seeds naturally and has cross-pollination leading to the
can determine the genetic difference coefficient and segregation into many different lines/varieties.
mapping of the relationship between the variet-ies of Therefore, this is a rich source of materials to hybrid-
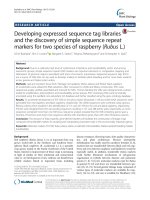
Melientha suavis Pierre (Figure 4). The result ize, select and conserve indigenous genetic resources.
showedgenetic variation ranging from 0.0% to 3.0%.
This difference has proved that the plant grows from
Figure 4. Diagram of genetic relationship
of Melientha suavis Pierre cultivars based on SSR analysis
The tree diagram shows that 20 cultivars which are In the present study, a genetic difference from 0.0%
divided into 5 main branches. The first one is only Nho to 3.0% showed that this distance is closer to the same
Quan Melientha suavis Pierre. The second branch is evaluation on citrus in the Southern Vietnam, Nguyen
only My Duc Melientha suavis Pierre. The third branch Huu Hiep et al. (2004) published 68 cultivar specimens
includes 6 varieties: Binh Lieu (Quang Ninh), Ba Be including citrus and lemon, the genealogy diagram is
(Bac Kan), Luc Yen (Yen Bai), Bac Son (Lang Son), divided into four main groups and the genetic variation
Dinh Hoa (Thai Nguyen), and Nguyen Binh (Cao ranging from 0.0 to 4.3%
Bang). The fourth branch consists of five varieties: [1]. The results also show that the genetic variation
Thanh Son (Phu Tho), Van Chan (Yen Bai), Huu Lung in citrus in Vietnam is lower than that publication of
(Lang Son), Tan Trao (Tuyen Quang). The fifth branch Sadaf Altaf (2014), Goh Pik Seah ELCY (2011) or
includes the remaining seven varieties: Bac Quang (Ha Xiao-Yan Yang (2012) in Asian countries with the
Giang), Luc Nam (Bac Giang), Hoa An (Cao Bang), value varies from 0.0 – 10.0% [10],[11].
Phu Thong (Bac Kan), Vo Nhai (Thai Nguyen), Na Ri
(Bac Kan), and Dinh Hoa (Thai Nguyen). Here, The The general classification based on genomics in
first (16 NQ–NB) and second (18MD-HN) groups are this study showed that the genetic distance in
not located in the center of the northern mountainous Melientha suavis Pierre group consisted of 5 groups
area in terms of geography and topography. (I, II, III, IV and V – figure 3). This correlation, we
continue to evaluate on a broader geographical scale
The analysis of genetic differences by the larger enough for genomic related analysis.
program NTSYS pc version 2.0 also showed that
group I and group II had a genetic distance of 0.3% 4. Conclusion
compared to the remaining groups in the experiment.
The assessment of genetic diversity on Melientha
suavis Pierre group by SSR technique using statistical
analysis of DNA segments were conducted in 10 pairs
|45
No.24_December 2021 |p.6-13
of markers and over 20 samples of indigenous forest influences the leaf cell wall glycoproteome in
jasmine varieties were recorded; the results showed Arabidopsis thaliana. Plant, Cell and
the number of alleles ranges from 2 to 4 alleles and Environment (UK) 38, pages 375–384.
the diversity index ranges from 0.05 to 0.15, 41
alleles have been detected, the average number of [6] Nguyen Huu Hiep,N.H., Dung, T.N., Son,
alleles is 0.15 alleles. D.T and Duoc, N.V (2004). Biodiversity of
citrus trees in Go Quao district, Kien Giang
The experiments on the SSR technique have province. Science Journal 2004 No 1, pp: 111-
shown that the genomes between varieties have 121.
differences through the number of alleles and
diversity index. This indicates that the genome [7] Loc, D.H., Vu, N.X., Thuy, V.T.T., Tam, N.T.
indigenous Melientha suavis Pierre grown from (2017) Agro-biological characteristics and genetic
seeds in the Northern mountainous region of relationships of some citrus varieties (Citrus
Vietnam has been segregated and distributed into 5 Recutilata Blanco) in the Northern mountainous
main groups. The genetic evidence showed that the area Vietnam. Journal of Science and Technology,
genetic distance is the furthest when compared to Thai Nguyen University Publishing House,
the varieties with a coefficient of difference of 3.0%. 164(04): pp. – 182.
REFERENCES [8] Mau, C.H (2008). Modern methods of
genetic analysis in plant breeding. Thai Nguyen
[1] Mohd Anwar Ahmad, Rashmi Gaur (2012). University Publishing House. 50 (2008), pp: 55
Comparative biochemical and RAPD analysis in two – 107.
varieties of rice (Oryza sativa) under arsenic stress
by using various biomarkers. National Library of [9] Shidaka T., Omura M (1989). Control of
Medicine. USA, Volumes 217–218, 30 May 2012, embryogenesis in Citrus cell culture.
pages 141–148. Regeneration from protoplasts and attempts to
establish a callus bank. Bull Fruit Tree Res.
[2] Sadaf Altaf, Muhammad M. K. (2014). Stn. Okitsssu, 16, pages 1-17.
Morphogenetic characterization of seeded and
seedless varieties of Kinnow Mandarin (Citrus [10] Goh Pik Seah ELCY, Mansor Clyde
reticulata Blanco). Australian Jounal of Crop
Science (AJCS) 2014 (11), pages 1542-1549. MAHANI, Yong-Jin PARK, Normah Mohd
[3] Kinley Dorji, Chinawat Yapwattanaphun
(2015). Assessment of the genetic variability NOOR (2011). Simple Sequence Repeat (SSR)
amongst mandarin (Citrus reticulata Blanco)
accessions in Bhutan using AFLP markers. BMC profiling of ultivated Limau Madu (Citrus
Genetics (2015) 16:39 DOI 0.1186/s12863, pages
015-019. reticulata Blanco) in Malaysia. Biotechnol. Fac.
[4] Behrouz Golein (2012). Assessing genetic
Sci. Technol., Univ.Kebangsaan
variability in male sterile and low fertile citrus
Malaysia,43600UKM Bangi, Selangor,
cultivars utilizing simple sequence repeat markers
Malaysia Fruits, pages 67-74.
(SSRs). African Journal of Biotechnology, 11(7),
[11] Xiao-Yan Yang Jin-Xia Xie, Fang-Fang
pages 1632-1638.
Wang, Jing Zhong, Yong-Zhong Liu, Shu-Ang
[5] Nighat Sultana, Hannah V. Florance, Alex Johns,
Peng (2011). Comparison of ascorbate
Nicholas Smirnoff (2015). Ascorbate deficiency
metabolism in fruits of two citrus species with
obvious difference in ascorbate content in pulp.
Journal of Plant Physiology 168 (02), pages
2196–2205.
[12] Wallace, H. M. (2002). Effect of self –
pollination and cross – pollination on
Clementine madarin. University of the
Sunshine Coast, Austraylia, pages 56–57.
46|