Nghiên cứu về chất lượng cảm nhận về dịch vụ của khách hàng tại bộ phậntiền sảnh vinpearl condotel iverfront da nang
Bạn đang xem bản rút gọn của tài liệu. Xem và tải ngay bản đầy đủ của tài liệu tại đây (295.18 KB, 24 trang )
TRƯỜNG ĐẠI HỌC DUY TÂN
VIỆN ĐÀO TẠO VÀ NGHIÊN CỨU DU LỊCH
TÓM TẮT KHÓA LUẬN TỐT NGHIỆP
ĐỀ TÀI:
NGHIÊN CỨU VỀ CHẤT LƯỢNG CẢM NHẬN VỀ
DỊCH VỤ CỦA KHÁCH HÀNG TẠI BỘ PHẬNTIỀN
SẢNH VINPEARL CONDOTEL IVERFRONT DA
NANG
GVHD: ThS. LÊ ĐÌNH AN
SVTH: BÙI UYÊN PHƯƠNG
MSSV: 24207212451
LỚP : K24-PSU-DLK1
Đà Nẵng, Năm 2022
Cơng trình được hoàn thành tại trường
ĐẠI HỌC DUY TÂN
Người hướng dẫn khoa học: ThS. Lê Đình An
Người phản biện: Bùi Uyên Phương
Khóa luận sẽ được bảo vệ tại Hội đồng chấm
KLTN họp tại Trường Đại học Duy Tân,
vào hồi ..... giờ ..... ngày ... tháng ... năm 20....
Có thể tìm hiểu KLTN tại Thư viện
Trường Đại học Duy Tân
1
CHAPTER 1: INTRODUCTION
1.1. Objectives of the project
1.1.1 Common goals
The topic "Research on perceived service quality of customers
at the front desk of Vinpearl Condotel Riverfront Da Nang" was
studied through the following influencing factors: service process,
staff, facilities and convenience.
1.1.2. Detail goal
1.2. Research object & scope (state of research problem)
1.2.1. Research subjects
Customers use services at Vinpearl Condotel Riverfront Da Nang
during the study period.
1.2.2. Research scope
1.3. The urgency of the process
Through the research essays of the students of the Institute of
Tourism Research and Training from the previous term. I found that
most of the assignments on improving service quality at Vinpearl
Condotel Riverfront Da Nang pointed out the actual situations that
the facility encountered, but the articles did not clearly show
solutions to improve the quality of services. On the facility side,
Vinpearl Condotel Riverfront Da Nang has been focusing on the
customer's service quality perception, collecting customer opinions
through the evaluation form of the facility's service quality.
However, the establishment only stops at the reference level to draw
experience, has not yet provided a specific measurement scale for in-
depth analysis and evaluation of this issue.
Therefore, "Research on perceived service quality of
customers at the front desk of Vinpearl Condotel Riverfront Da
2
Nang" will clarify the influencing factors more deeply than research
essays from key through data collection, data processing and analysis
methods. And this research is very important for the establishment in
planning appropriate and sustainable strategies to improve the
perceived service quality of customers in the coming time. Because
of the time limit, in this article, we only study the following four
factors: service process, staff attitude, facilities and convenience.
1.4. The structure of the graduation thesis
Chapter 1: The Beginning
Chapter 2: Theoretical foundations and research models
Chapter 3: Research Methods
Chapter 4: Research results
Chapter 5: Discussion and recommendations
CHAPTER 2: THEORETICAL BASIS AND RESEARCH
MODEL
2.1 General overview of the hotel
2.1.1 Hotel concept and hotel business
2.1.1.1 Hotel concept
2.1.1.2 Hotel business activities
2.1.2 Products of the hotel
2.1.3 Characteristics of hotel products
2.2 General overview of perceived quality of hotel services
2.2.1 Concept and relationship between perceived service and
service quality
2.2.2 Characteristics of perceived quality of hotel services
2.3 Staff – manager
2.4 Service Process
2.5 Facilities
3
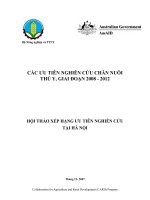
2.6 Research model of service quality under customer's
perception and satisfaction
- (Tangibles) (Perceived (Perceived
- (Reliability) Service) Service
- (Responsivenes) Quality)
- (Assurance) (Expected
- (Empathy) Service)
Figure 2.3. Perceived service quality model (Parasurama, Zeithaml
& Berry, 1998)
2.7.1 Proposed research model
Figure 2.4. Research proposal model of the author
2.7.2 Research hypothesis
4
CHAPTER 3: RESEARCH METHODS
3.1 Overview of Vinpearl Condotel Riverfront Da Nang
Address: 341 Tran Hung Dao, An Hai Bac ward, Son Tra district, Da
Nang city.
Phone: +84 0236 364 2888 Fax: +84-510-3940 999
Website:
Email:
Condotel Riverfront Danang was also honored as the leading
riverfront hotel in Vietnam thanks to its beautiful location with more
than 850 rooms facing the Han River and Dragon Bridge, providing a
comfortable resort experience for tourists.
3.1.2 Types of rooms
- Executive Suite River View
- Executive Suite
- Studio King
- Studio Twin
3.1.3 Restaurants in hotels
3.1.4 Additional services
5
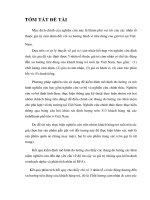
3.2 Research process
Theoretical Original Preliminary
basis scale research: Interview,
Table of The scale group discussion
questions and model
Adjusted
Formal Interviews collected
Research dữ liệu
Check the Cronbach's coefficient Alpha
scale Adjust EFA factor analysis
the model Regression analysis
Model Conformity check
testing
Figure 3.2 Research process
3.3 Methods of data collection
3.4 Methods of data processing and analysis
3.4.1 Descriptive statistical analysis methods
3.4.2 Method of testing the reliability of the scale Cronbach's
Alpha by coefficient
3.4.3 Exploratory factor analysis method EFA
6
3.4.4 Correlation regression analysis method
3.5 Building a scale
The questionnaire was built from the proposed scale.
Part 1. ASSESSMENT CRITERIA OF VINPEARL CONDOTEL
RIVERFRONT DA NANG's SERVICE QUALITY
Please indicate your own thoughts and evaluations by ticking () in
the number box that matches your choice through the questions in
the sections below with the following convention:
1: Very Bad 2: Bad 3: Average 4: Good 5: Very Good
Symbo Content Criteria Rating Level
l
Staff 1 2 34 5
NV1 Staff are friendly, polite, courteous 12345
NV2 Staff have neat, good-looking clothes 12345
NV3 Employees understand and respond to your
requests 12345
NV4 Staff can communicate with guests in popular 12345
NV5 languages (Vietnamese, English, Korean)
Staff is always ready to actively serve you 12345
PV1 12345
PV2 Service process 12345
PV3 Quick check-in process 12345
PV4 Accurate and professional service process 12345
PV5 Quick response to your requests
During the stay, the staff provides general
information about the hotel
Quick check-out process
Facilities
7
Symbo Content Criteria Rating Level
l 12345
Landscape, the view of the hotel is attractive 12345
HH1 Equipment commensurate with star standards 12345
HH2 The layout of areas and facilities to meet your
HH3 requirements 12345
Equip and ensure safe means of rescue, rescue 12345
HH4 and fire prevention
Fresh air, relax
HH5
Convenience
TL1 Location of hotel is convenient for arrival and 12345
departure
TL2 Personal care facilities are always available 12345
(massage, sauna, gym, etc.)
TL3 The swimming pool is always ready to serve you 1 2 3 4 5
TL4 Convenient to go to local tourist attractions 12345
General satisfaction
HL1 Meet the expectations of guests about the 12345
services at the hotel
HL2 You will come back to the hotel in the future 12345
HL3 You will recommend the hotel to your friends 12345
and relatives
HL4 You satisfied when using the service at the hotel 1 2 3 4 5
Other comments from customers: …………………………………
Part II. CUSTOMER INFORMATION
1. Gender: Male Female
2. Age:
8
Under 30 years old From 30 to under 40 years old
From 40 to under 50 years old
From 50 to under 60 years old Over 60 years old
3. Income:
Under 10 million 10 to less than 15 million VND
15 to less than 20 million VND Over 20 million VND
4. Family status:
Single Married but no children Married and have children
5. Education:
Graduated under the university Graduated Master
6. Current job:
State cadres and civil servants Business
Officials and employees in enterprises (not the State)
7. The number of times you use Vinpearl Condotel Riverfront Da
Nang:
First time Used 2 times
Used 3 times Used more than 3 times
THANK YOU AND BEST REGARDS FOR YOUR HELP
Source: Appendix 2, Bui Uyen Phuong (2022), Graduation Thesis.
CHAPTER 4: RESEARCH RESULTS
4.1 Research results
4.1.1 Description of the study sample
The process of distributing survey samples and collecting data will
start from 01/2022 to 04/2022 with a total of 250 samples emitted,
250 samples collected, with a valid number of 185 samples. Thus,
the database that has been processed and analyzed is 185 samples.
Table 4.1. Describe the characteristics of the survey sample
No. Characteristics of the survey Frequency Percentage
9
sample
Gender
1 Male 64 34.6
65.4
2 Female 121 100.0
Total 185 17.3
21.1
Age 38.9
14.6
1 Under 30 years old 32 8.1
100.0
2 From 30 to under 40 years old 39
35.1
3 From 40 to under 50 years old 72 31.9
33.0
4 From 50 to under 60 years old 27 100.0
5 Over 60 years old 15 41.1
31.9
Total 185 16.2
10.8
Family status 100.0
1 Single 65 35.1
41.6
2 Married but no children 59 23.2
3 Married and have children 61
Total 185
Income/month
1 Under 10 million VND 76
2 10 to less than 15 million VND 59
3 15 to less than 20 million VND 30
4 Over 20 million VND 20
Total 185
Education
1 Graduated under the university 65
2 Graduated 77
3 Master 43
10
Total 185 100.0
Current job
1 State cadres and civil servants 53 28.6
2 Officials and employees in 61 33.0
enterprises (not the State)
3 Business 71 38.4
Total 185 100.0
The number of times you use service of the hotel
1 First time 94 50.8
27.0
2 Used 2 times 50 13.5
8.6
3 Used 3 times 25 100.0
4 Used more than 3 times 16
Total 185
Source: Author's results from SPSS 20 software.
4.1.2 Model analysis
4.1.2.1 Measuring reliability by Cronbach's Alpha coefficient
(1) Reliability of the scale “Staff”
Table 4.2 Reliability of the scale “Staff”
Cronbach’s Alpha = 0,911
Scale Mean Scale Corrected Cronbach's
if Item Variance if Item-Total Alpha if Item
Deleted Item Deleted Correlation Deleted
NV1 14.5514 8.042 .786 .888
NV2 14.5351 8.022 .776 .890
NV3 14.4973 8.121 .725 .901
11
NV4 14.5568 7.922 .799 .885
NV5 14.4649 8.000 .782 .889
Cronbach's Alpha coefficient of the scale "Staff" is 0.911
(>0.6). The total correlation coefficient of all observed variables is
greater than 0.3. Thus, the reliability of this scale is satisfactory.
(2) Reliability of the “Facilities” scale
The Cronbach's Alpha reliability coefficient of the "Facilities" scale
is 0.898 (>0.6). The total correlation coefficient of all observed variables
is greater than 0.3. Thus, the reliability of this scale is satisfactory.
Table 4.3 Reliability of the “Facilities” scale
Cronbach’s Alpha = 0,898
Scale Mean Scale Corrected Cronbach's
if Item Variance if Item-Total Alpha if Item
Deleted Item Deleted Correlation
Deleted
HH1 16.83784 8.311 .758 .874
HH2 16.84865 8.488 .742 .877
HH3 16.78378 8.257 .789 .867
HH4 16.78378 8.355 .806 .863
HH5 16.87568 8.675 .651 .897
(3) Reliability of the scale “Service process”
Table 4.4 Reliability of the scale “Service process”
Cronbach’s Alpha = 0,942
12
Scale Mean if Scale Corrected Cronbach's
Item Deleted Variance if Item-Total Alpha if Item
Correlation Deleted
Item Deleted
PV1 18.0919 6.225 .785 .940
PV2 18.0432 6.368 .809 .935
PV3 18.0541 6.193 .832 .931
PV4 18.0054 6.125 .918 .916
PV5 18.0541 5.921 .880 .922
The Cronbach's Alpha reliability coefficient of the "Service
process" scale is 0.942 (>0.6). The total correlation coefficient of all
observed variables is greater than 0.3. Thus, the reliability of this
scale is satisfactory.
(4) Reliability of the scale “Convenience”
The Cronbach's Alpha reliability coefficient of the
"Convenience" scale is 0.906 (>0.6). The total correlation coefficient
of all observed variables is greater than 0.3. Thus, the reliability of
this scale is satisfactory.
Table 4.5 Reliability of the scale “Convenience”
Cronbach’s Alpha = 0.906
Scale Mean if Scale Variance Corrected Cronbach's
Item Deleted if Item Deleted Item-Total Alpha if Item
Correlation Deleted
TL1 11.7622 5.389 .869 .849
13
TL2 11.8757 5.577 .763 .889
TL3 11.7189 5.921 .752 .892
TL4 11.7838 6.062 .780 .883
(5) Reliability of the scale “Perceived value of service”
Cronbach's Alpha reliability coefficient of the scale "Perceived
value of service" is 0.864 (>0.6). The total correlation coefficient of
all observed variables is greater than 0.3. Thus, the reliability of this
scale is satisfactory.
Table 4.6 Reliability of the scale “Perceived value of service”
Cronbach’s Alpha = 0.906
Scale Mean if Scale Variance Corrected Cronbach's
Item Deleted if Item Deleted Item-Total Alpha if Item
HL1 11.8486 1.694 Correlation Deleted
HL2 11.8108 1.719 .712 .826
.714 .825
HL3 11.803 1.809 .657 .848
.765 .804
HL4 11.8054 1.679
4.1.2.2 Exploratory factor analysis EFA
(1) Factor analysis of observed variables belonging to the group
of independent variables
KMO coefficient = 0.859 > 0.5, so factor analysis is
14
appropriate with research data. According to the test results Bartlett's
statistic is 2689,069 with Sig significance level. = 0.000 < 0.05
indicates that the data used for factor analysis are completely
appropriate.
Table 4.7 KMO coefficient test and Bartlett's test of independent
variables
KMO and Bartlett's Test
Kaiser-Meyer-Olkin Measure of Sampling .859
Adequacy. 2689.069
171
Bartlett's Test of Approx. Chi-Square .000
Sphericity df
Sig.
Table 4.8 Total explanatory variance of the independent variables
Total Variance Explained
Extraction Sums of Rotation Sums of
Initial Eigenvalues Squared Loadings
Squared Loadings
Cumulative
%
% of
Variance
Total
Cumulative
%
% of
Variance
Total
Cumulative
%
% of
Variance
Total
(Component)
1 5.975 31.449 31.449 5.975 31.449 31.449 4.041 21.269 21.269
2 3.946 20.769 52.218 3.946 20.769 52.218 3.712 19.536 40.805
3 2.595 13.657 65.876 2.595 13.657 65.876 3.640 19.156 59.961
4 2.038 10.728 76.604 2.038 10.728 76.604 3.162 16.643 76.604
15
There are 4 factors extracted based on the criterion of
eigenvalue greater than 1, so these 4 factors summarize the
information of 19 observed variables included in EFA in the best
way. The total variance that these 4 factors extracted is 76.604% >
50%. The scales achieve convergence value is reasonable because
there is no item measuring 2 factors and all the factor weights are
high (>0.5) and all have convergent value.
(2) Factor analysis of observed variables belonging to the group of
dependent variables
Table 4.10 KMO coefficient test and Bartlett's Test of independent
variables
KMO and Bartlett's Test
Kaiser-Meyer-Olkin Measure of Sampling .825
Adequacy.
Bartlett's Test of Approx. Chi-Square 336.988
Sphericity df 6
Sig.
.000
Table 4.11 Total explanatory variance of the dependent variable
Total Variance Explained
16 Extraction Sums of Squared
Initial Eigenvalues Loadings
Cumulative
%
% of
Variance
Total
Cumulative
%
% of
Variance
Total
(Component)
1 2.841 71.026 71.026 2.841 71.026 71.026
2 .461 11.522 82.547
3 .395 9.883 92.431
4 .303 7.569 100.000
The results of EFA analysis of the dependent variable showed
that only 1 factor was extracted, with a KMO index of 0.825. Thus,
the factor analysis is appropriate, the EFA analysis is completed
because it has reached statistical reliability. Calculation results are as
shown in Table 4.10 and Table 4.11 above.
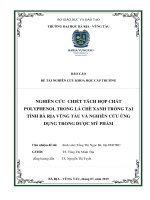
4.1.2.3 Correlation analysis
4.1.2.4 Regression analysis
The general equation is built:
SATISFACTION= Beta0 + Beta1X1 + Beta2X2 + Beta3X3 + Beta4X4
+ Beta5X5 + ei
In which: X1: Employee (NHANVIEN); X2: Facilities (CSVC); X3:
Service Process (QTPV); X4: Convenience (SUTIENLOI); ei: Wrong
number.
Performing the second linear regression analysis, the results are
obtained in Table 4.14 as follows:
Table 4.14 Results of 2nd linear regression coefficient analysis
17
Model Unstandardize Standar t Sig. Collinearity
Statistics
d Coefficients dized
Toleran VIF
Coeffici ce
ents .944 1.059
.998 1.002
B Std. Beta .945 1.058
Error Durbin-
Watson
(Constant) 1.849 .359 5.151 .000
NV .226 .059 .257 3.841 .000
CSVC .254 .056 .295 4.545 .000
TL .197 .052 .252 3.769 .000
Table 4.15 Summary model using Enter method
Mode R R Adjusted R Std. Error
l Square Square of the
Estimate
1 .487a .238 .225 .54261 1.959
Table 4.16 ANOVA Analysis Table
Model Sum of df Mean F Sig.
Square 18.805 .000b
Squares
5.537
Regression 16.610 3
Residual 53.292 181 .294
Total 69.901 184
The results of the regression analysis show that the coefficient
of determination R2 = 0.238, the statistic F = 18,805 with sig
18
significance < 1%. Thus, the estimated regression function is suitable
and 3 independent factors NHANVIEN, CSVC, SUTIENLOI
explain 23.8% variation in visitor satisfaction and perception.
- Statistics Durbin – Watson = 1,959 approximation value 2.
Therefore, autocorrelation does not occur.
- VIF variance exaggeration factors have very small values
and are far from the recommended threshold of 8. Therefore,
multicollinearity does not occur.
• The normalized linear regression has the form
SUHAIONG=0.257*NV+0.295*CSVC+0.252*STL
In which:
SUHAILONG: perceived quality and customer satisfaction
NV: Staff
CSVC: Facilities
STL: Convenience