NHẬN THỨC VÀ THÁI ĐỘ CỦA HỌC SINH KHI THAM GIA VÀO MÔ HÌNH HÓA TOÁN HỌC XÁC THỰC
Bạn đang xem bản rút gọn của tài liệu. Xem và tải ngay bản đầy đủ của tài liệu tại đây (2.27 MB, 54 trang )
HUE UNIVERSITY
UNIVERSITY OF EDUCATION
TA THI MINH PHUONG
COGNITION AND ATTITUDES OF STUDENTS WHEN PARTICIPATING IN
AUTHENTIC MATHEMATICAL MODELLING
SUMMARY PH.D. THESIS
Major: Mathematics Teaching Methodology
Code: 9140111
Hue, 2020
The thesis was completed at the University of Education, Hue University.
Supervisors:
1. Dr. Tran Dung
2. Dr. Nguyen Thi Tan An
Reviewer 1:
………………………………………………………………………………………………
………………………………………………………………………………………………
Reviewer 2:
………………………………………………………………………………………………
………………………………………………………………………………………………
Reviewer 3:
………………………………………………………………………………………………
………………………………………………………………………………………………
The thesis is reviewed at the Hue University Thesis Evaluation Council at……………..
............................................................................o’clock.......day......month.......year...........
See detail in the Library:
.................................................................................................................................................
................................................................................................................................................
Chapter 1. OPENING
1. The reason for choosing the topic
Mathematics is a basic science that helps develop logical thinking. However, math
learning activities do not only include reasonable inferences but are also greatly
influenced by many different psychological factors. As Middlenton (2014) has pointed
out, students' motivation to promote and maintain mathematical activities is closely
related to their desired development, interests and habits. They provide a reason for
children to choose to participate in or decline math activities. Therefore, encouraging or
stimulating the development of good learning motives, suitable for each student's
circumstances, is always one of the top tasks of modern education. Similarly, creating a
positive, open, encouraging educational environment and leading them to participate in
solving math problems, especially solving practical math problems is one of the matters
that deserve attention.
The current situation of teaching and learning math in Vietnam has been inadequate,
according to many education experts. That is, math in school does not directly serve real-
life, students do not know the purpose of math learning, or they do not see the relationship
of the math problems they study and math in everyday life. This often leads to difficulties
in solving real-life problems. One of the important reasons has been explored from
previous research by the writer is that the mathematics teaching program at all high school
levels in Vietnam is still heavily academic and lacks practical life.
Several researchers (e.g. Palm, 2008; Tran Dung & colleagues, 2016, 2019) have
presented empirical evidence with different versions of the context and level of
authenticity of the same problem, being able to influence differently on students
'participation in work. That confirmed the positive effect of authenticity on students'
problem-solving abilities. However, here the writer also wonders what leads to such
differences when they participate in math activities? What psychological factors or
circumstances motivated them, as well as what difficulties hindered them when solving
authentic problems? The authentic situations do not really according to the student's
understanding. Or have they not been adequately prepared with practical knowledge to
solve and face authentic math challenges? ….
There are many reasons why students participate in mathematical modelling in
situations of varying degrees of validation. All these problems, including mathematical
modelling and authentic mathematics, as well as the psychological and emotional aspects
related to learning in general, and mathematics in particular, have also been studied for a
long time by educators (Palm, 2008; Mart´ınez-Sierra, 2013). However, in the
mathematical educational environment in Vietnam, both mathematical modelling and
authentic mathematical modelling are still a relatively new problem. Also, for
psychological and emotional issues related to authentic activities, it is getting newer and
newer, which is hardly concerned by Vietnamese educational researchers. That is the main
content for this topic: "Cognition and attitudes of students when participating in authentic
mathematical modelling".
1.2. Research history of the problem
1.2.1. Mathematical modelling from a cognitive perspective
Pollak (1979) was the first to initiate a process of modelling in a way that could be
used in mathematics teaching. Modelling process was introduced in the late 1970s in
1
undergraduate math courses focusing on six steps (problem analysis, mathematize,
problem-solving, validation, interpretation, and iteration) and then add step seven as
reporting (Berry & Davies, 1996).
The studies of Galbraith and Stillman (2001), Doer (2007), Borroneo Ferri (2007) are
interested in the modelling process of individuals participating in mathematical modelling,
related to individual learning style. In particular, concepts related to cognition such as the
implicit model of students in each period of the modelling process are mentioned
(Voskoglou 2010).
The writer mainly focuses on two aspects, which is the modelling competence from
the perspective of cognition and emotion. The problem of researching competence for
mathematical modelling has received attention in Vietnam recently. However, studies on
modelling competence from the cognitive point of view and the combination of
psychological and emotional problems have hardly appeared in math educational studies
in Vietnam. That is the reason why this study is conducted based on a combination of
previous studies and the gaps needed for further research.
1.2.2. Study the authenticity of the tasks
Galbraith provides a comprehensive view of authenticity include four aspects:
content, process, scenario, and outcome. Focusing on the simulation aspect, Palm (2009)
developed a validation theory for tasks, aimed at creating tasks that can simulate real-life
situations. The theory holds that a similarity between verbal problems and real-world
situations involves eight features: facts, questions, information, presentation, purpose,
solution strategy, support conditions and request solutions.
Particularly for studies related to authentication tasks, an area of great interest to
many modelling researchers around the world (Vos, 2011; Niss, 1992; Palm, 2008, 2009;
...) in Vietnam is still a preliminary problem, typically, the works of Tran Dung and
colleagues (2016, 2019). This research team has shown that tasks at a more authentic level
have positively affected students' modelling competence. At the same time, studies show
that true modelling, such as project-based tasks enhance the modelling competence of
students more. Thus, in the trend of global mathematics education towards real life,
research on authentication modelling in Vietnam is indeed a necessary need.
1.2.3. Research students' attitudes toward mathematics
There are many different theories about the types of emotions, the level of
consciousness and the relationship between emotions and cognition (Hannula, 2011).
Some opinions suggest that emotions should be psychologically different (for example,
happiness, sadness, fear, anger, disgust, shame, surprise, and excitement). And the various
cognitive and social assessments are seen as outward emotion.
In short, from the studies of cognition and emotions by scholars around the world, we
find that up to now the cognitive and emotional aspects have become dominant in modern
math education. Kaiser and Stillman (2015) in the ICTMA-17 series of scientific papers
"International trends on teaching and learning, modelling mathematics" stated that this is
an important transformation in research math education.
1.3. Research question
a) How does students' modelling competence change when they participate in solving
authentic situations?
2
b) How do the attitudes of the students change before and after participating in the
mathematical modelling focused on the authentic tasks change, what explains this?
c) What is the role of the teacher and what supports the teacher when the student
participates modelling?
Chapter 2. THEORETICAL FRAMEWORK
2.1. Mathematical modelling competence
Mathematical modelling competence is defined as “the ability to identify related
questions, variables, relationships or assumptions in a given real-world situation, convert
them into mathematics, interpret and confirm the solution to a mathematical problem that
relates to a given situation” (Werner Blum, Peter L. Galbraith, Hans-Wolfgang Henn &
Morgens Niss, 2007, p.12). Competence assessment depends on the competency concept
used. For example, according to the International Student Assessment Program (PISA),
the mathematical modelling competence is not just the ability to modelling but the
readiness to solve problems with mathematical aspects taken from practical through
mathematical modelling (Kaiser 2007, p. 110).
Maaß (2006) classifies mathematical modelling competence into three distinct
domains: cognitive, affective, and metacognitive. The researchers from the perspective of
being aware (Lesh & Doerr, Rita Borromeo Ferri, ...) observed, analyzed to study the
operation process of the implicit model inside the student's mind. The researches are often
accompanied by cognitive psychology and what goes on inside an individual's mind is not
easy to observe. However, the research process can show the explanations as well as
understand the cognitive ability, the way of thinking or understanding the learners'
psychology will greatly support the research as well as the education and teaching.
For research related to cognitive aspects, as well as considering the teacher's role in the
mathematical modelling process of students, this study chooses the model process of
Reusser (1997), Kaiser, 2005 and Blum / Leiss (2005).
2.2. Modelling process from the cognitive point
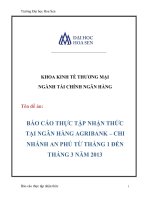
Reusser assumes that a situation model arises when an individual illustrates the
situation described in a task through an internal representation of the mind. The modelling
process include: from a real situation, it is idealized ((1) in Fig. 2.3), mean simplifying or
structuring to have got a real model. Then this real model is mathematizing (2), that is,
converted to the mathematical language to lead to a mathematical model of the initial
situation (3). The mathematical considerations are done in the mathematical model to
produce mathematical results, (4) then the results must be reinterpreted in real-world
situations (5). The completeness of the results must be checked or confirmed. In the case
of an unsatisfactory solution, the process must be repeated. (Kaiser, 2005)
3
Fig 2.3. Modelling process from the cognitive point
2.3. Levels of authenticity in mathematical modelling
2.3.1. Word problems
Word problems are pure problems but covered with words that relate to the real world
"(Niss, Blum, and Galbraith 2007, p. 11). Therefore, the process of finding a solution only
includes a simple explanation like in this example:
Nam invests VND 15 billion in a partnership of four partners. The total investment of all
partners is 240 billion VND. What is the percentage of business that Nam owns?
2.3.2. Standard application
Standard applications are the problems which the solution strategy is "closer to the
nature of the actual context given" (Niss, Blum, and Galbraith 2007, p. 12) and the
problem information for mathematical analysis is relatively simple. Such as, all students at
Thuan Hoa High School will come together to visit some historic sites in Hue. You and
other members of the organizers will plan the arrangement and booking. The school's
students have 360 students. Each bus can carry 35 children. Fill out the order form, you
will send it to Kha Tran Bus to order. (Dung Tran, Barbara J. Dougherty, 2014).
Kha Tran travelling bus - booking the ticket
First and last name:..............................................
School: ................................................ ................
Date of visit: ........................................................
Number of ordered vehicles:................................
Other requirements:..............................................
Fig 2.5. A bus version – standard application
2.3.3. True modelling
True modelling problems include the complete process: with an initial question, next
building a model, then solving, explaining, and finally validating in a mathematical
situation and in the real context.
4
For example, math pre-service teachers are asked to do the following: “Currently, on
our university campus, there are five parking spaces, which looks pretty messy. Can you
design a parking lot to solve the current problem and let it look tidy?"
2.4. Knowledge and competence of teachers in teaching modeling
Ang (2012) proposed a mathematical modelling guidance framework to guide and
facilitate teachers to familiarize themselves with the mathematical model in converting
modelling ideas into modelling lessons. This framework is based on Shulman's (1986)
pedagogical knowledge content and basic knowledge in teaching modelling.
Table 2.1. Framework for planning/Designing learning experience in a case study)
Item Explanation
1. What is the level of Level 1: Students have modelling competencies
experience? Level 2: Students apply a known model to new situations
Level 3: Students are willing to build models or adapt
known models by themselves
List all specific modelling skills and competencies. Raise
2. What are skills or the problem to be solved, if any.
competencies? Write down the math concepts, formulas, or equations to
3. Which math tool is used? use.
Prepare and provide reasonable solutions to the problem.
4. HOW to solve the List the factors or outcomes that could explain why the
problem or model? experience was considered successful, and find them
5. WHY was this experience throughout the activity.
a success?
B. ATTITUDE – AFFECTION
2.5. Affection in math education
Affection is a topic that has received much attention in mathematical education for
various reasons (McLeod, 1992). One branch of research focuses on the role of emotion in
mathematical thinking in general and in problem-solving in particular. The other branch
focuses on the role of affection in learning and the social context of the classroom.
Table 2.3. Emotional elements in math education.
Item Example
Belief
• In mathematic • Math is based on rules
• In myself • I can solve the problem
• In teaching math • Teaching is narrative
• In social context • Learning is competitive
Attitude • Dislike to prove geometry
• Enjoy solving problems
• Enjoy exploring learning
Emotion • Excited (disappointed) when dealing with
unfamiliar problems
• Aesthetic response to math
5
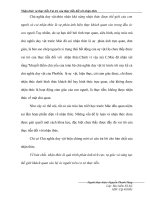
2.6. Attitude
Attitude is an emotional state that manifests through the manifestation of behavior
based on cognition. Thus, attitudes consist of three basic components: cognition,
emotions, and behavior.
Emotion
Fig 2.6. Model of attitude
2.7. Questionnaire design method
2.7.1. Likert Method
An illustrative example of the Likert method, a rating scale from 1 to 5 is used for
statements related toCaotgtintuitdioens toward mathematics (see FigB. 2eh.8a)v.ior
Fig.2.8. An example of the Likert method
2.7.2. Semantic method
For example, the following example describes the evaluation levels of pairs of semantic
concepts (see Fig. 2.9).
Fig. 2.9. An example of the Semantic method
2.7.3. Rating method
6
Fig. 2.10 An example of the Rating method
2.7.4. Interview method
There are several possible approaches: open-ended interviews, highly structured
interviews, pre-structured questionnaires interviews, interviews for confirmed
questionnaires. Interview has many advantages. They can be used to gather information
from people who cannot read or to non-native speakers. Interviews can enrich data, clarify
questions and answer ambiguous possibilities. The downside of the interview is that it
takes a lot of time, is often difficult to plan, doesn't have the final "score", and is often
difficult to conclue. However, the data obtained from this method directly provided by the
subject through expressions and words through video or audio recording should be of high
value and reliability.
Chương 3. RESEARCH METHODS
3.1 Research methods
To answer the research questions above, experimental teaching method plays a key
role in this research.
During this study, a mixed method (Ross & Onwuegbuzie, 2012) between qualitative
research and quantitative research was performed to collect data. From observations,
videos, and student reports, the researcher analyzed how students' modelling competence
changed to answer the first question. Specifically:
• Quantitative data includes surveys (Alennezi, 2008) and tests (Haines & nnk, 2001). The
surveys were conducted to collect data and information related to the student's attitude
factors before and after participating in modelling. Tests are a set of open and closed
multiple choice questions that focus on problems corresponding to the steps in the
modelling process (Haines & nnk, 2001).
• Qualitative data collected through case studies (Tran et al, 2019) are used by teachers
and some students to answer questions 1 and 3. Additional data can be Student reports
will be gathered via video on the modelsing process and interviews conducted after the
experimental process.
3.1.1. Participants in research
Participants in this study include 2 teachers and 128 grade 10 students of Hai Ba
Trung High School and Thuan Hoa High School. These students are selected according to
a convenient sample and they are ready to participate in research. Besides, these two
schools are chosen for their differences in geographic location and academic entry level.
3.1.2. Research tools
a) Tools to collect quantitative data
7
Questionnaire:
The questionnaire was designed based on the attitude scale of Alennezi (2008), which
studied 1346 students aged 14-15 in Kuwait. The questionnaire consists of 57 statements
focused mainly to measure four components: the importance of math, attitude, confidence
in learning math and confidence in math.
Closed and open multiple choice test
The test is a set of multiple-choice questions related to real-world problems consisting of
four closed-ended questions and four open-ended questions.
b) Tools to collect qualitative data
Four math modeling tasks with different levels of authentication:
Bảng 3.2. Authentic tasks
Tasks Level of authenticity Implementation time and Source
math content learned
1. Water (1) Word problem At week 8, students Doctoral thesis,
spray arch learned about quadratic Nguyễn Thị Tân An
functions (2014)
2. Pineapple (2) Standard application Week 9, students studied IMFUFA tekst
the equations (2009)
3. Rescue (2) Standard application Week 11, students learned Kaiser (2004)
aircraft the equations and system
of equations, vectors and
coordinate system
4. Building a (3) True modeling Introducing the project at Based on the actual
bridge over week 10, students work in needs of Hue city
Huong river groups for 3 weeks and
report on week 13
Video and audio recordings during the experiment
The videos saved with the recording support better sound, all data is then converted to
text and combined with paper exercises to conduct data analysis.
Besides, some special cases will be invited to interview to clarify issues that have not
been shown in video, audio and assignments data (these are also implicit models in the
cognitive aspect). At the same time, children's attitudes towards mathematics before and
after participating in mathematical modelling will be expressed through interviews.
3.1.3. Data:
The data includes individual survey, individual test, group assignment, group project
report, video and audio recording.
3.2. Data analysis
Questionaire
SPSS 20 software is used to statistic data as a basis for the analysis and interpretation
of the results.
Test
The coding tool is used based on established experts and gives reasons for their
choice of answers (Haines, Crouch & et al, 2001; Tran & et al., 2019).
Table 3.6. Rating scale
8
A B C D E
1 0 1 2 0 0
2 0 0 0 2 1
3 1 0 0 0 2
4 0 2 0 1 0
5 0 2 0 1 0
7 0 1 0 0 2
8 0 2 1 1 0
Mathematical modeling tasks
All student work is analyzed according to the steps of the modelling process to see
the cognitive changes as well as the difficulties of the groups when participating in
solving real situations. The model routes and the number of models are monitored through
both the student's participation in modelling, as well as the mathematical tools that
students choose to solve problems and the ability to connect practically. The Huong River
overpass project has been collected and synthesized similar to the previous three tasks.
However, the project work is also coded according to the rubric rating scale (Tran et al.,
2019) combined with the assessment of modelling capacity according to the process of
Kaiser (2007).
The case study data consists of five groups including data obtained from video, audio
recordings, and interviews, but the assignment data cannot be seen. Besides, some implicit
models are not shown where assignments or reports are interviewed for further
understanding. Some questions for teachers will be asked to explore program knowledge
and perspectives of the teacher on integrating modelling-related content into the
classroom. The results of interviews, observations and video analysis will be incorporated
into the analysis of situations to explain students' phenomena, perceptions and behaviours,
and emotions in the process of solving authentic tasks.
Chapter 4. RESULTS
4.1. Changing in mathematical modelling competence
4.1.1. The transformation in the number of models and the modelling process
through modelling tasks
Students' modelling processes are varied when participating in modelling tasks. In
particular, the process and model number largely increased after the first three tasks for
Groups 3, 4, 5. In contrast, the two Groups 1 and 2 had little change in both the number of
models and the process through these three tasks (see Table 4.1).
Table 4.1. Process modelling and numbering of models through three tasks and
projects
(1, 2, 3... corresponding to the steps of the modelling process in Figure 4.1)
Task 1 Task 2 Task 3 Project
Group 1 1345 (1 Model) 1233 (2) 1234 (1) 13345 (2)
Group 2 12345 (1) 12 (1) 1234 (1) 123334 (3)
Group 3 133 (2) 12345 (1) 123234 (2) 12 (1)
9
Group 4 13 (1) 1234 (1) 1232345 (2) 1234 (1)
Group 5 13 (1) 12 (1) 12323 (2) 12 (1)
The modelling process of groups through the first three tasks is represented by two
groups of trends: a) The first group of trends includes the first two groups and b) The
second group of trends includes the other three groups. However, in the project tasks of
the two groups, this trend has had the opposite change. Examples of these transformations
are analyzed in detail in the next section.
4.1.1.1. Task 1
When you arrive in Peru's capital, Lima at night, visitors can see many beautiful
images of the fountains. Pictured is a 32-meter long walkway underneath a fountain.
Currents of water are pushed up to exactly the same height and dropped in a row forming
parabolic jets of water. Surprisingly, you can go through this road without getting wet.
Thy, she wants to know the height of the fountains. She measured on the ground, the
distance between the point of water gushing and falling water point was 4 meters, in
addition, if standing 0.6 meters from the fountain and raised her hand straight, she could
touch the water at a height of 1,53 m. Please help her calculate the height of this fountain.
Fig 4.2. Task 1
From the real model, students in group 1 have directly transformed into a
mathematical model: "Parabolic", "Associated with the coordinate system" (Real model
=> math model).
Next, students work in math environments to arrive at math results:
“(P): y= ax2+bx+c ( a 0 ).Because (P) goes through A(2,0) B(-2,0) C(1,4; 1,53)
Thus, y 3 x2 3 ” => h 3 (Math model => Mathematical results)
4
From here, students arrive at the real result, concluding that the result just found is
the height is 3m (Math result => actual result). Thus, the modelling steps of this group can
be summarized as follows: (1) => (3)=>(4)=>(5)
Fig 4.3. Group 1 – Task 1
10
Group 2 solves quite similarly to Group 1 by using the math tool of solving such as
the system of equations and finding the Parabolic equation. However, after understanding
the problem, this group discusses two solutions of "Parabolic or similar triangles" (real
model => situational model). After the discussion, they agreed to come to a mathematical
model that is “determine the formula (P)”, unlike Group 1 who moved to the math model
right from the first step. The result of this group is also 3m.
On the contrary, students in groups 3, 4 and 5 find it difficult and confusing to solve
the problem. They understand the problem and find the parabola (real model => math
model 1). However, this group switched to the second mathematical model, which is to
find the height by the quantum coefficient in the triangle (math model 1 => math model
2). Students have been working in a math environment but have not yet given appropriate
math results:
“BH=HC=2. EB = 0,6m, AH is height. Áp dụng định lý Talet:
BE IE 0, 6 1, 53
BH AH 2 AH
Therefore: AH 5.1 ” (math model 2=> math result)
4.1.1.2. Task 2
Pineapple is a popular fruit of the Vietnamese. Pineapples contain many vitamins,
enzymes, and minerals that have many health benefits, so pineapples are grown for
harvest and are usually in good season. However, this fruit has a thick skin. The process
of peeling and removing these bruises is an art. Explain why people often spiral peels of
pineapples?
For this task, students in group 1 understood the problem, discussed and went to the
case model "find the shape, function of the cut" (real model => situational model). From
here, students discuss and move on to the first mathematical model "comparing
horizontally and vertically" (situational model => math model 1). However, students do
not continue to do this model but move on to the second model "cutting helix or cutting
ellipse" (math model 1 => math model 2). From this model, students come to the math
results that cut along the ellipse "golden ratio of the Fibonacci series, refer to the cut
area", students do not explain any more (math model 2 => math result).
Fig 4.7. Group 1 – Task 2
11
Here, students mentioned a model that compares horizontal rows and vertical rows
(that is, edge and diagonal of a quadrilateral). However, they do not make this model but
go to the second model which is cut along an ellipse, but in reality, the spiral is not
elliptical. This leads them to come up with more complex math tools (Fibonacy
sequences) but ineffective solving.
Students in groups 3, 4 and 5 showed a more complete modelling process. They read
and understand the problem, discuss and draw a picture of “the problems forming a
diamond or parallelogram” (real model => situational model). From here, students build
a mathematical model "comparing edge and diagonal" (situational model => math
model). Students work in a mathematical environment, using the Pythagorean theorem
(math model => math result). Students work in a mathematical environment to give the
results: Because AC = 2a and AB = a, when cut diagonally, it will be more beneficial than
cutting straight because the area to be thrown will be less” (Mathematical results => real
results).
The problem-solving process of the students of this group encountered some
confusion: the quadrilateral error with equal sides is square and the error of miscalculation
at AC. However, the transition steps show that students are becoming more familiar with
this task and the math model solving tool used is quite reasonable.
Fig 4.8. Group 3 – task 2
4.1.1.3. Task 3
“A skiing area in Northern Italy has accidents in many locations. These positions are
defined in the following coordinate system (Figure 4.9a). Frequency of accidents per
location is also provided (Figure 4.9b). Three rescue helicopters are located in this ski
area trying to help the people in the accident as soon as possible. In your opinion, what
position should these helicopters be optimal?"
Fig 4.9a. Location of the accident site
12
Fig 4.9b. Coordinates and frequency of accidents in the ski resort
Students in group 1 changed from a real model to “put in the most accidental
position” (real model => situational model). From there, give the mathematical model
"define the centre of triangle/quadrilateral, with the location where many accidents
happen" (situational model => math model)
From here, students give steps to solve the math model by observing the coordinate
table and the frequency to identify the areas with the number of accidents 30 . Then, they
zoned the three areas with the highest accident density to place the three helicopters by
identifying the centres of the quadrilateral: “Step 1: Find the coordinates where the most
accidents occurred 30 . Step 2: Circle the three areas with the highest accident density
to place the three helicopters. Step 3: The quadrilateral ABCD places the first helicopter
in the centre, the quadrilateral AEGF places the second helicopter, the triangle HFI
places the third helicopter” (Math model => Mathematical results.)
From the real model, the students in group three switch to the situational model: "put
the helicopter in the most accidental position" (real model => model situation). Next,
they move to the first mathematical model: "determine the centre of the triangle, with the
location where many accidents happen" (situation model => math model 1). However,
students discuss and return to the situational model: “the area where many accidents
happen” (From math problem 1 => situational model). From here, this group comes to
the second math model: "draw a circle, determine centre" (situational model => math
model 2). Based on the coordinate and frequency table, they identified three circle centers:
A (46, 42.5); B (88, 50); C (118, 62) (Math model 2 => Math result).
In summary, the results of the groups participating in solving the validation tasks
showed two groups with a clear trend:
• The first trend group consists of Group 1 and Group 2, these two groups have solved
the first task quickly and used suitable math tools (write Parabolic equation). But for the
next two missions, these groups found it difficult. The first group of trends has a common
feature: they are all solving and using appropriate mathematical tools for the first task; the
modelling process and the number of models have no change over the next two tasks;
Some complex math tools have been used but are not appropriate, so they have not
yielded reasonable results.
• The second trend group includes Groups 3, 4 and 5, these three groups have
difficulty in starting task and the math tools these groups use to solve the problem is not
appropriate. However, through the three tasks, these groups have an increasing number of
13
models and diverse modelling processes. The second group of trends has common
characteristics: do not use the right math tools for the first task; the modelling process and
the number of models changed over the next two tasks; Many practical factors are
mentioned by these interested groups: time-saving, aesthetics.
But in the task of a project that lasted for three weeks, the two groups of trends mentioned
above had the opposite direction. That is, Group 1 and Group 2 have much more diverse
modelling processes and numerical models compared to the other three groups. Details of
the team's modelling process for project tasks are presented in the next section.
4.1.1.4. Project task
To support traffic flow between two parts of Hue city, the government develops a new
bridge that goes across The Huong River. The bridge is located to connect between
Nguyen Hoang Street and Bui Thi Xuan Street (Phuong Duc Ward). Can you propose a
bridge model and explain your proposal with supporting documents?
a) Assessment the project through the modelling process, the number of models
Different from the first three tasks, in the project mission, two groups with two trends
as analyzed in the previous section had opposite changes. That is, groups 1 and 2 have
more diverse modelling processes and numbers of models than the other three groups (see
Table 4.4).
• First trend group
Modelling processes and the number of models for groups 1 and 2 are very diverse.
In particular, many mathematical topics are used by these groups and the math tools for
solving are rich.
Group 1:
This group changed from the situation described in the project into the mathematical
model: “Looking for the number of bridge abutments so that the cost of building is
minimum” (real situation => mathematical model 1)
Doing this, they started thinking about another mathematical model: “what is the
equation to model the bridge” (mathematical model 1=> mathematical model 2)
There are six piers in the bridge, distance between two piers is 48, 5 m, the bridge
height is 4 m.
Students put variables into mathematical model and search for a, b, c of
y ax2 bx c(a 0) (P) with the information: (P) go through the points A (-170, 0);
B(170, 0) and I (4, 0) . Although they did not show the process that looking for the result
for this mathematical model in their report but the symbols on the graph can show this
(see Fig. 3). In addition, this process was confirmed by the students during the interview:
"We put O (0, 0) at the center of the two ends, attached the Oxy system, Ox coinciding
with the straight line connecting the two ends, Oy and Ox are perpendicular. Call the
general equation (P) and looking for a, b, c by replace A (-170, 0); B (170, 0) and I(0, 4)"
They found a parabolic equation: f x 1 x2 4 .
7225
After they had found a parabol functions, the students returned to the first
mathematical model and tried to look for the answer.
They worked in the mathematical environment by add the variables
14
Each bridge meter costs a billion dong (a 0)
Each bridge abutment costs b billion dong (b 0)
The length of the bridge is l (m) (l 0)
The number of bridge abutments is n (n 0)
So, the cost after completion (not including decoration and pavement) is al bn
(billion dong)
In order to solve this problem, they used the Cauchy schwarz inequality
(mathematical model => extra-mathematical knowledge).
( al bn)2
al bn
2
Students argued that: The "=" sign occurs, or the bridge has the minimum
a
construction cost if and only if al bn or n l
b
This group continued to find n they had to calculate the length of the bridge. It
means they accepted a and b as constants, which can be found from the reality. Although
this model was not explicitly reported, the way this group drew graphs and calculated
what? reveals a hidden model in their cognition (see Figure 5) (extra-mathematical
knowledge => mathematical results)
f x 1 x2 , A (-170, 0) và B (170, 0)
7225
The length of the bridge is equal to the length of the arc AB
xB 2 170 1 2
l 1 f x dx = 1 2. x dx 340,1254485m
xA 170 7225
• Second trend group
Group 4: situational model: “Choosing the form of the bridge, this group chooses the
bridge with the bearing cable” (actual model => situational model). Students explain:
“For the people’s convenience moving in Hue city, especially from the south bank to the
north bank of the Huong River, our group decided to build a bridge over the Huong River
(Kim Long Bridge). To stabilize, my team decided to choose to build a rope bridge in a
hammock with reinforced stay Cables, this will increase the rigidity and certainty of the
bridge".
Students looking for more information from reality: This Bridge’s length is 415
10m long and 12.4m wide with two lanes for cars and motorcycles. There is also a
pedestrian walkway. Lanes of cars and motorcycles 10m wide with 2 directions. The
pedestrian lane is 1.2 m wide each (situational model => actual elements / information)
(bridge length is taken from google map)
Besides, the bridge is divided into 14 equal sections and each section has a ratio of 1 -
29.6m. They provide some more information: Bridge construction time: 3/2019 - 5/2020.
The number of workers: 100-150 workers and costs 27 billion.
15
Then, they move to the math model: "Write an equation of hammock on the bridge"
(Practical factors => Math model)
To look for the soft string equation of the bridge, this group works in a math
environment that gives the results (math model => math result): Students determine the
coordinates of vertices is I (0, 2.5) và các điểm A (-7; 5.5), B (7; 5.5) (P). Từ đây, học
b
sinh thay vào: “Ta có: 49a+7b+c = 5.5, =0 => b=0. Thay I vào: c=2.5 Suy ra a =
2a
3 ”. Phương trình mà các em tìm được là (P): y 3 x2 2, 5
49 49
In the five groups above, the first two groups are good and excellent students and the
other three groups are average and fair according to the entry-level. This also in part
affects students' outcomes and modelling competence. However, based on the above table,
it can be seen that the three groups 3, 4 and 5 have made clear progress after the first three
tasks. This partly shows that the initial level of learning is a condition to help students
solve problems better, but modelling tasks are tools that affect students' progress. On the
contrast, students in groups 1 and 2 with excellent and good academic performance are
also an advantage for them when getting used to the first three tasks. However, the
students at first were also quite confused and it took a lot of time. Until they had more
time with project assignments, they demonstrated a wide variety of models and extensive
math tools to deal with even though these were not yet learned in class (such as integrals,
the Cauchy-Schwarz inequality).
b) Project assessment by using Rubric
Besides, we used Rubric to assess more detailed criteria related to Demonstration of
mathematical understanding and application, undertaking mathematical modelling and
communication. The Rubric designed by Tran Dung and et al (2019) was used to evaluate
the project reports of the above five groups. In which: 1-good, 2-fair, 3-satisfactory, 4-
below required.
Table 4.2. Project assessment by using Rubric
Group 1 2 3 4 5
Criterion
1) Demonstration of MAa: Mathematical topics 4 4 1 1 1
Mathematical MAb: Complex procedures 4 4 1 2 2
Understanding and MAc: Mathematical representations 3 4 1 3 2
Application MAd: Justification 2 2 2 2 1
2) Undertaking MMa: Posing problems 4 4 1 2 2
mathematical modelling MMb: Making assumptions 3 3 1 2 1
MMc: Interpreting results 2 4 1 2 1
MMd: Critiquing models 2 2 2 2 2
MMe: Resources 1 1 1 2 1
3) Communication COa: Mathematical convention 4 4 2 4 2
COb: Writing 4 4 4 4 4
COc: Visual representation 4 4 2 4 4
COd: Reference 4 1 1 4 1
The results of the Rubric assessment can be seen that most of the groups achieved
higher levels of communication criteria and were the lowest in the source criteria used
16
except for Group 4 with a few sources indicated in their report. Math topics appear richer
in group 1 and 2 reports, which can also be seen in the modelling process table.
4.1.2. Competence shown in input and output test results
The results show that the average score per question in the output is higher than the
input, for example, question 1 has an average score of 0.98 and on the output is 1.68.
Specifically, score each question at the input and output as follows:
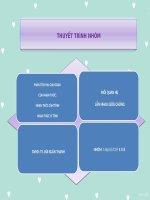
The following chart can show a clearer change in the number of students choosing the
answer with the maximum score (2 points) between input and output.
Chart 4.1. Compare input and output test result
4.2. Changes in emotions, attitudes
4.2.1. Relate to the importance of Mathematic
For questions related to the importance of Mathematics, the number of students
selected for the options is listed in the following table, conventions 0-No, 1-Yes and 2-
Both (including both choose Yes and No)
200 Đầu vào
Đầu ra
100
0
012
Chart 4.4. Compare the importance of math between input and output
The difference between input and output is not too great in terms of understanding the
importance and usefulness of Mathematics. The data show that from the beginning,
students fully realize that Mathematics is an important subject. However, students show
dislike attitudes at input and there are clear changes in output survey.
4.2.2. Attitude towards Mathematics
Attitude to mathematics according to statistics 128 students, convention 0-Dislike, 1-
Like and 2-Both
17
100
50 đầu vào
đầu ra
0
0 1 2
Chart 4.5. Attitude towards Math
4.3. Relationship between attitude and mathematical modelling competence
Students' emotions change in a positive direction through tasks. Starting with the
second task, students showed an interest in modelling and expressing their views with
their peers. For example, at the 15th minute, a student in group 1 said, "I feel it
interesting", this statement was extracted from the group's video and audio files. For the
project, the students of this group commented: “I see that math has many applications in
life. It was only through attaching the bridge to a parabola and the coordinate system that
the design became easy. My feeling is that I'm very interested in this model and form of
math learning”. Many students changed their opinion after four modelling tasks,
specifically, 96 (75%) students showing a 34.38% increase in their interest in
mathematics, they explained the reasons for their change of opinion. Mainly as follows:
"At first, I did not like it because of difficulty, trouble and did not apply usefully to the
career later".
Groups of students who showed interest in modelling tasks became more engaged
and efficient in the implementation of modelling. This is reflected in the more diverse
number of models and model routes used by students. Groups use many mathematical
tools: inequality, integral and Cauchy - Schwarz inequality, the mathematical knowledge
are not easy for 10th graders. At the same time, students also relate to many factors.
Reality such as the density of steels, materials, costs that may arise, aesthetics and
traditions, so on.
4.4. The teacher's role in the mathematical modelling process
4.4.1. Teachers prepare and plan possible situations
a) The first component - Experience level:
The first level: Students grasp the mathematical modelling competencies after
experiencing the first task.
Second level: Students can apply a model that already known to new situations
through modelling participation for the second and third task.
The third level: Students are willing to build a model or self-adjust the known model
for the fourth task - project-oriented tasks.
b) The second component - what are competencies to use?
The modelling competence listed and the issues to be addressed are outlined in the
following table:
Content Table 4.13. Modelling competence and issues that need to solve
Task 1
Modelling competence
• Simplifying: transition from real situation to situation model
• Mathematizing: "write equations (P)"
• Working mathematically: algebraic operations, solving systems of equations
18