Tóm Tắt Luấn Án Tiếng Anh.pdf
Bạn đang xem bản rút gọn của tài liệu. Xem và tải ngay bản đầy đủ của tài liệu tại đây (2.39 MB, 27 trang )
MINISTRY OF EDUCATION
AND TRAINING
VIETNAM ACADEMY OF
SCIENCE AND TECHNOLOGY
GRADUATE UNIVERSITY OF SCIENCE AND TECHNOLOGY
ĐỖ THỊ THỦY
DO THI THUY
SYNTHESIS OF GRAPHENE/POLYMER COMPOSITE FILM
UTILIZING 3D PRINTING TECHNIQUE AND ORIENTED
TO APPLICATION AS AN ELECTRODE MATERIAL
SUMMARY OF DISSERTATION ON CHEMISTRY
Code: 9 44 01 19
Ha Noi, 2023
The dissertation is completed at: Graduate University of Science and
Technology, Vietnam Academy of Science and Technology
Supervisor: Associate Prof. Dr. Nguyen Tuan Dung
Prof. Dr. Tran Dai LamTS. Trần Đại Lâm
Referee 1:
Referee 2:
Referee 3:
The dissertation will be examined by Examination Board of Graduate
University of Science and Technology, Vietnam Academy of Science and
Technology at 9h00, 04 Dec. 2023
The dissertation can be found at:
- Graduate University of Science and Technology Library.
- National Library of Vietnam.
1
INTRODUCTION
1. The urgency of the thesis
Graphene, with its outstanding features, great electron dynamics, electrical
conductivity, good thermal conductance, and large surface area... has attracted
strong research interest in many fields, especially applications as an electrode
material for energy storage components and electrochemical sensors [2]. The
capacity value of the graphene electrode is much higher than that of other carbon
materials, but theoretically, under ideal conditions with single-layer graphene and
the entire surface used effectively, the maximum capacity is only 550 F/g. To
increase the performance of the super condensers as well as improve the
mechanical properties of the graphene membrane, the direction of research using
graphene combination with polymer materials is thought to be a promising
solution. On the other hand, polymer with its nature of organic material, soft, and
flexible, will improve the machining capacity of graphene. In the field of
electrochemical sensor manufacturing, electrodes based on composite graphene
and polymer are also given special attention because they can combine the superior
properties of both components. Compared to the use of pure graphene sensors,
graphene/polymer composite sensors have prominent advantages such as
flexibility and high selectivity, lightweight, and reasonable price.
Composite graphene/polymer is usually synthesized from solution and
membrane by centrifugal rotation, drip coating, vapor condensation coincidence,
or electrochemical flooding. These methods are often difficult because of the poor
distribution of graphene in common solvents. In recent years, 3D printing
technology has emerged and developed strongly, with applications in many
different fields, especially in the manufacture of electronic components and
electrochemical sensor manufacturing. 3D printing has made electrode design and
manufacture much simpler, more accurate, and faster than traditional methods.
From the above analysis, the researchers chose the subject: "Study of
composite graphene/polymer film manufacturing using 3D printing technology
oriented to application as an electrode material".
2. Objectives of the thesis
Apply 3D printing techniques to make composite graphene with some polymer
applications as electrode material in super condensers and electrochemical sensors.
3. Content of the thesis
- Fabrication of graphene composite 3D printing with polyvinyl alcohol
using GO-based inks with ascorbic acid chemical detergent.
- Fabrication of graphene composite 3D printing with polyacrylic acid
using GO-based inks with UV agents.
- Fabrication of composite 3D printing of graphene with electrically
conductive polymers (polyaniline, poly(1,8-diaminonaphtalen)) using GObased inks with electrochemical method.
2
- Evaluate the application of composite graphene/polymer 3D printing
materials as electrodes in supercapacitors and electrochemical sensors.
4. Layout of the thesis
The thesis comprises 120 pages, with 55 figures,14 tables, and a
bibliography of 120 references. The structure of the thesis follows a typical
layout, which includes an introduction, three content chapters, and a
conclusion. Notably, the novelty of the research has resulted in the
publication of eight papers, with two papers listed in SCIE journals and two
in Scopus-indexed journals, as well as two papers listed in specialty national
journals.
CHAPTER 1. OVERVIEW
Chapter 1 is presented in 32 pages including 18 pictures introducing
graphene, graphene/polymer composite, and the research situation of
applying 3D printing technique in manufacturing graphene/polymer
composite electrodes.
3D printing technology or gradual manufacturing technology is the
process of sampling from a digital model that is carried out automatically
through a 3D printer. The object was created exactly according to the design
pattern. Graphene with high electron dynamics, electrical conductivity, good
thermal conduction, large private surface area... It's fascinating that scientists
are working on electrodes with a variety of applications, including super
condensers and electrochemical sensors. Polymer is a soft, flexible material
with good adhesion. The combination of graphene and polymer gives the
graphene/polymer composite many unique properties. The field of
composite graphene/polymer electrodes is attractive to scientists.
CHAPTER 2. EXPERIMENTAL
Chapter 2 is presented in 12 pages, 4 figures which include:
2.1. Materials
2.2. Experimental method
2.2.1. Synthesis of graphene oxide
2.2.2. Synthesis of composite reduction graphene oxide (rGO) with
polyvinyl alcohol (PVA) using reduction ascorbic acid
2.2.3. Synthesis of rGO composite 3D printing film with polyacrylic acid
using UV irradiation
2.2.4. Synthesis of rGO composite 3D printing film with polyaniline
modified nano MnO2 using as supercapacitor
2.2.5. Synthesis of rGO composite 3D printing film with poly(1,8diaminonaphthalene) modified nano Ag using as sensor
3
CHAPTER 3. RESULTS AND DISCUSSION
Chapter 3 is presented in 55 pages which includes:
3.1. Study on the manufacture of graphene oxide ink
3.1.1. Characteristics of GO
GO determines characteristic properties using the following techniques:
transform infrared spectrum (FT-IR), Raman spectrum, X-ray diffraction
spectrum (XRD), and Field Emission Scanning Electron Microscopy (FESEM).
Fig. 3.1. FT-IR of graphite (a)
and GO (b)
Fig. 3.2. Raman spectrum of graphite
(a) và GO (b)
Fig.3.4. FE-SEM images of
Fig.3.3. XRD patterns of
graphite (A) và GO (B)
graphite (a) và GO (b)
The results show that GO is synthesized successfully from graphite by
chemical methods. GO is thin, with a lot of space in the middle. The
oxidation process separated the graphene layers in the graphite structure.
3.1.2. Properties of GO Ink
3.1.2.1. Viscosity of GO ink
The concentration of GO ink in the thesis was chosen at 8 mg/mL
corresponding to a dynamic viscosity of 30.6 mPa.s.
4
Fig. 3.5. Dynamic viscosity of GO ink at 25oC
3.1.2.2. Zeta potential of GO ink
Hình 3.6. Zeta potential of GO ink Hình 3.7. Zeta potential of GO ink
after two months
GO
The zeta potential of the GO measurement was -65 mV; after two
months, this value of zeta reached -63 mV, demonstrating the stability of the
ink.
3.2. Synthesis of a 3D composite graphene oxide compound with a nonconductive polymer
3.2.1. Synthesis of rGO/PVA composite film using ascorbic acid
3.2.1.1. Effect of ascorbic acid
Composite film made of GO, ascorbic acid, and PVA (PVA makes up
10% of the wt. compared to GO) and different amounts of ascorbic acid (5,
10, and 15% wt.).
The obtained CV curve has a sharp oxidation-reduction peak with a much
higher current intensity when ascorbic acid is present. The ascorbic acid level,
specially selected, is 10% by weight (fig.3.8)
5
Fig. 3.8. The results of CV measurement in K3[Fe(CN)6]/K4[Fe(CN)6] solution
of GO (a) membrane and GO/PVA composite with different content of
ascorbic acid: 5% (b), 10% (c), 15% wt. (d)
3.2.1.2. PVA content
Zeta potential results
Fig. 3.9. The zeta potential results Fig. 3.10. The relationship between
of GO-ascorbic acid-PVA ink with zeta potential and PVA content
the content of PVA: 0% (a); 5%
(b); 10% (c); 15% (d), 20% wt (e)
In the case of PVA, which occupies 5% wt., the value of the zeta
potential is 69 mV. PVA content is 15% wt., and the zeta value reaches 79.1
mV. This value ensures good electrostatic propulsion between the adhesive
particles and high stability of the ink. Continuing to increase the PVA, the
value of the zeta potential tends to decrease, and the stability of the ink also
decreases.
The electrochemical
The results show that the current intensity increases with the PVA
content increasing from 5 to 15% wt., but is slightly reduced in the case of
6
20% PVA wt. However, in the case of higher PVA levels (20% wt.), the
observed current intensity is lower than the other samples; this is due to the
low content of rGO in the printed film. PVA content of 15% wt. is selected
for subsequent experiments (fig.3.11)
Fig. 3.11. The result of CV in K3[Fe(CN)6]/K4[Fe(CN)6] 5 mM solution of
rGO/PVA with content PVA of 5% (a), 10% (b), 15% (c), 20% wt. (d)
3.2.1.3. Characterization of composite GO/ascorbic acid/PVA
Morphology
Fig 3.13. FT-IR spectra of GO
Fig 3.12. Raman spectra of GO
(a) and rGO/PVA (b)
(a) and rGO/PVA (b)
Raman spectrum results show the characteristic peaks of graphene:
peak D at 1350 cm-1 and peak G at 1588 cm-1. The increased ID/IG ratio (from
0.86 to 1.02) indicates that GO has been reduced into rGO.
On the FT-IR spectrum of the composite rGO/PVA, the absorption peak
at 1384 cm-1 corresponds to C-O-H bond, the pic at 1326 cm-1 corresponds
to CH/CH2 bonds, the peak at 1269 and 1053, the 840 cm-1, corresponds to
C- O-C bonds and C=O, C-C. The absorption peaks at 1733 cm-1 and 1637
cm-1 correspond to the stretch vibrance C=O and C=C bonds of both PVA
and rGO.
7
Electrochemical
Fig. 3.16. A straight line
Fig. 3.15. The CV result of
between Ipa, Ipc, and the square
rGO/PVA in K3[Fe(CN)6]/
root of the scan rate
K4[Fe(CN)6] 5 mM solution
The rGO/PVA electrode has an effective area of 0.32 cm2, which is
equivalent to one-third of its geometric area. The utilization of 10% weight
ascorbic acid in the process of reduction GO is not highly efficient.
3.2.1.4. Capacity performance of composite GO/ascorbic acid/PVA film
Fig 3.16. The CV result of composite rGO/PVA film in H2SO4
1 M solution, scan rate from 10 to 150 mV/s
Table 3.3. The specific capacity performance of composite rGO/PVA
10
20
50
100
150
Scan rate (mV/s)
92
88
75
70
65
Specific capacity (F/g)
The CV of the GO/ascorbic acid/PVA film at low scanning speed has a
deformed rectangular shape, characteristic of a double condenser with a
relatively high voltage resistance.
3.2.2. Synthesis composite rGO/PAA using UV irradiation
3.2.2.1. Zeta potential of GO/AA ink
8
Fig. 3.18. Zeta potential of GO/AA Fig 3.19. The dependence of zeta
with AA content: 5% (a), 10% (b), potential on AA content
15% (c), 20% wt.(d)
The zeta potential analysis indicates that AA comprises 5 to 20% by
weight, confirming the stability of the ink and the GO particles do not tend
to merge.
3.2.2.2. Effect of UV irradiation time
The GO/AA composite film is manufactured using 3D printing and then
exposed to UV radiation in varying intervals of 1.2, 3.6, and 6 seconds.
Fig. 3.20. The CV result of GO/AA film with time irradiation of UV:
0 seconds (a); 1.2 seconds (b); 3.6 seconds (c) and 6 seconds (d)
Fig 3.21. Image of GO/AA composite film after UV exposure 3.6 seconds
(a), 6 seconds (b) and GO film after 3,6 seconds (c)
9
Table 3.4. The value of Ipa, Ipc, ∆Ep with UV irradiation from 0÷6 seconds
Time
(seconds)
0
1.2
3.6
6
Ipa
(mA)
0.65
0.72
1.89
1.39
Ipc
(mA)
-0.78
-0.88
-2.01
-1.50
∆Ep
(V)
0.31
0.13
0.12
0.12
The rGO/PAA composite has the best electrochemical activity with a
radiation projection time of 3.6 seconds. AA improves the adhesion of rGO.
Effect of AA content
Fig 3.22. The results of CV in K3[Fe(CN)6]/K4[Fe(CN)6] 5 mM solution
rGO/PAA with AA content: 0% (a), 5% (b), 10% (c), 15% (d)
With the presence of AA accounting for 10% wt., the obtained CV
curve shows a sharp oxidation-reduction peak and current intensity increases
strongly.
3.2.3. Characteristics and properties of rGO/PAA composite film
Characterization
Fig 3.23. Raman spectra of GO/AA Fig 3.24. IR spectra of: GO (a), AA
(b), GO/AA (c), rGO/PAA (d)
(a) and rGO/PAA (b)
The Raman spectra indicated that the (ID/IG) ratio of rGO/PAA was
10
1.18, which was higher than the ratio of GO/AA, which was 0.86. This
suggests that the reduction of GO had occurred.
The FT-IR spectra of the composite rGO/PAA show a shift of the peak at
1614 cm-1, which is characteristic of the C=C bond in the monomer, to 1616 cm1
. Additionally, the strength of the peak has significantly decreased. The
presence of a peak at 1188 cm-1 was related to the C-C stretching vibrations. This
peak changed to 1169 cm-1 and exhibited a significant rise in intensity, indicating
the taking place of the PAA polymerization process.
Table 3.6. Components of GO/ AA và rGO/PAA
Sample
Element
% Atomic
% Weight
C
54.23
58.14
GO/AA
O
45.77
41.86
C
65.25
69.83
rGO/PAA
O
34.75
30.17
The results demonstrated that UV irradiation effectively decreased the
%O mass ratio on the surface of the GO/AA film from 41.86% to 30.1%,
showing evidence of the successful reduction process of GO.
Electrochemical
Fig 3.26. The CV results of
rGO/PAA composite film
Fig 3.27. A straight line between Ipa, Ipc,
and a square root of the scan rate
The effective area of the rGO/PAA composite electrode is 1.30 cm2,
which is higher than 1.3 times the geometric area, demonstrating that UV
radiation has an effective reduction.
3.2.4. Capacitive performance of rGO/PAA composite film
The capacitive performance of rGO/PVA was evaluated by the cycle
voltammetry (CV) method in 1 M H2SO4 solutions, with a voltage range of
-0.4 ÷ +1.0 V, a scanning speed of 10 ÷ 150 mV/s and galvanostatic
charge/discharge (GCD) techniques with a current density of 1 ÷ 5 A/g.
11
Fig 3.28. CV curves of rGO/PAA in Fig 3.29. GCD curves of
rGO/PAA in 1 M H2SO4 solution
1 M H2SO4 solution
Table 3.7. The specific capacitance (Cs) of rGO/PAA depends on a scan rate
5
10
20
50
100
150
Scan rate (mV/s)
320
205
192
189
175
150
Cs (F/g)
The specific capacitance decrease with increasing scanning rate can be
explained by the limitation of the diffusion of the ions in the electrolyte
solution to the pore of the electrode material. When the scanning rate is low,
the ions in the electrolyte diffuse across into most of the holes, and the
exchange of electrons between the electrolyte and the electrodes takes place
at many sites. As the scan rate increases, the process slows down, leading to
a reduction in the sample capacity.
Table 3.8. The specific capacitance of rGO/PAA at different current densities
Current density (A/g)
1
2
3
4
5
Specific capacitance (F/g)
321
285
260
196
175
The GCD curves of the rGO/PAA composite are typical of both doublelayer supercapacitors and pseudocapacitors. The linear line indicates doublelayer supercapacitors, while the non-linear line represents pseudocapacitors.
The cyclic stability was investigated at a current density of 5 A/g for 5000
cycles. The results show a capacitance retention of 82%.
Fig.3.30. Decrease of Cs of rGO/PAA composite at current density of 5 A/g
12
3.3. Synthesis of composite graphene printing film with electrically
conductive polymer
3.3.1. Synthesis rGO/PANi composite film modified MnO2 nano
3.3.1.1. Property of in GO/ANi ink
Fig 3.31. Zeta potential results of GO:ANi =1:0 (a), 2:1 (b), 1:1 (c)
For the GO: ANi ratio of 1:1, the absolute zeta value measured is 86.1
mV, indicating effective electrostatic interaction between the adhesive
particles. Because print ink has high stability, ANi has a role to play in
increasing stability for print ink.
3.3.1.2. Synthesis rGO/PANi composite film decorated MnO2 nano
Fig 3.33. CV curves of GO/ANi: A) without reduction GO, B) reduction GO.
The results indicated that applying a voltage of -0.8 V resulted in the
reduction of GO, leading to the formation of more electrically conductive
rGO. Additionally, the electrochemical polymeration of PANi was shown to
be beneficial.
Time of reduction GO
For a reduction period of 40 seconds, there is a slight rise in the current
intensity value compared to 30 seconds. Therefore, a condition of 30 seconds
13
is chosen for further investigation (Fig 3.34)
Fig 3.34. CV result of rGO/PANi in 1 M H2SO4 solution with reduction of
GO: 10 (a), 20 (b), 30 (c), 40 seconds (d)
The ratio of GO:ANi
.
Fig 3.35. CV result in 1 M H2SO4 solution, scan rate 50 mV/s of composite
rGO/PANi with ratio of GO:ANi is 2:1 (a), 1:1 (b), 1:2 (c)
The CV study results clearly showed the influence of PANi in the
composite material. As the ANi ratio grew, the strength of the oxidation
current also increased. Consequently, a GO:ANi ratio of 50% was chosen.
Time of electrodeposition MnO2
In this work, the printed rGO/PANi film was doped with MnO2
nanoparticles by electrodeposition in an aqueous solution containing 50 mM
MnSO4, 0.2 M H2SO4, and 0.5 M KCl as electrolytes. A potential of +0.6 V
was applied to the rGO/PANi working electrode within 200 s, and Mn2+ ions
were oxidized to form MnO2 and deposited on the rGO/PANi surface. These
electrochemical conditions were selected so that PANi can exhibit good
electric conduction and the obtained MnO2 nanoparticles could have better
capacitive properties (Fig. 3.36).
14
Fig 3.36. CV result of rGO/PANi (a) and rGO/PANi/MnO2 with different
time applied of 100 (b); 200 (c) và 300 second (d)
3.3.1.3 Characterization properties of rGO/PANi/MnO2 composite film
Raman spectra
Fig 3.37. Raman spectra of GO/ANi (a) and rGO/PANi/MnO2 (b) composite
As can be seen from Fig. 3.37, the typical peaks of graphene, peak D is
at 1344 cm-1, and peak G is at 1588 cm-1. The relative strength ratio of peak
D and peak G (ID/IG) of rGO/PANi/MnO2 is 1.20, indicating that GO has
been reduced into rGO.
FT-IR spectra
FT-IR spectrum of rGO/PANi/MnO2 film represents the characteristic
absorption bands of PANi: the peak at 1609 cm-1 is now shifted to 1626 cm-1,
corresponding to the quinoid structure of PANi (N=Q=N stretch), the novel
peak at 3357 cm-1 is associated with N-H stretching vibration. It is appeared
also strong bands at 1164 cm-1 and 873 cm-1 due to the C-H bending in the plan
and out of the plan, respectively. Aniline has been well electropolymerized to
form PANi (Fig 3.38)
15
Fig 3.38. FT-IR spectra of GO (a), GO/ANi (b), rGO/PANi/MnO2 (c)
EDX spectra
Fig 3.39. EDX spectra of rGO/PANi (A), rGO/PANi/MnO2 (B)
Table 3.9. Element composition of rGO/PANi and rGO/PANi/MnO2
Sample
Element
% Atomic
% Weight
C
79.45
85.54
rGO/PANi
O
20.55
14.36
C
73.01
79.78
O
23.18
19.02
rGO/PANi/MnO2
Mn
2.09
0.70
S
1.72
0.50
The results presented in Table 3.9 indicate that rGO/PANi composite
film, mostly composed of 79.45% C and 20.55% O, does not exhibit the
presence of N, likely due to the low nitrogen content. The composite film
rGO/PANi/MnO2 consists of C (73.11%), O (23.18%), and a small amount
of sulfur impurities (1.72%) originating from the composite film synthesis in
16
an H2SO4 solution. The existence of Mn (2.09%) is confirmed by the EDX
spectrum (Figure 3.40), which exhibits extinction peaks at 5.9 eV and 6.5
keV. Therefore, the deposition of MnO2 crystals onto the surface of the
rGO/PANi film was successful.
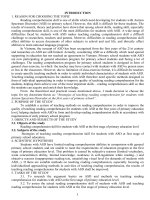
XPS spectra
Fig 3.41. XPS spectra of C 1s(A), N 1s (B), O 1s (C) và Mn 2p (D)
To investigate the chemical composition and chemical states of various
elements in the composites, XPS analysis was performed. The spectrum in
Fig. 3.41 reveals the existence of C, N, O, and Mn in the composite (Figure
3.41A). The XPS N1s spectrum is divided into three peaks (Figure 3.41B):
the most significant peak occurs at 399.5 eV and corresponds to the −NH−
bond (benzenoid amine), the peak with a lower intensity at 398.9 eV
represents the =NH− bond (quinoid imine), and a peak is observed at a higher
binding energy of 401.7 eV, indicating the presence of the −NH+− bond,
which suggests that some N atoms have been protonated to N+. This
demonstrates the successful electrochemical polymerization of PANi from
ANi. The XPS of the O 1s (Figure 3.41C) shows two distinct peaks at 531.4
and 532.8 eV, indicating the presence of Mn−O−H and H−O−H bonds.
Figure 3.41D displays the XPS Mn 2p spectrum, which has two peaks at
energy levels of 653.5 and 641.8 eV, corresponding to the 2p1/2 and 2p3/2
states, respectively. The spin energy separation of 11.7 eV confirms the
presence of Mn+4 (MnO2) in the composites.
17
3.3.1.4. Capacity performance of rGO/PANi/MnO2 study
Fig 3.42. CV results of rGO/PANi/MnO2 with the different scan rate
Table 3.10. Specific capacitance (Cs) of rGO/PANi/MnO2 with scan rate
from 5÷200 mV/s
Scan rate
5
10
20
50
100
150
200
(mV/s)
Cs (F/g)
680
600
550
490
420
380
325
The composite electrode rGO/PANi/MnO 2 exhibits a capacitance of
680 F/g when the scanning speed is 5 mV/s, and a capacitance of 385 F/g
when the scanning speed is increased to 200 mV/s. As the scanning speed
increases, the capacity declines due to the decreased diffusion of the H +
ion.
The capacity property of rGO/PANi/MnO2 electrode and rGO/PANi
electrode was also studied by the GCD method with a current density of 1÷10
A/g.
Fig 3.43. The charging and discharging curves of GO/PANi (A) and
rGO/PANi/MnO2 (B) composite in different current density
18
Table 3.11. The specific capacitance of rGO/PANi and rGO/PANi//MnO2
composites at a current density of 1÷ 10 A/g
Current density (A/g)
1
2
3
5
10
Cs (F/g) rGO/PANi
450
390
320
295
270
Cs(F/g) rGO/PANi/MnO2
740
680
600
495
420
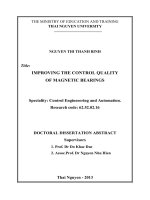
The strength of the rGO/PANi/MnO2 electrodes is investigated through a
specific capacity decrease in charge-discharge cycles at a 15 A/g current density,
as shown in Fig 3.44.
Fig 3.44. Cyclic stability of the rGO/PANi/MnO2 (a) and rGO/PANi (b)
composite at a current density of 15 A/g
After 5000 charge-discharge cycles, the rGO/PANi/MnO2 composite
electrode still maintains 97% Cs, while the rGO/PANi electrode only retains
85% Cs.
3.3.2. Fabrication of graphene/P(1,8-DAN) modified AgNPS
3.3.2.1. Fabrication of rGO/P(1,8-DAN)/Ag NPS composite
In this thesis, GO and (1,8-DAN) inks are used to create a layer-bylayer GO/(1,8-DAN) composite film on a 3D printing. The GO/(1,8-DAN)
electrodes were treated electrochemically in the droplet of a solution
containing 1 M HClO4 and 0.1 M LiClO4 to reduce GO by chronoamperometry method at − 0.8 V (vs. SCE) in 30 s). Next, polymerization of 1,8-DAN
is carried out by cyclic voltammetry technique within the potential range
from -0.15 V to +0.95 V (vs. SCE) with a scan rate of 50 mV/s for 10 cycles.
CV results show that P(1,8-DAN) was polymerization successful.