Hrm410 chapter 8888888888888
Bạn đang xem bản rút gọn của tài liệu. Xem và tải ngay bản đầy đủ của tài liệu tại đây (3.54 MB, 34 trang )
15/03/2021
COPYRIG HT © 2015 PEARSON EDU CATION , IN C.
1-1
Chapter8– Measurement
COPYRIG HT © 2015 PEARSON EDU CATION , IN C.
8-2
1
15/03/2021
LearningObjectives
Afterstudyingthischapter,you shouldbeableto:
ãDescribewhymeasurementandassessmentareimportantto
staffing
ãDescribepatternsindata
ãUnderstandcorrelationandregressionandexplainhoweachis
used
ãDefinebothpracticalandstatisticalsignificance,andexplainwhy
theyareimportant
ãDefinereliabilityandvalidityand explainhowtheyaffectthe
evaluationofameasure
ãExplainwhystandardizationandobjectivity areimportantin
measurement
COPYRIG HT â 2015 PEARSON EDU CATION , IN C.
8-3
WhyIsProper
MeasurementImportant?
Effectivemeasurementanddataanalyticscanresultina
competitiveedge
Improperlyassessing andmeasuringcandidate
characteristicscanleadto:
§ Systematicallyhiringthewrongpeople
§ Offendingandlosinggoodcandidates
§ Exposingyour companytolegalaction
Therearemanylegalissues involvedwithcandidate
assessment andmeasurement
COPYRIG HT © 2015 PEARSON EDU CATION , IN C.
8-4
2
15/03/2021
WhatIsMeasurement?
Measurement istheprocessofassigningnumbersaccordingtosomerule
orconventiontoaspectsofpeople,jobs,jobsuccess,oraspectsofthe
staffingsystem
Themeasures enableimprovementofthestaffingsystembyidentifying
patternsusefulforunderstandingandpredictingrelevantprocessesand
outcomes
Themeasures relevanttostaffingarethosethatassess:
§ Thecharacteristics ofthejob,which enablesthecreationofjobrequirements
andjobrewardsmatrices
§ Aspectsofthestaffingsystem suchasthenumber ofdaysajobpostingisrun,
whereitisrun, andtherecruiting message
Đ Thecharacteristics ofjobcandidates suchasabilityorpersonality
Staffingoutcomes,suchasperformance orturnover
COPYRIG HT â 2015 PEARSON EDU CATION , IN C.
8-5
WhatIsData?
Thenumericaloutcomesofmeasurementaredata
Thereare2typesofdata:
§
§
Predictive data isinformation aboutmeasuresusedtomake
projections aboutoutcomes.
Criterion data isinformation aboutimportant outcomes ofthe
staffingprocess.
o
o
Traditionally, thisdataincludesmeasurementofemployeejobsuccess,
whichistheorganization’suniquedefinitionofsuccessandperformance
inthejobandinthefirm.
Criteriondatashouldalsoincludealloutcomedatathatisrelevanttothe
evaluationoftheeffectivenessofthestaffingsystemagainstitsgoals.
Thismayincludemeasuresofjobsuccess,time-to-hire,promotionrates,
andtenurerates aswellasjobandcompanyengagement, fitwith
companyvalues,andwillingnesstohelpotheremployees.
COPYRIG HT © 2015 PEARSON EDU CATION , IN C.
8-6
3
15/03/2021
TypesofMeasurements
ĐNominal:numbers areassignedtodiscretelabels
orcategories(e.g.,race,gender,collegemajor)
ĐOrdinal:attributesarerankedinascendingor
descending order(e.g.,rankingfrombesttoworst
performance)
ĐInterval:zeropointisarbitrarybutdistance
betweenscoreshasmeaning(e.g.,intelligenceor
interviewscores)
ĐRatio:distancebetweenscoreshasmeaningand
thereisatruezeropoint(e.g.,salary,typingspeed)
COPYRIG HT â 2015 PEARSON EDU CATION , IN C.
8-7
DescribingData
Scoring:Theprocessofassigningnumericalvalues
duringmeasurement
Rawscores:theunadjusted scoresonameasure
§ Criterion-referencedmeasures:measuresinwhichthescores
havemeaninginandofthemselves
§ Norm-referencedmeasures:measuresinwhichthescoreshave
meaningonly incomparisontothescoresofother respondents
Normalcurve:asymmetrical,bell-shaped curve
representingthedistribution ofacharacteristic
COPYRIG HT © 2015 PEARSON EDU CATION , IN C.
8-8
/>
4
15/03/2021
TheNormalCurve
8-9
COPYRIG HT © 2015 PEARSON EDU CATION , IN C.
DescribingtheNormalCurve
Percentilescore:arawscorethathasbeenconverted intoan
expressionofthepercentageofpeoplewhosescorefallsator
belowthatscore
Centraltendency:describesthemidpointorcenterofdata
§ Mean:theaverage ofthescores
§ Median:themiddlescore,orthepointbelowwhich50percentofthescoresfall
§ Mode:themostcommonlyobservedscore(bimodal=twomodes)
Variability:describesthespreadofthedataaroundthemidpoint
§ Range:thedifferencebetween the highest&lowestobservedscore
§ Outlier: scoremuchhigherorlowerthanmostofthescoresinadistribution
Đ Variance:amathematical measure ofspreadbasedonsquareddeviationsofscores
fromthemean
Đ Standarddeviation:positivesquarerootofthevariance;conceptuallysimilartothe
average distancefromthemeanofasetofscores
COPYRIG HT â 2015 PEARSON EDU CATION , IN C.
8-10
5
15/03/2021
StandardScores
Standardscores:Convertedrawscoresthat
indicatewhereaperson’s scoreliesincomparison
toareferentgroup.
§ Acommonstandardscoreisthez score.
§ Az scoreindicates howmanyunitsofstandarddeviationsthe
individual’s scoreisaboveorbelowthemeanofthereferentgroup
Az scoreisnegativewhenthetargetindividual’s
rawscoreisbelowthereferentgroup’s mean,and
positive whenthetargetindividual’s rawscoreis
abovethereferentgroup’s mean
COPYRIG HT © 2015 PEARSON EDU CATION , IN C.
8-11
ConvertingRawScores
toStandardScores
Mean
StdDev
18.25
3.00
Mean 78.25
StdDev 7.46
zscore =(Individual’srawscore– Referent groupmean)/Referentgroup
standarddeviation)
Meaningfullycombiningtherawscoreswouldbedifficult. Combining thez
scoresiseasyandresults inasinglenumber reflecting howeachcandidatedid
onbothoftheassessmentsrelativetotheother candidates.
COPYRIG HT © 2015 PEARSON EDU CATION , IN C.
8-12
6
15/03/2021
Shiftingthe
NormalApplicantTalentCurve
ĐWhenmakingselectiondecisions,itisoftenassumed
thatintheapplicantpool,thedistributionofapplicant
fitwiththejobreflectsthenormalcurve.Alargeburden
isthenplacedontheselection systemtoaccurately
identifywhichcandidatesareinthefarrighttailofthe
normalcurve.
ĐHowever,manyofthemostdesirablepeopleforthe
positionarelikelytobeactivelyandhappilyemployed
elsewhereandaresemi-passivejobseekersatbest.In
thiscase, thedistributionofapplicantfitwiththejob
mightresembletheAdistributionshownonthenext
slide.
8-13
COPYRIG HT â 2015 PEARSON EDU CATION , IN C.
ShiftingtheApplicantTalentCurve
COPYRIG HT © 2015 PEARSON EDU CATION , IN C.
8-14
7
15/03/2021
Shiftingthe
NormalApplicantTalentCurve
ĐIfdonestrategically,sourcingandrecruitingcan
discouragepoorfitsfromapplyingandincreasethe
numberofhighqualitypassiveandsemi-passive
candidateswhoapply.
ĐThisshiftsthecurvetoreflectadistributionlikethat
shownbytheBdistribution.
ĐTheBdistributionclearlyreducestheburdenonthe
selectionsystemtoidentifyqualitycandidatesand
significantlyincreasesthelikelihoodofidentifyinga
high-qualitycandidate.
COPYRIG HT â 2015 PEARSON EDU CATION , IN C.
8-15
CorrelationCoefficient
Correlationcoefficient,alsocalledPearsonsrorthe
bivariatecorrelation,isasinglenumberthatranges
from-1to+1thatreflectsthedirection (positiveor
negative)andmagnitude (strength)oftherelationship
betweentwovariables.
Đ Avalueofr=0indicatesthatvaluesofonemeasureare
unrelatedtovaluesoftheothermeasure.
Đ Avalueofr=+1meansthatthereisaperfectlylinear,
positiverelationshipbetweenthetwomeasures;asvalues
ofonemeasureincrease,valuesoftheother measure
increaseexactlythesameamountinstandarddeviations.
Đ Avalueofr=-1meansthatthereisaperfectlynegativeor
inverserelationshipbetweenthetwomeasures;asvaluesof
onemeasureincrease,valuesoftheothervariabledecrease
exactlythesameamountinstandarddeviations.
COPYRIG HT â 2015 PEARSON EDU CATION , IN C.
8-16
8
15/03/2021
GraphingCorrelations
Scatterplot:graphicalillustrationoftherelationship
betweentwovariables
Đ Eachpoint onthechartcorresponds tohowapersonscoredon
ameasureand howheor sheperformedon thejob
COPYRIG HT â 2015 PEARSON EDU CATION , IN C.
8-17
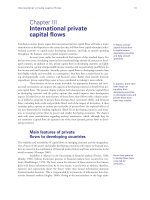
ScatterPlotofr=-.43
Would this test be useful in making hiring decisions?
COPYRIG HT © 2015 PEARSON EDU CATION , IN C.
8-18
9
15/03/2021
ScatterPlotofaCurvilinear
Relationship(r=.04)
COPYRIG HT © 2015 PEARSON EDU CATION , IN C.
8-19
DiagramsforCorrelations
COPYRIG HT © 2015 PEARSON EDU CATION , IN C.
8-20
10
15/03/2021
DiagramsforCorrelations
COPYRIG HT © 2015 PEARSON EDU CATION , IN C.
8-21
DiagramsforCorrelations
COPYRIG HT © 2015 PEARSON EDU CATION , IN C.
8-22
11
15/03/2021
ExamplesofUsesof
CorrelationCoefficients
ĐRelatingstoresizewithstaffinglevels
ĐRelatingseniorityinafirmwithjobperformance
ĐRelatingthetimetofillajobwithnew-hirequality
ĐRelatingqualityofnewhireswithbusiness
performanceandcustomersatisfaction
COPYRIG HT â 2015 PEARSON EDU CATION , IN C.
8-23
InterpretingCorrelations
ĐSamplingerror: Whenyouusestatistics,including
correlations,todrawinferencesorconclusions,youhaveto
beconcernedaboutsamplingerror.Samplingerroristhe
variabilityinsamplecorrelationsduetochance.
ĐYoucanaddresssamplingerrorthroughstatistical
significancetestingprocedures.
COPYRIG HT â 2015 PEARSON EDU CATION , IN C.
8-24
12
15/03/2021
InterpretingCorrelations,cont.
Statisticalsignificance:thedegreetowhichtheobserved
relationship isnotlikelyduetosamplingerror.
§ Aminimumrequirementforestablishingameaningfulrelationship.
Practicalsignificance:theobserved relationship islarge
enoughtobeofvalueinapracticalsense.
§ Inalargeenough sample,avery smallcorrelationwouldbe
statisticallysignificantbuttherelationshipmaynotbestrong
enough tojustifytheexpenseandtimeofusingthepredictor.
§ Aninexpensiveassessmentsystemmaybeusefulevenifthe
correlationissmall.
§ Alternatively,ifanassessmentthatcorrelated.15withjobsuccess
wasexpensive,tookalongtimetoadminister,andwasnotlikedby
jobcandidates,itmaynotbeworthusingevenifitisastatistically
significantpredictorofjob success.
8-25
COPYRIG HT © 2015 PEARSON EDU CATION , IN C.
MultipleRegression
ĐAstatistical techniquethatpredictsanoutcomeusingone
ormorepredictorvariables;itidentifiestheidealweightsto
assigneachpredictortomaximizethevalidityofasetof
predictors
ĐTheanalysisisbasedoneachpredictor scorrelationwith
theoutcomeandthedegreetowhichthepredictorsare
themselves correlated
ĐMultipleregressionexaminestheeffectofeachpredictor
variableafterstatistically controllingfortheeffectsofother
predictorsintheequation
COPYRIG HT â 2015 PEARSON EDU CATION , IN C.
8-26
13
15/03/2021
XandZCorrelatedwithY
butUncorrelatedwithEachOther
COPYRIG HT © 2015 PEARSON EDU CATION , IN C.
8-27
XandZCorrelatedwithYandHighly
CorrelatedwithEachOther
COPYRIG HT © 2015 PEARSON EDU CATION , IN C.
8-28
14
15/03/2021
MoreTypicalExample
COPYRIG HT © 2015 PEARSON EDU CATION , IN C.
8-29
Exampleofa
MultipleRegressionEquation
Jobsuccesspredicted =Constant+(b1 *Testscore1 )+(b2 *Testscore2 )
+(b3 *Testscore3 )…
Jobsuccesspredicted =10+(2*Interview)+(1*Personality)
+(.2*Jobknowledge)
Ifsomeonescores50ontheinterview, 27onthepersonalitytest, and20onthe
jobknowledgetest,whatisthepredicted jobsuccessscore?
Jobsuccesspredicted =10+(2*50)+(1*27)+(.2*20)
Jobsuccesspredicted =141
141isthencomparedwith predicted jobsuccessscoresofother candidatesto
determine whoshouldbeselected
COPYRIG HT © 2015 PEARSON EDU CATION , IN C.
8-30
15
15/03/2021
WhatIsReliability?
§Reliabilityreferstohowdependable orconsistent a
measureisinassessing aparticularcharacteristic.
§Measurementerrorinfluences reliability.
§Measurementerrorcanberandomorsystematic.
§Toevaluateameasure’sreliability,you should consider:
§ Thetypeofmeasure
§ Thetypeofreliabilityestimatereported
§ Thecontextinwhichthemeasurewillbeused
COPYRIG HT © 2015 PEARSON EDU CATION , IN C.
8-31
ReasonsforDifferingScores
onaTestorAssessment
Allofthesefactors,aswellasothers,caninfluence
reliability.Thatiswhytestsorassessment tools
should bestandardizedintheiruse.
Đ Temporaryphysicalor psychologicalstate
Đ Environmentalfactors
Đ Version,orform,ofthemeasure
Đ Differentevaluators
COPYRIG HT â 2015 PEARSON EDU CATION , IN C.
8-32
16
15/03/2021
TypesofErrors
ĐRandomerror:errorthatisnotduetoany
consistentcause
ĐSystematicerror:errorthatoccursbecauseof
consistentandpredictablefactors
ĐDeficiencyerror:errorthatoccurswhenyoufailto
measureimportantaspectsoftheattributeyou
wouldliketomeasure
ĐContaminationerror:errorthatoccurswhenother
factorsunrelatedtowhateverisbeingassessed
affecttheobservedscores
COPYRIG HT â 2015 PEARSON EDU CATION , IN C.
8-33
Deficiency,Contamination,and
Relevance
COPYRIG HT © 2015 PEARSON EDU CATION , IN C.
8-34
17
15/03/2021
InterpretingReliabilityCoefficients
The proper interpretation of reliability coefficients depends on
the type of reliability being assessed and the purpose of the
measure.
COPYRIG HT © 2015 PEARSON EDU CATION , IN C.
8-35
TypesofReliability
§Test-retestreliability reflectstherepeatabilityofscoresover
timeandthestabilityoftheunderlyingconstruct being
measured
§Alternateorparallelformreliability indicateshow
consistentscoresarelikelytobeifapersoncompletestwo
ormoreformsofthesamemeasure
ĐInternalconsistencyreliability indicatestheextenttowhich
itemsonagivenmeasureassessthesameconstruct
ĐInter-raterreliability indicateshowconsistentscoresare
likelytobeiftheresponsesarescoredbytwoor more
ratersusingthesameitem,scale,orinstrument
COPYRIG HT â 2015 PEARSON EDU CATION , IN C.
8-36
18
15/03/2021
StandardErrorofMeasurement
Thestandarderrorofmeasurement (SEM)isthemarginof
errorthatyou shouldexpectinanindividualscorebecause
oftheimperfectreliabilityofthemeasure.Itrepresentsthe
spreadofscoresyoumighthaveobserved hadyou tested
thesamepersonrepeatedly.
Theconfidenceintervalrepresentsthedegreeof
confidencethataperson’s “true”scorelieswithintheir
earnedscoreplusorminustheSEM,givensomelevelof
desiredconfidence.
Thelowerthestandarderror,themoreaccuratethe
measurements.
§ IftheSEMis0,theneachobservedscoreisthatperson’s true score
COPYRIG HT © 2015 PEARSON EDU CATION , IN C.
8-37
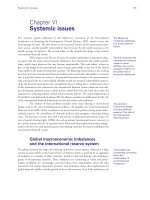
WhatIsValidity?
Validityreferstohowwellameasureassessesagiven
constructandthedegreetowhichyoucanmakespecific
conclusionsorpredictions basedon observed scores.
§ Validitycantellyouwhatyoumayconcludeorpredict about
someonebasedonhisorherscoreonameasure,thusindicating the
measure’susefulness.
§ Validity willtellyouhowusefulameasureisforaparticular
situation; reliability willtellyouhowconsistent scoresfromthat
measurewillbe.
§ Youcannotdrawvalidconclusions unlessyouaresurethatthe
measureisreliable.Evenwhenameasureisreliable, itmaynotbe
valid.
Đ Youmightbeabletomeasureapersons shoesizereliablybut itmay
notbeusefulasapredictor ofjobperformance.
Anymeasureusedinstaffingneedstobebothreliableand
validforthesituation.
COPYRIG HT â 2015 PEARSON EDU CATION , IN C.
8-38
19
15/03/2021
ReliabilityandValidity
COPYRIG HT © 2015 PEARSON EDU CATION , IN C.
8-39
WhatIsValidation?
Validationisthecumulativeandongoingprocess of
establishingthejobrelatednessofameasure
Therearethreetypesofvalidationprocesses:
Đ Content-relatedvalidation:Demonstratingthatthecontentofa
measureassessesimportantjob-relatedbehaviors
Đ Construct-relatedvalidation: Demonstratingthatameasure
assessestheconstruct,orcharacteristic,itclaimstomeasure
Đ Criterion-relatedvalidation:Demonstratingthatthereisa
statisticalrelationshipbetweenscoresfromameasureandthe
criterion,usuallysomeaspectofjobsuccess
COPYRIG HT â 2015 PEARSON EDU CATION , IN C.
8-40
20