Báo cáo hóa học: "H.264/AVC Video Compressed Traces: Multifractal and Fractal Analysis" potx
Bạn đang xem bản rút gọn của tài liệu. Xem và tải ngay bản đầy đủ của tài liệu tại đây (1.47 MB, 13 trang )
Hindawi Publishing Corporation
EURASIP Journal on Applied Signal Processing
Volume 2006, Article ID 75217, Pages 1–13
DOI 10.1155/ASP/2006/75217
H.264/AVC Video Compressed Traces: Multifractal and
Fractal Analysis
Irini Reljin,
1
Andreja Sam
˘
covi
´
c,
2
and Branimir Reljin
1
1
Faculty of Electrical Eng ineering, University of Belgrade, 11000 Belgrade, Serbia and Montenegro
2
Faculty of T raffic and Transport Engineering, University of Belgrade, 11000 Belgrade, Se rbia and Montenegro
Received 1 August 2005; Revised 1 January 2006; Accepted 30 April 2006
Publicly available long video traces encoded according to H.264/AVC were analyzed from the fractal and multifractal points of
view. It was shown that such video traces, as compressed videos (H.261, H.263, and MPEG-4 Version 2) exhibit inherent long-
range dependency, that is, fractal, property. Moreover they have high bit r ate variability, particularly at higher compression ratios.
Such signals may be better characterized by multifractal (MF) analysis, since this approach describes both local and global features
of the process. From multifractal spectra of the frame size video traces it was shown that higher compression ratio produces broader
and less regular MF spectra, indicating to higher MF nature and the existence of additive components in video traces. Considering
individual frames (I, P, and B) and their MF spectra one can approve additive nature of compressed video and the particular
influence of these frames to a whole MF spectrum. Since compressed video occupies a main part of transmission bandwidth, results
obtained from MF analysis of compressed video may contribute to more accurate modeling of modern teletraffic. Moreo ver, by
appropriate choice of the method for estimating MF quantities, an inverse MF analysis is possible, that means, from a once derived
MF spectrum of observed signal it is possible to recognize and extract parts of the signal which are characterized by particular
values of multifractal parameters. Intensive simulations and results obtained confirm the applicability and efficiency of MF analysis
of compressed video.
Copyright © 2006 Hindawi Publishing Corporation. All rights reserved.
1. INTRODUCTION
Video data is main and most critical part of modern multi-
media communications due to its huge amount of data. For
the transport over networks, video is typically compressed
(or, encoded) to reduce the bandwidth requirements. The
standardization activities in the field of video compression
are in focus of two professional bodies: the ITU-T (Inter-
national Telecommunicat ion Union) and the ISO/IEC (Inter-
national Organization for Standardization/International Elec-
trotechnical Commission). Their efforts are addressed towards
two different goals: to t ransmit video at as small as pos-
sible bit rate through standard telephone or mobile net-
works, leading to a family of H.26x standards (ITU-T), or
to support high quality video streaming, obtained from a
family of MPEG-x standards ( ISO/IEC), where “x” denotes
the appropriate suffix. Early video coding standards, such
as ITU-T H.261 and ISO/IEC MPEG-1, are designed for a
fixed quality level [1, 2]. Later on, video coding schemes
are designed to be scalable, that is, to encode the signal
once at highest resolution, but enable adaptive decoding de-
pending on the specific rate and resolution required by a
particular application. Such coding schemes permit video
transmission over variable bandwidth channels, both in
wireline and wireless networks, to store it on media of dif-
ferent capacity, and to display it on a variety of devices rang-
ing from small mobile terminals to high-resolution displays
[3–5].
The famous broadcast standard MPEG-2 (which is iden-
tical to ITU-T H.262) was the first standard which includes
a number of tools providing scalability. The MPEG-4 stan-
dard (or, more precisely, a set of various versions of this
standard) is multimedia oriented, providing even more flex-
ible scalability tools. Many features, necessary in multime-
dia, have been introduced: coding in object planes, model-
based coding, including SNR (signal-to-noise ratio) scalabil-
ity with fine granularity, and so forth. The MPEG-4 stan-
dard, Version 10, adopted also from the ITU-T as H.264/AVC
(advanced video coding) standard, defocuses two previously
defined goals of compression: not demanding the lowest bit
rate nor the highest video quality [3]. The idea was to enable
rather good quality, almost as good as in MPEG-2, at not ob-
viously the smallest bit rates. Those features make this stan-
dard very convenient for video distribution over the Inter-
net. It is expected that forthcoming digital video broadcast-
ing for handheld monitors (DVB-H) w ill be the first one in
2 EURASIP Journal on Applied Signal Processing
the broadcasting family accepting the H.264/AVC as a high-
quality non-MPEG-2 compression.
Video traces of encoded videos have been generated and
studied by many authors. Initial study was presented in Mark
Garrett’s Ph.D. thesis [6]. He has digitized and encoded as
M-JPEG (Motion JPEG) the hit movie “Star Wars,” and af-
ter that analyzed such video material considering the sizes
of each encoded video frame, which typically referred to as
frame size traces. The studied frame size traces correspond
to videos encoded with later MPEG-1 standard without rate
control into a single layer. Among different “classical” video
trafficmetrics,suchasmean,coefficient of variation, and au-
tocorrelation, he has used also the rescaled range analysis,or
R/S statistic, and the Fourier power spectrum (known as pe-
riodogram), for estimating the Hurst parameter, H,which
describes the long-range dependency (LRD) of the stochas-
tic process. However, note that LRD is only one feature of
a “fractal” behavior. For instance, as shown in [7], multi-
fractal analysis allows more precise statistics in describing
TCP (Transmission Control Protocol)traffic. Moreover, simi-
lar conclusions are derived when analyzing compressed video
[8–12]. More precise characterization of modern telecom-
munication traffic is possible by using multifractal analysis
[13].
The Telecommunication Networks Group at the Tech-
nical University of Berlin generated the library of frame
size traces of long MPEG-4, Version 2, H.261, and H.263
encoded videos [8]. Later on, two groups working at Ari-
zona State University, as well as in acticom GmbH, ex-
tended their work to the latest standard H.264/AVC [9–
12, 14]. These two groups have been deeply involved with
the statistical analysis of video traces. Namely, they calcu-
lated different parameters characterizing video trafficand
video quality, among them the fractal parameters. Also, they
have pointed out the need for multifractal characterization
of video traces, but left these investigations for future work
[9].
Analyses of encoded video traces have been preformed
also in [15–17], with special attention to fractal and mul-
tifractal characterization of M-JPEG and MPEG-1 en-
coded movie “Star Wars.” Later on, we have studied mul-
tifractal features of video compressed material available
at [8], and performed different analysis over them [18,
19].
This paper considers the fractal and multifr actal nature
of video traces encoded according to the ITU-T H.264/AVC
standard. The paper is organized as follows. Section 2 gives
thebriefreviewoffractalandmultifractalanalyseswith
special attention to their application in characterization
of compressed video. Simulation results are presented in
Section 3. We have analyzed long video traces of “Starship
Troopers” movie compressed according to H.264/AVC stan-
dard and publicly available at [14]. The results are com-
pared to those obtained when the same sequences are com-
pressed by other coding standards, such as H.261, H.263,
and MPEG-4, Version 2, of different quality. Some conclu-
sion remarks and suggestions for future work are given in
Section 4.
2. FRACTAL AND MULTIFRACTAL NATURE OF
VIDEO TRACES
2.1. Long-range dependency of video traces
For one-dimensional signals the description of the long-
range dependency in data (i.e., the fractal nature of the pro-
cess) may be derived from the Hurst index, H [20]. It was
shown that pure random process (e.g., Brownian motion) is
characterized by H
= 0.5. In this case there is no correlation
between incremental signal changes [20]. If 0.5 <H<1,
there is a positive correlation between incremental changes,
that means, if the process increases in some time interval,
then it tends to continue to increase in the nearest interval,
and vice versa if it decreases—being thus self-similar, that is,
exhibiting the LRD behavior. This tendency is as strong as the
Hurst index is closer to unity. Conversely, if 0 <H<0.5, the
opposite is true. Then the negative correlation between the
increments (or a short-range dependency (SRD)) arises and
the system has a tendency to oscillate. The Hurst index can be
estimated in several ways: through R/S statistics, from peri-
odogram, and/or ID C (index of disper sion constant) method,
by using wavelet estimator [21], or indirectly, through the
fractal dimension.
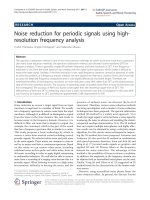
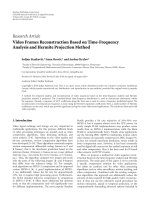
Figure 1 illustrates the LRD behavior of the process. This
figure gives the frame sizes, in bytes per frame, as a func-
tion of the frame number. (a) corresponds to one hour
of the movie “Starship Troopers” with 25 frames per sec-
ond (90,000 frames) compressed according to the ITU-T
H.264/AVC standard, with quantization scale q
p
= 15 [14].
By zooming a part of a whole trace, for instance, from 50,000
to 53,000 frames (Figure 1(b)) and further, from 51,370 to
51,550 frames (c) the LRD behavior of compressed video is
visually approved, because the shape of all sequences remains
similar, irrespective of the time scale.
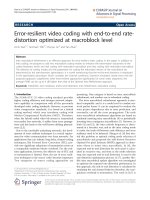
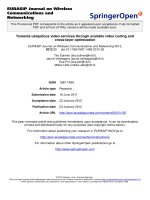
Numerical evaluation of the LRD behavior of the sig-
nal as in Figure 1 is performed through Hu rst indices. The
R/S statistic is computed for logarithmically spaced aggrega-
tion level k, by considering different starting points. Plotting
log(R/S), as a function of log(k) gives R/S diagram (also re-
ferred to as pox diagram of R/S)[9]. The Hurst index is esti-
mated as a slope of linear regression line. This procedure is il-
lustrated in Figure 2(a) where R/S plot for first 10,000 frames
of “Starship Troopers” movie, as in Figure 1, assuming ag-
gregation level 100 and setting 7 different starting points (la-
beled by different marks), is depicted. From the slope of lin-
ear regression line we estimated H
= 0.89768.
Another way we used for estimating the Hurst index was
the periodogram method. When plotting periodogram in a
log-log plot, the Hurst index may be estimated from a slope
of least square regression as H
= (1 − slope)/2. The peri-
odogram of the same sequence of 10,000 frames is depicted
in Figure 2(b), from which the Hurst index is estimated as
H
= 0.82934. Note that values of H indices obtained from
different estimators may be different, as obtained in consid-
ered case. This is in accordance with the results already re-
ported in literature, for instance in [6, 20, 21]. Note that, for
process with high periodicity, the estimated H-index may be
even greater than 1, despite its LRD feature [9]. Removing
Irini Reljin et al. 3
012 345 678 9
10
4
Frame number
0
5
10
15
10
3
Bytes per frame
(a)
50 000 50 500 51 000 51 500 52 000 52 500
Frame number
0
2
4
6
10
3
Bytes per frame
(b)
51 400 51 500
Frame number
0
2
4
10
3
Bytes per frame
(c)
Figure 1: A part of “Starship Troopers” video traces compressed
according to H.264/AVC standard (quantization scale q
p
= 15), and
its zoomed parts ((b) and (c)).
the periodicity from the signal and then applying the Hurst
estimator, more useful information may be obtained [22].
In Table 1 the Hurst indices for “Starship Troopers” video
traces of different lengths (described by number of video
frames) compressed according to H.264/AVC standard are
listed. Hurst indices are estimated from periodograms, for
three different quantization scales, q
p
. In all cases the LRD
property is appro ved (0.5 <H<1), that is, considered
video traces are self-similar. Also, the Hurst index varies with
the quantization scale q
p
, that is, with the compression rate.
Digitized “Starship Troopers” movie, as well as other dig i-
tal videos, exhibits inherent fractal property (or isolated frac-
tal behavior). Such property was obtained from the process
itself, without any interaction with network or some other
source of variability [21]. Certainly, when sending such a
video over real network, traffic conditions influence the sig-
nal and may change its Hurst index, both increasing or de-
creasing it, depending on particular case. For instance, when
10 100
k
3
3.5
4
4.5
5
Log(R/S)
“Starship Troopers”
q
p
= 15, 10000 frames
Aggregation levels
= 100
7 starting points: 1-7
H
= slope
1
2
3
7
H
= 0.89768
(a)
1E 30.01 0.1
Normalized frequency
1E
7
1E
6
1E
5
1E
4
1E
3
0.01
0.1
1
10
Magnitude
“Starship Troopers”
q
p
= 15, 10000 frames
Periodogram analysis
H
= (1 slope)/2
H
= 0.82934
(b)
Figure 2: (a) R/S plot and (b) the periodogram for first 10 000
frames of the “Starship Troopers” movie, compressed according to
H.264AVC with quantization scale q
p
= 15 [14].
using neural network scheduling in packet switching node
[15], outgoing traffic tends to be less fractal than the incom-
ing one—the Hurst index decreases approaching to 0.5(ran-
dom walk process) [23, 24]. In this paper the influence of
external sources of variability is not considered.
2.2. Multifractal analysis of video traces
The Hurst index is one of the possible descriptors of frac-
tal behavior. Fractal structures may be evaluated through
their fractal dimension as well. Practical and very often used
technique for estimating fractal dimension is box counting
[25–27] In this method we cover observed structure with d-
dimensional boxes with size ε, and count the number of oc-
cupied boxes, N(ε). Frac tal dimension is then estimated as
D
f
=−lim
ε→0
ln
N(ε)
ln(ε)
. (1)
4 EURASIP Journal on Applied Signal Processing
Table 1: Hurst indices for “Starship Troopers” video traces of dif-
ferent lengths (described by number of video frames) for different
quantization scales, q
p
, or compression ratio, CR.
Video trace Hurst indices for different
length:
quantization scales, q
p
, or compression ratio, CR
number of q
p
= 5 q
p
= 15 q
p
= 25
frames
CR = 3.5CR= 15.9CR= 79.0
500 0.7802 0.94298 0.75985
800
0.78637 0.78477 0.80582
1 000
0.79554 0.79481 0.80701
3 000
0.80417 0.8041 0.79143
5 000
0.80282 0.80181 0.69483
10 000
0.81522 0.82934 0.80202
20 000
0.81245 0.83263 0.8018
30 000
0.81538 0.84327 0.80451
50 000
0.81421 0.81227 0.81262
70 000
0.81219 0.84631 0.81308
90 000
0.8953 0.85598 0.80762
It was shown that for one-dimensional signals fractal dimen-
sion and Hurst index relate as [26, 27]
D
f
= 2 − H. (2)
Fractalsmaybegeneratedartificiallybyapplyingsome
exact rule. Such structures are known as deterministic (or,
mathematical) fractals. Since they are composed of parts
whose smaller scales replicate exactly their larger ones, up to
infinity, they have the same fractal dimension in all scales,
and consequently are referred to as exact self-similar,or
monofractals. A lot of such structures are known, for instance,
Cantor sets, Koch’s curves, Sierpinski gasket and carpet, and
so forth, [25–27].
Instead, a variety of natural objects, structures, and phe-
nomena are characterized by self-similarity in some statisti-
cal way: the reproduced detail is not an exact copy of the pre-
vious. Such objects are referred to as random fractals. Also,
natural fractals are not self-similar over all scales. There are
both upper and lower size limits, beyond which a structure is
no longer fractal. Upon closer examination of random frac-
tals it is possible to recognize subsets with their own frac-
tal dimension which varies with the observed scale; so, they
may be referred to as multifractals (MF). We can assume
such structures as fractals embedded within fractals. For de-
scribing them more sophisticated mathematical quantities
are necessary [28, 29]. Just as classical geometry is unable to
accurately depict many natural structures, traditional frac-
tal analysis techniques may also fall short in fully describing
natural patterns.
The quantitative description of multifractal property can
be derived in several ways [7, 28–31]. Very often, the proce-
dure starts with finding the noninteger exponent α, known as
the H
¨
older exponent, describing the pointwise singularit y of
the object, and then deriving the distribution of this quantity,
known as the multifractal spectrum, f (α), as will be briefly re-
viewed.
Let the structure S be divided into nonoverlapping boxes
S
i
of size ε such that S =
i
S
i
.EachboxS
i
is characterized by
some amount of measure, μ(S
i
). An appropriate parameter
suggested to the MF analysis is defined by
α
i
=
ln
μ
S
i
ln(ε)
,(3)
which is denoted as the coarse H
¨
older exponent of the subset
S
i
.Ifε tends to zero the coarse H
¨
older exponent approaches
to limiting value α at observed point
α
= lim
ε→0
α
i
. (4)
Parameter α depends on the actual position on the fractal
and describes local regularity of the structure. In the whole
structure there are usually many boxes with the same param-
eter α
i
. We may find the distribution of this quantity over the
subsets characterized by α
i
,as
f
ε
α
i
=−
ln
N
ε
α
i
ln(ε)
,(5)
where N
ε
(α
i
) is the number of boxes S
j
containing particular
value of α
i
.From(5) one can obtain the limiting value
f (α)
= lim
ε→0
f
ε
(α)
,(6)
known as the Hausdorff dimension of the distribution of α,
or the MF spectrum. This function describes the global reg-
ularity of observed structure [7, 28–33]. Note again that box
counting is only one among several different methods for es-
timating the MF spectrum, but due to its simplicity and fast
computing procedure this method is very often used [28–31].
Irrespective of particular technique for deriving MF quanti-
ties α and f (α), they describe both local and global regular-
ities of the process under investigation. Consequently, MF
analysis may be used in a broad class of signal processing
problems, as a robust method for describing and/or extract-
ing some features probably hidden in large amount of data.
For instance, it was shown that for TCP traffic the LRD
indices are not quite appropriate for describing such pro-
cess. By analyzing TCP traffic at Berkeley, Riedi and Vehel
[7] shown that significant differences between incoming and
outgoing traffic flows may be derived from the shapes of their
multifractal spectra although both traffics are characterized
by almost the same Hurst indices.
From the R/S diagram in Figure 2(a) qualitative descrip-
tion of the multifractal nature of this process may be inferred.
As noted earlier, the Hurst index is estimated as the slope
of linear regression line of R/S diagram. From Figure 2(a) it
is evident that the slope differs at different aggregation lev-
els, indicating the local variation of H indices, thus “Star-
ship Troopers” movie compressed according to the ITU-T
H.264/AVC is multifractal. Similar conclusion was derived
also when analyzing video sequences compressed according
to H.261, H.263, and MPEG-4 standards [16–19].
Irini Reljin et al. 5
Ver y intensive growth of multimedia applications, where
compressed video has a dominant role, has been chang-
ing the nature of teletraffic, in general. From POTS (plain
old telephone services) networks, where the trafficwassuc-
cessfully described by Poisson distribution, the new teletraf-
fic changes the statistics, typically exhibiting high bit rate
variability (burstiness) as well as LRD (or self-similarity)
[20, 22]. Multifractal analysis, being capable to perform both
local and global features of the process under investigation,
seems to be more appropriate for analysis of compressed
video and thus for analyzing modern teletraffic. Results ob-
tained from MF analysis of compressed video may contribute
to more accurate modeling of modern teletraffic and multi-
media. Moreover, by appropriate choice of method for find-
ing multifractal quantities α and f (α) it may be possible to
establish one-by-one correspondence between points in sig-
nal space and in MF space permitting thus the “inverse” mul-
tifractal analysis: finding parts in signal space having partic-
ular value of α and/or f (α)[30–33]. For instance, from once
derived pair (α, f (α)) of v ideo trace, we may extract frames
with high (or low) local fractal behavior (characterized by
high (or low) α values, resp.) and/or extract frames, hav-
ing particular value of f (α), which are globally rare events
(having low f (α))orarefrequentinvideotrace(high f (α)).
In this way we can describe more completely the nature and
structure of observed video traces. Similar procedure was al-
ready applied in image processing, for instance, in [30–33].
3. SIMULATION RESULTS
We have analyzed long “Starship Troopers” movie video
traces (one hour of movie with 25 frames/second, containing
90,000 frames), compressed according to H.264/AVC stan-
dard and publicly available at [14]. Frame size traces are
analyzed from the fractal and multifractal points of view.
The results were compared to those derived for the same
sequences compressed according to other coding standards,
H.261, H.263, and MPEG-4 Version 2, available at [8]. For
reasons of interoperability and low cost, video material was
assumed in QCIF (quarter common intermediate format)res-
olution for mat (144
× 176 pixels per frame). Fractal behav-
ior in video sequences was investigated through the Hurst
index, determined from R/S diagram and periodogram, as
described in Section 2.1. Multifractal quantities α and f (α)
were estimated by applying histogram method, already de-
velopedin[32]. The choice of a method is motivated by the
fact that it retains high-frequency components in MF spec-
trum permitting sharp distinction between fine details em-
phasizing thus the singularities. In addition, this method en-
ables inverse multifractal analysis, as described in Section 2.
Note that publicly available algorithms, for instance, the
method of moments suggested by Chhabra and Jensen [34]
and embedded in software MATPACK [35], as well as the
method using Legendre measure, used in software FracLab
[36], produce good-looking but very smooth MF spectra,
where some specific information may be hidden.
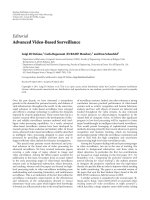
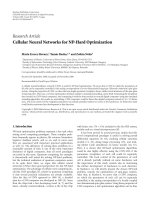
Figure 3(a) represents the MF spectra derived for the
“Starship Troopers” movie for all available cases from data-
base [14], that is, for all quantization scale parameters: from
q
p
= 1toq
p
= 31. Although it is difficult to distinguish par-
ticular spectra in Figure 3, because plots are erratic and in-
terwoven, several fundamental conclusions may be derived.
First, for low q
p
(q
p
= 1, 5,10) the MF spectrum is narrow
(exhibiting mainly LRD behavior), concave and almost sym-
metrical around its maximum near α
= 1. Higher values of
q
p
produce broader spectra indicating to higher multifrac-
tal nature. Note that quantization scale parameter relates to
a compression ratio, CR, expressed as the ratio between the
number of bytes of uncompressed versus compressed video.
As a reference, the values of CR for video traces analyzed in
this paper are listed in Ta ble 2.
Furthermore, as q
p
increases the spectra become more
asymmetrical (in this case right-sided, i.e., going to higher
α), having more local maxima and local singularities.
Previous investigations of different processes [7]have
shown that pure concave (parabola-like) MF spectrum is ob-
tained for multiplicative process. Failure of being concave is
a sign that observed process is not pure multiplicative one.
For instance, if the signal is composed by additive compo-
nents, extra parabola-shaped curves would appear in the
spectrum. Diagrams presented in Figure 3 exhibit such be-
havior, when increasing the quantization scale, or compres-
sion ratio.
TheMFspectrumof“StarshipTroopers”movieisalmost
concave, Figure 3(a), for quantization scale q
p
= 1, indicat-
ing to the multiplicative nature of the process. However, ad-
ditional small parabolas arise at both sides of the spectrum.
This is the sign of the existence of additive components, but
these events are rare (having small f (α) values) in a whole
movie. Remind that the sequences in H.264/AVC video, as
well as in MPEG-4, consist of I, P, B (intra-coded, predictive,
bidirectional) frames within the GOP (group of picture)struc-
tured as IBBPBBPBBPBBI, in coding order. In order to find
the sources of irregularities in MF spectra, we investigated
traces extracted from a whole movie, containing only I, P, or
B individual frames, for all quantization scale parameters as
for a whole video. Corresponding MF spectra are depicted in
Figures 3(b)–3(d).
For I-frames MF spectra, Figure 3(b), retain almost con-
cave shape at all quantization scales, with very small singu-
larities. Bearing in mind that those frames are intra-coded,
exploiting only spatial redundancy between pixels within the
same frame, such a feature is expectable, because I-frames
have the smallest compression rate and smallest variability in
size versus quantization scale.
On the contrary, inter-coded frames, P and B, exploit
mainly the temporal redundancy. In addition, these frames
contain usually small amount of new information at the posi-
tions from which objects start to move. The relevant content
of these frames will be changed depending on the quantiza-
tion scale. In this way the additional compression is obtained
forcing the smaller frame sizes, producing more variability
(the motion vectors information is kept unchanged). For
small quantization scales q
p
(up to 10), that is, small com-
pressionrates(upto7),MFspectraofPandBvideotraces
are of rather regular concave shape, slightly broader than cor-
responding MF spectra of I frames. But as compression rate
6 EURASIP Journal on Applied Signal Processing
0.70.80.911.11.21.31.41.5
α
0.1
0
0.1
0.2
0.3
0.4
0.5
0.6
0.7
0.8
f (α)
1
5
10
15
20
25
31
“Starship Troopers”
MF spectra
q
p
= 1
q
p
= 5
q
p
= 10
q
p
= 15
q
p
= 20
q
p
= 25
q
p
= 31
(a)
0.70.80.911.11.21.31.41.5
α
0.1
0
0.1
0.2
0.3
0.4
0.5
0.6
0.7
0.8
f (α)
1
31
“Starship Troopers”
I frames MF spectra
q
p
= 1I
q
p
= 5I
q
p
= 10 I
q
p
= 15 I
q
p
= 20 I
q
p
= 25 I
q
p
= 31 I
(b)
0.70.80.911.11.21.31.41.5
α
0.1
0
0.1
0.2
0.3
0.4
0.5
0.6
0.7
0.8
f (α)
1
5
10
15
20
25
31
“Starship Troopers”
P frames MF spectra
q
p
= 1P
q
p
= 5P
q
p
= 10 P
q
p
= 15 P
q
p
= 20 P
q
p
= 25 P
q
p
= 31 P
(c)
0.70.80.911.11.21.31.41.5
α
0.1
0
0.1
0.2
0.3
0.4
0.5
0.6
0.7
0.8
f (α)
“Starship Troopers”
B frames MF spectra
1
5
10
15
20
25
31
q
p
= 1B
q
p
= 5B
q
p
= 10 B
q
p
= 15 B
q
p
= 20 B
q
p
= 25 B
q
p
= 31 B
(d)
Figure 3: Multifractal spectra for H.26L “Starship Troopers” video traces: (a) all frames; (b) I frames only; (c) P frames only; (d) B frames
only.
increases, P and B spectra become more broader and more
irregular indicating the higher multifractal nature of these
traces. Comparing Figure 3(a) to 3(d), one can conclude that
the whole video is composed of additive components I, P, and
B, and that B frames have the g reatest influence on the whole
MF spectrum, particularly at higher quantization scales.
For better comparison of I, P, and B traces and their in-
fluence on the whole movie, we choose three quantization
scales q
p
, q
p
= 5, 15, and 25. Their MF spec tra are depicted
in Figures 4(a)–4(c) from which three main conclusions may
be better clarified. By increasing the quantization scale all the
three spectra are extended, become unsymmetrical (right-
sided), and point out more additive components. The MF
spectra of I frames are less changeable with q
p
, while the op-
posite is with B frames. Migration to the right side of MF
spectra at higher q
p
indicates the increasing of the local frac-
tal behavior of the process.
We also compared the traces of H.264/AVC and MPEG-
4, Version 2 (single layer, too), of the same movie. The
GOP structures of those sequences were the same, with
q
p
= 10 in both cases. By applying the procedure as above
we calculated the MF spectra for a whole MPEG-4 trace
Irini Reljin et al. 7
Table 2: Compression ratio, CR, expresed as the ratio between the
number of bytes of uncompressed and compressed videos.
Coding standard q
p
CR
H.264/AVC
12.21
53.50
10 7.00
15 15.91
20 35.75
25 78.96
31 189.80
MPEG-4 V2 10 37.68
H.261 VBR
x 17.47
H.263 VBR
x 21.50
and for separated I, P, and B traces. Corresponding spec-
tra are depicted in Figure 5. The MF spectrum of MPEG-4,
Figure 5(a), is wider and more regular (with less variability)
than that of H.264/AVC, and the same conclusion is valid for
MF spectra of separated I, P, and B fr ames. Also, one can ob-
serve that B traces are wider and have greatest influence on
the whole MF spectrum in both cases (MPEG-4 and H.264).
Since q
p
relates to compression ratio, we also compared
the H.264/AVC, q
p
= 10, with MPEG-4, q
p
= 20, since
those sequences have (almost) the same compression ratio
(35.75 and 37.67, resp.). Corresponding spectra, depicted in
Figure 6,arealmostidenticalexceptatbothends,particu-
larlyathighvaluesofα, where that of H.264/AVC exhibits
more variability.
It is known that the maximum of MF spectrum corre-
sponds to the fractal dimension of the whole structure [7]—
describing most frequently events in the structure. By exam-
ining MF spectra from Figure 3(a), close to their maxima,
the plots as in Figure 7(a) are obtained. As we can see, by
increasing the quantization scale maxima migra te rightward
(to higher α) while corresponding values of f (α)
max
become
lower. Such behavior indicates that higher q
p
(slightly) in-
creases local fractal behavior of most frequently events but
the number of these events decreases. From the whole MF
spectra we already concluded that higher compression rate
leads to broader MF spectra and more singularities. The
statistics of the compressed video are changed.
For comparison purposes we analyzed the same video
traces as discussed previously, by other methods and avail-
able computing tools, such as the method of moments [34],
embedded into the MATPACK software [35], as well as the
method using Legendre spectrum embedded into the Fra-
cLab software [36]. Corresponding MF spectra are depicted
in Figures 8 and 9. Lower diagrams show zoomed details
around maxima.
Global shapes of these diagrams are similar to ours: as
q
p
increases spectra become wider and right-sided, with
rightward shifting of maxima. Both diagrams exhibit high
smoothness, but fine details are missed. Also, both diagrams
have the parts with negative f (α), which correspond to re-
gions where the probability of observing α decreases too fast
with the grid size ε [7]. In our approach in these regions
0.70.80.911.11.21.31.41.5
α
0.1
0
0.1
0.2
0.3
0.4
0.5
0.6
0.7
0.8
f (α)
“Starship Troopers”
q
p
= 5
I, P, B frames MF spectra
I
P
B
I
P
B
(a)
0.70.80.911.11.21.31.41.5
α
0.1
0
0.1
0.2
0.3
0.4
0.5
0.6
0.7
0.8
f (α)
“Starship Troopers”
q
p
= 15
I, P, B frames MF spectra
B
P
I
I
P
B
(b)
0.70.80.911.11.21.31.41.5
α
0.1
0
0.1
0.2
0.3
0.4
0.5
0.6
0.7
0.8
f (α)
“Starship Troopers”
q
p
= 25
I, P, B frames MF spectra
B
P
I
I
P
B
(c)
Figure 4: Multifractal spectra for I, P, B frames and for different
quantization scales: (a) q
p
= 5; (b) q
p
= 15; (c) q
p
= 25.
8 EURASIP Journal on Applied Signal Processing
0.70.80.911.11.21.31.41.5
α
0.1
0
0.1
0.2
0.3
0.4
0.5
0.6
0.7
0.8
f (α)
“Starship Troopers”
q
p
= 10
MPEG-4 versus H.264
H.264
MPEG-4
(a)
0.70.80.911.11.21.31.41.5
α
0.1
0
0.1
0.2
0.3
0.4
0.5
0.6
0.7
0.8
f (α)
“Starship Troopers”
q
p
= 10
I, P, B frames MF spectra
H.264
MPEG-4
B
P
I
I
P
B
(b)
Figure 5: (a) H.264/AVC versus MPEG-4 multifractal spectra; (b)
separatedI,P,B.
we estimated high variability of MF spectrum, indicating to
additive components. In Figure 9 all diagrams have maxima
with the same value of f (α)
max
= 1,butthisisaconsequence
of normalization.
The compression rate has strong influence on fractal
and multifractal nature of compressed video, which we have
approved by analyzing the same movie compressed by the
H.261 and H.263 standards, without output rate control
(known as variable bit rate), leading to low bit rates. Al-
though these two compression techniques are not easily com-
parable to the H.264/AVC (the frame structures are different
because both standards have no GOP and H.263 using I, P,
and PB frames, instead of B frames), from the shape of MF
spectra, Figure 10, it is evident that higher compression rate
(H.263var) leads to broader MF spectrum.
0.70.80.911.11.21.31.41.5
α
0
0.1
0.2
0.3
0.4
0.5
0.6
f (α)
“Starship Troopers”
MF spectra
MPEG-4, q
p
= 10
CR
= 37.68
H.264, q
p
= 20
CR
= 35.75
MPEG-4, q
p
= 10
H.264, q
p
= 20
Figure 6: Multifractal spectra of H.264/AVC, q
p
= 10 and MPEG-4,
q
p
= 20.
We already noted that by applying inverse multifractal
spectra one can extract some specific information from a
whole signal. Such a possibility w ill be approved through
several examples. Let us observe, first, the “Starship Troop-
ers” H.264/AVC with q
p
= 15, as in Figure 1 and redrawn
in Figure 11(a). Its MF spectrum is depicted in Figure 3(a)
and separated spectra for I, P, and B frames in Figure 4(b).
From these spectra we recognize additive components (sin-
gularities) at low α. By choosing frames having α in the range
from 0.7701 to 0.7703, irrespective of the range for f (α),
extraction of only few frames is obtained, as depicted in
Figure 11(b). By zooming the range from 50,000 to 53,000
frames the closer position of those frames is possible, as al-
ready depicted in Figures 1(b) and 1(c). As it can be seen,
those are frames with sharp change of content, probably be-
cause of the change in the movie scene (corresponding to
new shots in video sequence).
As a second example we will observe the same movie
but compressed with MPEG-4 Version 2 coding standard
with q
p
= 10. The whole one-hour trace is depicted in
Figure 12(a).FromFigure 5,whereitsMFspectrumispre-
sented, an interesting “hole” arises at high α,around1.28. By
choosing 1.271 <α<1.285, as indicated into the right box
in Figure 5(a), and applying inverse MF analysis we extracted
several very short frames: of the length of about 70 bytes, as
depicted in Figure 12(b). In this range of α the value of f (α)
is almost zero, indicating the extremely rare events, but lo-
cally, these frames highly differ from surrounding, which will
be more visible when zooming the part of video trace around
40,300 and 66,000 frames.
On the contrary, when choosing singularities from the
left side of MF spectrum, values of α between 0.82 to
0.85—see left box in Figure 5(a), we extracted frames as in
Figure 12(c). These frames have similar meaning as those in
Figure 11(b): they are the largest singular frames in the whole
video.
Irini Reljin et al. 9
0.95 1 1.05 1.1
α
0.5
0.55
0.6
0.65
0.7
0.75
f (α)
“Starship Troopers”
MF spectra peaks
1
5
10
15
20
25
q
p
= 1
q
p
= 5
q
p
= 10
q
p
= 15
q
p
= 20
q
p
= 25
q
p
= 31
(a)
11.01 1.02 1.03 1.04 1.05
α
0.55
0.6
0.65
0.7
f (α)
max
Interpolation curve is
Y
= 105 200.6X +96.26 X
2
q
p
= 1
q
p
= 5
q
p
= 10
q
p
= 15
q
p
= 20
q
p
= 25
q
p
= 31
(b)
Figure 7: (a) Part of multifractal spectra for H.264/AVC v ideo traces around their maxima. (b) Maxima of MF spectra for H.264/AVC video
traces and interpolation curve.
0.60.811.21.41.61.822.22.4
α
1
0.5
0
0.5
1
f (α)
“Starship Troopers”
MF spectra
(The method of moments)
q
p
= 1
q
p
= 5
q
p
= 10
q
p
= 15
q
p
= 20
q
p
= 25
q
p
= 31
(a)
11.01 1.02 1.03 1.04 1.05 1.06
α
0.998
0.999
1
1.001
1.002
f (α)
“Starship Troopers”
MF spectra peaks
(The method of moments)
1
5
10
15
20
25
31
q
p
= 1
q
p
= 5
q
p
= 10
q
p
= 15
q
p
= 20
q
p
= 25
q
p
= 31
(b)
Figure 8: (a) The MF spectra of video traces “Starship Troopers” obtained when applying method of moments embedded into the package
MATPACK [35], and (b) their zoomed details around maxima.
4. CONCLUSIONS
Long video traces of “Starship Troopers” movie compressed
according to H.264/AVC standard have been analyzed. The
motivation of this work lies in the expectation that this cod-
ing standard will be used in digital video broadcasting for
handheld monitors providing high-quality video with low
bit rates. Also, since this standard enables rather good qual-
ity of transferred video, almost as good as in MPEG-2 but
with significantly smaller bit rates, it is very convenient for
video dist ribution over the Internet. Among different statis-
tical parameters (frame sizes versus time, aggregated frame
sizes, frame size histogram, i.e., the dist ribution of frame
sizes, mean, coefficient of v ariance, peak/mean value, etc.),
10 EURASIP Journal on Applied Signal Processing
0.60.811.21.41.61.82
Hoelder exponents α
0.2
0
0.2
0.4
0.6
0.8
1
1.2
Legendre spectrum
f (α)
q
p
= 15
q
p
= 25
q
p
= 31
q
p
= 1
q
p
= 5
q
p
= 10
1
5
10
15
25
31
(a)
0.99 1 1.01 1.02 1.03 1.04 1.05
Hoelder exponents α
0.998
0.9985
0.999
0.9995
1
1.0005
Legendre spectrum
f (α)
q
p
= 15
q
p
= 25
q
p
= 31
q
p
= 1
q
p
= 5
q
p
= 10
1
510 15
25 31
(b)
Figure 9: The MF spectra of video traces “Starship Troopers” obtained when applying Legendre method embedded into the package FracLab
[36], and their zoomed details around maxima.
0.70.80.911.11.21.31.41.5
α
0.1
0
0.1
0.2
0.3
0.4
0.5
0.6
0.7
0.8
f (α)
“Starship Troopers”
MF spectra
H.261var
H.263var
H.264
H.264, q
p
= 10, CR = 7
H.261var, CR
= 17.47
H.263var, CR
= 21.5
Figure 10: MF spectra for different compression standards.
which have been examined by other researchers, we con-
centrated our attention mainly on fractal and multifractal
analyses. Modern teletraffic exhibits long-range dependency,
which may be evaluated by fractal analysis, through the esti-
mation of Hurst index, for instance. However, as reported in
literature [7], the LRD property itself is not sufficient for de-
scribing modern teletraffic, because such teletraffic exhibits
not only LRD but also high bit rate variability (burstiness),
when fractal analysis fall short in fully describing such pro-
cess. Long-range dependency is only one feature of a “fractal”
behavior describing mainly low frequency content (or the
global trend) of the signal variability—see, for instance, R/S
plot in Figure 2: Hurst index, as a descriptor of fractal nature,
is obtained as a slope of linear regression line, although the
slope locally varies with observed scale. Conversely, multi-
fractal approach is capable to perform both local and global
features of the process under investigation, being more ap-
propriate for analysis of different complex processes, includ-
ing compressed video.
We evaluated the LRD property of compressed video
by observing Hurst indices, which are estimated for long
video traces publicly available at [14]. The multifractal anal-
ysis was performed by histogram method. This method ex-
ploits coarse H
¨
older exponent, enabling sharp distinction be-
tween fine details in the MF spectrum permitting the selec-
tion and extraction of particular singularities, by applying an
inverse MF analysis [32, 33]. Some other methods for esti-
mating multifractal parameters, known from literature and
publicly available, are compared with our method. Although
global results are quite similar, irrespective of the method,
when using our method the MF spectrum retains hig h fre-
quency components permitting fine distinction between dif-
ferent processes. Moreover, our method enables an inverse
MF analysis, meaning that from once derived MF spectrum
we may recognize and extract video frames having par ticular
value of a pair (α, f (α)).
The results perfor med by analyzing H.264/AVC video
traces were compared to those obtained for the same se-
quences compressed by other coding standards, such as
H.261, H.263, and MPEG-4, Version 2, of different quality.
It was shown that for low quantization scale q
p
(or low com-
pression ratio) MF spectrum corresponds to multiplicative
process and exhibits mainly LRD behavior. Higher values of
q
p
produce broader spectra indicating the higher multifractal
Irini Reljin et al. 11
01234567
10
4
Frame number
0
5
10
15
10
3
Bytes per frame
(a)
012345678
10
4
Frame number
0
2
4
10
3
Bytes per frame
0.7701 <α<0.7703
(b)
Figure 11: Illustration of inverse multifractal analysis: (a) input video trace “Starship Troopers” H.264/AVC, q
p
= 10; (b) extracted frames
having particular values of α:0.7710 <α<0.7703.
0123456789
10
4
Frame number
0
2
4
6
8
10
3
Bytes per frame
(a)
0123456789
10
4
Frame number
0
20
40
60
80
Bytes per frame
1.271 <α<1.285
(b)
0123456789
10
4
Frame number
0
2
4
6
8
10
3
Bytes per frame
0.82 <α<0.85
(c)
Figure 12: Illustration of inverse multifractal analysis: (a) input video trace “Starship Troopers,” MPEG-4 V2, q
p
= 10, (b) extracted frames
having particular values of α :1.271 <α<1.285; extremely rare events—very short frames, (c) extracted frames having particular values of
α :0.82 <α<0.85; rare events—largest singular frames in a whole video.
nature. Furthermore, when q
p
increases, the spectra become
more asymmetr ical—going to higher α (indicating to pat-
terns with higher fractality), having more local maxima, and
more local singularities (indicating to additive processes). In
addition, when q
p
increases the maximum of MF sp ectrum
f (α), corresponding to the fractal dimension, migrates right-
wise (to higher α), while the value of f (α)
max
becomes lower.
Such features indicate that higher q
p
increase local fractal be-
havior of most frequently events but the number of these
events decreases. The statistics of the compressed video defi-
nitely are related to the rate of compression.
More detailed analysis of video tra ces shows that the
main influence on the whole MF spectrum is that of the
B frames, while I frames produces least influence. This
conclusion is quite reasonable having in mind the compres-
sion mechanism: I frames are compressed exploiting spatial
redundancy between pixels within the same frame, having
thus the smallest compression r a te and the smallest vari-
ability in size versus quantization scale. Conversely, P and
B frames exploit mainly temporal redundancy being more
compressed and more variable in size, that is, having stronger
burstiness. As compression ratio increases, P and B spec-
tra become more broader and more irregular indicating to
higher multifract al nature of these traces.
From the results derived in this paper one can conclude
that compressed digital videos, irrespective of the particu-
lar compression technique, exhibit inherent fractal property
(or isolated fractal behavior), without any interaction with
12 EURASIP Journal on Applied Signal Processing
network or some other sources of variability. Moreover, such
videos have high bit rate var iability (burstiness), particularly
at higher compression ratios. Since modern multimedia traf-
fic consists mainly of compressed v ideo, by analyzing such a
video better understanding of modern teletrafficwillbepos-
sible. Certainly, when sending compressed video over real
network, t raffic conditions influenced the signal and may
change its Hurst index, both increasing or decreasing it, de-
pending on particular case. For instance, when using neural
network scheduling in packet switching node [15], outgoing
traffic tends to be less fractal than the incoming one—the
Hurst index decreases approaching to 0.5(randomwalkpro-
cess) [23, 24]. The influence of external sources of variability
to fractal/multifractal nature of compressed video will be our
focus for further research.
REFERENCES
[1] K. Rao, Z. Bojkovic, and D. Milovanovic, Multimedia Com-
munication Systems: Te chniques, Standards, and Networks,
Prentice-Hall, Englewood Cliffs, NJ, USA, 2002.
[2] Y. Wang, J. Osterman, and Y. Q. Zhang, Video Processing and
Communications, Prentice-Hall, Englewood Cliffs, NJ, USA,
2002.
[3] R. Sch
¨
afer, T. Wiegand, and H. Schwarz, “The emerging
H.264/ AVC standard,” EBU Technical Review, no. 293, 2003.
[4] ITU-T, H.263 Recommendation, ITU-T, Geneva, Switzerland,
2000.
[5] Draft ITU-T Rec. H.264, ISO/IEC 14496-10, 2002 E.
[6] M. Garrett, Contributions toward real-time services on packet
switched networks, Ph.D. thesis, Columbia University, New
York, NY, USA, 1993.
[7] R. Riedi and J. L. Vehel, “Multifractal properties of TCP traf-
fic: a numerical s tudy,” INRIA Research Report 3129, IN-
RIA, Rocquencourt, Le Chesnay Cedex, France, 1997, http://
www.stat.rice.edu/%7Eriedi/cv
publications.html.
[8] F. Fitzek and M. Reisslein, “MPEG-4 and H.263 v ideo traces
for network performance evaluation,” TKN Technical Report
TKN-00-06, Technical University Berlin, Berlin, Ger many,
2000.
[9] M. Reisslein, J. Lassetter, S. Ratnam, O. Lotfallah, F. Fitzek,
and S. Panchanathan, “Traffic and quality characterization
of scalable encoded video: a large-scale trace-based study,
part 1: overview and definitions,” Tech. Rep., Telecommu-
nications Research Center, Department of Electrical Engi-
neering, Arizona State University, Tempe, Ariz, USA, 2002.
/>[10] M. Reisslein, J. Lassetter, S. Ratnam, O. Lotfallah, F. Fitzek,
and S. Panchanathan, “Traffic and quality characterization of
scalable encoded v ideo: a large-scale trace-based study, part 2:
statistical analysis of single-layer encoded video,” Tech. Rep.,
Telecommunications Research Center, Department of Electri-
cal Engineering, Arizona State University, Tempe, Ariz, USA,
2002. />[11] M. Reisslein, J. Lassetter, S. Ratnam, O. Lotfallah, F. Fitzek,
and S. Panchanathan, “Traffic and quality characterization of
scalable encoded v ideo: a large-scale trace-based study, part 3:
statistical analysis of temporal scalable encoded video,” Tech.
Rep., Telecommunications Research Center, Department of
Electrical Engineering, Arizona State University, Tempe, Ariz,
USA, 2002. />[12] F. Fitzek, M. Zorzi, P. Seeling, and M. Reisslein, “Video
and audio trace files of pre-encoded video content for net-
work performance measurements,” Tech. Rep., Telecommu-
nications Research Center, Department of Electrical Engi-
neering, Arizona State University, Tempe, Ariz, USA, 2003.
/>[13] M. Krishna, V. Gadre, and U. Desai, Multifractal Based Net-
work Traffic Modeling, Kluwer Academic Press, Boston, Mass,
USA, 2003.
[14] www.acticom.de.
[15] I. Reljin, “Neural network based cell scheduling in ATM node,”
IEEE Communications Letters, vol. 2, no. 3, pp. 78–80, 1998.
[16] I. Reljin and B. Reljin, “Neurocomputing in teletraffic: mul-
tifractal spectrum approximation,” in Proceedings of the 5th
Seminar on Neural Network Applications in Electrical Engineer-
ing (NEUREL ’00), pp. 24–31, Belgra de, Yugoslavia, Septem-
ber 2000.
[17] B. Reljin and I. Reljin, “Multimedia: the impact on the teletraf-
fic,” in Book 2, N. Mastorakis, Ed., pp. 366–373, World Scien-
tific and Engineering Society Press, Clearance Center, Danvers,
Mass, USA, 2000.
[18] I. Reljin and B. Reljin, “Statistical and multifractal character-
istics of H.263 compressed video streams,” in Proceedings of
20th Symp. on New Technologies in Post and Telecomm. Traf-
fic, pp. 193–205, Faculty of Traffic Eng., Belgrade, Yugoslavia,
December 2002.
[19] I. Reljin and B. Reljin, “Fractal and multifractal analyses of
compressed video sequences,” Facta Universitatis (NIS) Se ries:
Electronics and Energetics , vol. 16, no. 3, pp. 401–414, 2003.
[20] M. Taqqu, V. Teverovsky, and W. Willinger, “Estimators for
long-range dependence: an empirical study,” Fractals, vol. 3,
no. 4, pp. 785–788, 1995.
[21] M. Roughan, D. Veitch, and P. Abry, “On-line estimation
of the parameters of long-range dependence,” in Proceedings
of IEEE Global Telecommunications Conference (GLOBECOM
’98), vol. 6, pp. 3716–3721, Sydney, NSW, Australia, Novem-
ber 1998.
[22] I. Beran, Statistics for Long-Memory Processes, Chapman &
Hall, New York, NY, USA, 1994.
[23] I. Reljin, A neural network control of ATM multiplexer,Ph.D.
thesis, Faculty of Electrical Engineering, University of Bel-
grade, Belgrade, Yugoslavia, 1998.
[24] B. Reljin and I. Reljin, “Neural networks in teletra
ffic control:
pro et contra?” in Proceedings of the 4th International Con-
ference on Telecommunications in Modern Satellite, Cable and
Broadcasting Services (TELSIKS ’99), vol. 2, pp. 518–527, Ni
ˇ
s,
Yugoslavia, October 1999.
[25] B. Mandelbrot, The Fractal Geometry of Nature,W.H.Free-
man, New York, NY, USA, 1983.
[26] H. Peitgen, H. Jurgens, and D. Saupe, Chaos and Fractals,
Springer, New York, NY, USA, 1992.
[27] M. Turner, J. Blackledge, and P. Andrews, Fractal Geometry in
Digital Imaging, Academic Press, New York, NY, USA, 1998.
[28] C. Evertsz and B. Mandelbrot, “Multifractal measures. Ap-
pendix B,” in Chaos and Fractals,H.Peitgen,H.Jurgens,and
D. Saupe, Eds., pp. 849–881, Springer, New York, NY, USA,
1992.
[29] P. Iannaccone and M. Khokha, Eds., Fractal Geometry in Bio-
logical Systems, CRC Press, Boca Raton, Fla, USA, 1996.
[30] J. L. V
´
ehel and P. Mignot, “Multifractal segmentation of im-
ages,” Fractals, vol. 2, no. 3, pp. 371–377, 1994.
Irini Reljin et al. 13
[31] J. L. V
´
ehel, “Introduction to the multufractal analysis of im-
ages,” Tech. Rep., INRIA, Rocquencourt, Le Chesnay Cedex,
France, 1996.
[32] I. Reljin and B. Reljin, “Fractal geometry and multifractals in
analyzing and processing medical data and images,” Archive of
Oncology, vol. 10, no. 4, pp. 283–293, 2002.
[33] T. Stojic, I. Reljin, and B. Reljin, “Adaptation of multifrac-
tal analysis to segmentation of microcalcifications in digital
mammograms,” Physica A: Statistical Mechanics and its Appli-
cations, vol. 367, pp. 494–508, 2006.
[34] A. Chhabra and R. Jensen, “Direct determination of the f(α)
singularity spectrum,” Physical Review Letters, vol. 62, no. 12,
pp. 1327–1330, 1989.
[35] B. Gammel, MATPACK Library Release 1.4, s-
ik.tu-muenchen.de/gammel/matpack/html/LibDoc/Tools/in-
stall.html.
[36] FracLab v1.1, 2003, />ment/FracLab.
Irini Reljin received the Diploma degree in
electrical engineering in 1977, and the M.S.
and Ph.D. degrees in electrical engineering
in 1986 and 1998, all from the Faculty of
Electrical Engineering (FEE), University of
Belgrade, Serbia and Montenegro (former
Yugoslavia). Since 1983 she is with the ICT
College in Belgrade, working as a College
Professor. Since 2001 she joined the FEE,
University of Belgrade, as an Assistant Pro-
fessor, teaching the mulimedia and video technologies at under-
graduate studies, as well as neural networks applications at grad-
uate studies. She has published over 20 journal papers and over
150 conference presentations, as well as several book chapters, and
has g iven a number of invited lectures on different aspects of com-
munications, signal and image processing, fractal and multifractal
analyses, and content-based indexing and retrieval. She has partici-
pated in a number of scientific and research projects in the areas of
telecommunications, multimedia, and telemedicine, and currently
she participated in COST Action 292 “Semantic Multimodal Anal-
ysis of Digital Media.” Her research interests are in video and mul-
timedia analyses, and digital image processing, neural networks,
statistical signal analysis, fractal and multifractal analyses. She is
a Member of the IEEE, SMPTE, BSUAE, Gender Team, as well as
several national societies.
Andreja Sam
˘
covi
´
c received the Diploma
and the M.S. degrees in electrical engineer-
ing in 1989 and 1995, respectively, from
the Faculty of Electrical Engineering, Uni-
versity of Belgrade, Serbia and Montene-
gro(formerYugoslavia),andthePh.D.de-
gree in 2005 from the Faculty of Trafficand
Transport Engineering, University of Bel-
grade. He joined the Faculty of Trafficand
Transport Engineering, University of Bel-
grade, from 1991, working in the areas of electrical engineer-
ing, communications, and image coding. He spent 9 months in
1991/1992 as a scholar of the OEAD at the TU Vienna, Austria,
and 6 months in 1999/2000 at the Friedrich-Alexander University
Erlangen-Nuremberg, in Erlangen, Germany, as a scholar of DAAD.
In 2003, he served as a lecturer at the UniAdrion summer school in
Ammoudia-Preveza, Greece. In 2003-2004, he participated at the
research project with the Virtual University of the Adriatic-Ionian
basin, as well as in 2004-2005 at the bilateral project with Technical
University of Kosice, Slovakia. He has published ten journal papers
and over 60 conference presentations, on different aspects of image
coding and communications, as well as one monogr aph. He is a
Member of the BSUAE, and several national societies.
Branimir Reljin receivedtheDiplomade-
gree in electrical engineering in 1969, and
the M.S. and Ph.D. degrees in electrical
engineering in 1977 and 1983, all from
the Faculty of Electrical Engineering (FEE)
University of Belgrade, Serbia and Mon-
tenegro (former Yugoslavia). He joined the
FEE, University of Belgrade from 1974,
passing all teaching positions, and since
1995 he has been a Professor of electrical
engineering, teaching several courses in graduate and undergrad-
uate studies: circuit theory, digital image processing, medical infor-
matics, telemedicine, artificial neural networks, digital signal pro-
cessing, and network synthesis. He has published over 60 journal
papers and over 250 conference presentations, four books and sev-
eral book chapters, and has given a number of invited lectures, on
different aspects of circuit theory, neural networks, medical image
processing, fractal and multifractal analyses, and content-based in-
dexing and retrieval. He has been a Project Leader in several scien-
tific and research projects in the areas of neur al networks, medical
imaging and telemedicine, and sig nal acquisition and processing,
and currently he is a Coordinator of Working Group 5 in COST
Action 292 “Semantic Multimodal Analysis of Digital Media.” He is
a Member of the IEEE, BSUAE, and several national societies.