Báo cáo hóa học: " Research Article Rain Attenuation at 58 GHz: Prediction versus Long-Term Trial Results" pot
Bạn đang xem bản rút gọn của tài liệu. Xem và tải ngay bản đầy đủ của tài liệu tại đây (810.79 KB, 7 trang )
Hindawi Publishing Corporation
EURASIP Journal on Wireless Communications and Networking
Volume 2007, Article ID 46083, 7 pages
doi:10.1155/2007/46083
Research Article
Rain Attenuation at 58 GHz: Prediction versus
Long-Term Trial Results
Vaclav Kvicera and Martin Grabner
Technical Centre of Telecommunications and Posts (TESTCOM), Hvozdanska 3, 148 01 Praha 4, Czech Republic
Received 13 April 2006; Revised 13 October 2006; Accepted 17 December 2006
Recommended by Su-Khiong Yong
Electromagnetic wave propagation research in frequency band 58 GHz was started at TESTCOM in Praha due to lack of experimen-
tally obtained results needed for a realistic calculation of quality and availability of point-to-point fixed systems. Rain attenuation
data obtained from a path at 58 GHz with V polarization located in Praha was processed over a 5-year period. Rainfall intensities
have been measured by means of a heated siphon rain gauge. In parallel, r ainfall intensity data from rain gauge records was statis-
tically processed over the same year periods as the rain attenuation data. Cumulative distributions of rainfall intensities obtained
as well as cumulative distributions of rain attenuation obtained are compared with the calculated ones in accordance with relevant
ITU-R recommendations. The results obtained can be used as the primary basis for the possible extension of the ITU-R recom-
mendation for calculating rain attenuation distributions up to 60 GHz. The obtained dependence of percentages of time of the
average year on the percentages of time of the average worst month is also compared with the relevant ITU-R recommendation.
The results obtained are discussed.
Copyright © 2007 V. Kvicera and M. Grabner. This is an open access article distributed under the Creative Commons Attribution
License, which permits unrestricted use, distribution, and reproduction in any medium, provided the original work is properly
cited.
1. INTRODUCTION
Frequency bands above 38 GHz will be extensively utilized
by terrestrial digital fixed services in the near future because
the lower bands are almost fully occupied. It means that the
60 GHz frequency band will be utilized now although there
is a lack of experimentally obtained primary bases which are
needed for realistic calculations of both availability and reli-
ability of service. Some experimental activities is focused on
specific attenuation due to rain [1] or intervehicle commu-
nications [2]. One-year results of propagation experiment at
58 GHz carried out in Sydney and Praha were described in
[3]. Results of 2-year measurement of attenuation due to spe-
cific hydrometeors (rain, rain with hail, snow, fog) were de-
scribed in [4]. Relevant ITU-R recommendation [5]which
can be used for estimating long-term statistics of rain attenu-
ation is considered to be v alid in all parts of the world at least
for frequencies up to 40 GHz and path lengths up to 60 km.
Minimum usable path length is not mentioned.
The 60 GHz frequency band is suitable for short-range
communications technologies. Significant oxygen absorp-
tion, water vapour absorption, and attenuation due to hy-
drometeors (rain, snow, hail, and fog) limit communications
systems. The oxygen absorption has a peak near 60 GHz, typ-
ically around 16 dB/km [6]. Water vapour f urther slightly at-
tenuates the signal, about 0.2 dB/km. Therefore the band is
the most suitable one for intensive frequency reuse.
This contribution presents rain attenuation characteris-
tics at 58 GHz with V polarization obtained on a path 850 m
long, over a 5-year period of observation.
2. EXPERIMENTAL SETUP
Electromagnetic wave propagation research in the frequency
band 58 GHz was started at TESTCOM in December 2000.
NOKIA MetroHopper equipment working on frequency
57.650 GHz with V polarization has been used. The length
of the experimental path which is located in Praha is about
850 m. Recording margin has been about 30 dB due to spe-
cial offset antennas used. The research is focused on attenua-
tion due to hydrometeors. The calibrated AGC voltages cor-
responding to the received signal level have been gathered
continuously with the sampling of 10 Hz on PC hard disc,
and data obtained over a 5-year period from December 2000
to November 2005 was processed statistically.
2 EURASIP Journal on Wireless Communications and Networking
10.10.010.0010.0001
Percentage of time
0
50
100
150
200
R(1) (mm/h)
1st-year period
2nd-year period
3rd-year period
4th-year period
5th-year period
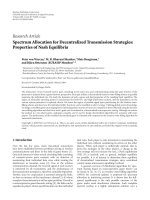
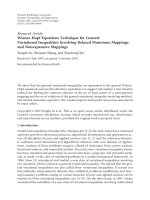
Figure 1: CDs of average 1-minute rain intensities for individual
1-year periods.
10.10.010.0010.00010.00001
Percentage of time
0
50
100
150
200
R(1) (mm/h)
12/2000-11/2005 measured
2/1992-12/2005 measured
ITU-R calculated
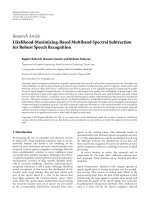
Figure 2: CDs of average 1-minute rain intensities for AY.
It should be noted that only rain attenuation events were
processed. Not only attenuation due to rain but also atten-
uation due to rain with snow, snow, fog, and hail occurred
within the 5-year period of observation. Individual attenua-
tion events were compared with concurrent meteorological
situations and were carefully classified according to the types
of individual hydrometeors occurring.
Meteorological conditions were identified by means of
both v ideo BW camera images of the space between trans-
mitter and receiver sites, and data obtained from an au-
tomatic meteorological station located near the receiver
site. The automatic meteorological station is equipped with
VAISALA sensors for measurement of temperature, humid-
ity and pressure of air, velocity and direction of wind, visi-
bility and 2 tipping-bucket rain gauges with differing collect-
ing areas. These rain gauges were used only for indication of
rainfalls due to their low time resolution of tips.
Rainfall intensities have been measured since February
1992 by means of a heated siphon rain gauge. Rainfall inten-
sity data from rain gauge records was statistically processed
over the same contiguous 1-year periods as was the rain at-
tenuation data.
Both the ra in attenuation data and the rainfall intensity
data were statistically processed twice: (1) over five individual
contiguous 1-year periods, and (2) together over the entire 5-
year period.
3. TRIAL RESULTS AND DISCUSSION
3.1. Rainfall intensity distributions
Resulting cumulative distributions (CDs) of average 1-
minute rainfall intensities (R(1)) for individual 1-year peri-
ods of observation are given in Figure 1.
Large year-to-year variations of individual year distri-
butions may be seen clearly in Figure 1.Differences up to
+15 mm/h
− 37 mm/h for 0.001% of time, +25 mm/h −
11 mm/h for 0.01% of time, and +5 mm/h−2 mm/h for 0.1%
of time occur between measured average 1-minute rainfall
intensities and rainfall intensities corresponding to CD of
R(1) for the average year (AY).
It should be noted that the values of rain intensities for
the lowest percentages of time correspond mostly to a single
rain event in a full year, and therefore they are not statistically
reliable.
Resulting CD of R(1) for the AY over the 5-year period,
resulting CD of R(1) for the AY over the 14-year period 1992–
2005, and CD of R(1) for the AY in accordance with ITU-R
recommendation [7] are plotted together in Figure 2.
It can be seen that the value of R(1) for 0.01% of time for
the entire 5-year period is 30.2 mm/h while the value of R(1)
for the same percentage of time obtained through processing
rainfall intensity data over the 14-year period is 29.3 mm/h,
and the R(1) for 0.01% of time in accordance with ITU-R
recommendation [7] is 26.0 mm/h.
Resulting CDs of R(1) for the whole 5-year period of ob-
servation together and for the 14-year period are very much
alike: they differ from each other by no more than 14 mm/h
in the range from 1% to 0.0001%. R(1) obtained over the 5-
year period are up to 20 mm/h greater (for the percentage of
time of about 0.002%) than the R(1) calculated in accordance
with ITU-R recommendation [7].
Perfect agreement emerging between the obtained values
R(1) and the calculated ones for percentages of time smaller
than 0.0001% is remarkable.
3.2. Rain attenuation distributions
Rain attenuation data obtained on the path at 58 GHz with
V polarization was processed over the same 5-year period
as was rainfall intensity data. For the first 3-year period,
special offset V-polarized antennas were not covered with
radomes. Radomes made of special rubberized canvas have
been used since November 2003 to protect antennas aga inst
snow drifts.
V. Kvicera and M. Grabner 3
10.10.010.0010.0001
Percentage of time
0
5
10
15
20
25
30
A
rain
(dB)
1st-year period
2nd-year period
3rd-year period
4th-year period
5th-year period
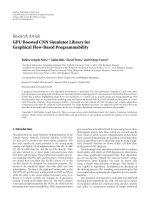
Figure 3: CDs of rain attenuation for individual 1-year periods.
10.10.010.0010.0001
Percentage of time
0
5
10
15
20
25
30
A
rain
(dB)
AY meas ure d
ITU-R calculated
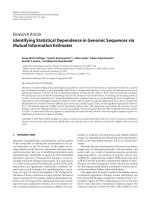
Figure 4: CDs of rain attenuation for AY.
10.10.010.0010.0001
Percentage of time
0
5
10
15
20
25
30
A
rain
(dB)
Measured
ITU-R
Measured, LN approximation
ITU-R, LN approximation
Figure 5: CDs of rain attenuation for AY and its LN approxima-
tions.
Moreover, when radomes installed on antennas were wet,
additional attenuation about 2 dB was observed. Therefore
the obtained CDs of attenuation due to r ain were shifted
about 2 dB since November 2003 to compensate for this ef-
fect. Of course, CDs of attenuation due to rain for the first 3-
year period of observation remained without modifications.
Resulting CDs of attenuation due to rain for individual 1-
year periods of observation separately are plotted in Figure 3.
Large year-to-year variations of individual year distribu-
tions may be seen, similarly as in Figure 1. The notice con-
cerning the low statistic reliability of the values of rain at-
tenuation for the lowest percentages of time is also valid for
distributions given in Figures 3 and 6. The comparison of
CDs of R(1) and CDs of rain attenuation, as plotted in Fig-
ures 1 and 3, is very interesting. Very good correspondence
exists between rainfall intensities and rain attenuation for the
second year of observation. The values of both rainfall in-
tensities and rain attenuation are the highest ones for time
percentages between 0.1% and 0.004%. While the rainfall in-
tensities for the 4th- and the fifth-year periods are very close
to each other, associated rain attenuation values sig nificantly
differ. Relevant analysis in more detail is given in Section 3.3 .
Resulting CD of attenuation due to rain for the average
year over the 5-year period of observation and CDs of atten-
uation due to rain for the AY in accordance with ITU-R rec-
ommendation [5] are plotted together in Figure 4.Themea-
sured value of R(1)
= 30.2 mm/h for 0.01% of time over al l
the 5-years of observation, obtained from Figure 2,wasused
for the calculation of CD of rain attenuation in accordance
with ITU-R recommendation [5].
Due to the fact that the recommendation is valid for per-
centages of time of AY between 0.001% and 1% only, the part
of CD calculated for percentages of time smaller than 0.001%
is plotted by dashed line. This convention is also used in Fig-
ures 8–12. It must be stressed that all the comparisons made
out of the range of validity must be treated with care. Nat-
urally, availability smaller than 0.001% can be assessed only
exceptionally. If the calculated value of R(1)
= 26.0 mm/h for
0.01% of time, obtained from ITU-R recommendation [7], is
used for the calculation of CD, the calculated values of atten-
uation will be even smaller if the measured value of R(1) over
the entire 5-year period of observation is used.
Very smooth curve was obtained for the measured CD of
attenuation due to rain for the average year over the 5-year
period of observation. It can be seen that the smaller the per-
centage of time is, the greater the differenc e between mea-
sured values of rain attenuation and the calculated ones is.
For percentages of time greater than 0.01%, measured values
of attenuation due to rain are greater than the calculated ones
up to about 1.5 dB. The obtained values of rain attenuation
then grow up rapidly for percentages of time smaller than
0.01%. A difference of about 13 dB can be observed between
the measured rain attenuation and the calculated one for the
chosen percentage of time of about 0.001%.
From the point of view of the percentages of time, it
can be noted that for the value of attenuation due to rain
of 30 dB, the difference between the measured percentage
of time and the calculated one is about one decade. These
4 EURASIP Journal on Wireless Communications and Networking
1010.10.010.001
Percentage of time
0
5
10
15
20
25
30
A
rain
(dB)
WM, 1st-year period
WM, 2nd-year period
WM, 3rd-year period
WM, 4th-year period
WM, 5th-year period
Figure 6: CDs of rain attenuation for WM of individual 1-year
periods.
1010.10.010.0010.0001
Percentage of time
0
5
10
15
20
25
30
A
rain
(dB)
AWM m e a s u red
AWM ITU-R calculated
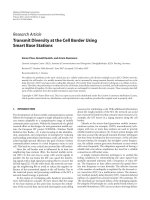
Figure 7:CDsofrainattenuationforAWM.
10.10.010.0010.0001
Percentage of time
0
5
10
15
20
25
30
A
rain
(dB)
1st-year period
AY ITU-R
WM of the 1st-year period
AWM I T U - R
Figure 8: CDs of rain attenuation obtained for the first-year period.
differences can be explained (1) by the fact that the ITU-R
prediction procedure is considered to be valid for f requen-
cies up to 40 GHz, and (2) by the influence of local climate
conditions.
The cumulative distributions of rain attenuation for the
average year, as plotted in Figure 4, can be approximated by
log-normal (LN) distributions. The measured CD of rain at-
tenuation can be approximated by LN distribution with the
parameters μ
= 0.0239 dB and σ
2
= 2.7394, and the calcu-
lated CD of rain attenuation in accordance with ITU-R rec-
ommendation [7] can be approximated by LN distribution
with the parameters μ
= 0.0402 dB and σ
2
= 2.0154. All
distributions mentioned here are shown together in Figure 5
in the dB-nor mal scale to better see the differences between
the obtained distributions and their LN approximations than
when shown in the log-normal scale. Differences between
the calculated CD of rain attenuation in accordance with the
ITU-R recommendation and its LN approximation are about
±1 dB. Slightly greater differences can be seen between the
measured CD of rain attenuation and its LN approximation,
about +1.5 dB for 0.01% of time and about 3.5 dB for about
0.001% of time of year.
Resulting CDs of attenuation due to rain for the worst
months (WMs) of individual 1-year periods of observation
separately are plotted in Figure 6.
The CD of rain attenuation obtained for the average
worst month (AWM) over the entire 5-year period of obser-
vation and CDs of attenuation due to rain for the AWM in
accordance with ITU-R recommendation [5] are plotted to-
gether in Figure 7. The measured value of R(1)
= 30.2 mm/h
for 0.01% of time over the entire 5-year period of observa-
tion (obtained from Figure 2) was used for the calculation of
CD of rain attenuation for the average worst month in accor-
dance with I TU-R recommendation [5]. Because the recom-
mendation is valid for percentages of time of AWM between
0.007% and 1% only, the part of CD calculated for percent-
ages of time smaller than 0.007% is plotted by dashed line.
This convention is also used in Figures 8–12. The compar-
isons made out of the validity range must be treated again
with care.
For percentages of time greater than 0.05%, measured
values of attenuation due to rain are greater than the calcu-
latedonesuptoabout2dB.Thedifference up to about 13 dB
can be observed between the measured rain attenuation and
the calculated one for the percentage of time of about 0.01%.
From the point of view of the percentages of time, the
difference between measured percentage of time and the cal-
culated one is about one decade for the attenuation due to
rain of 30 dB. These significant differences can also be ex-
plained by the fact that the ITU-R prediction procedure is
considered to be valid for frequencies up to 40 GHz only and
by influence of local climate conditions.
3.3. Year-to-year variability of rain
attenuation distributions
Due to the fact that measured values of attenuation due to
rain are greater than those calculated in accordance with
V. Kvicera and M. Grabner 5
10.10.010.0010.0001
Percentage of time
0
5
10
15
20
25
30
A
rain
(dB)
2nd-year period
AY ITU-R
WM of the 2nd-year period
AWM I T U - R
Figure 9: CDs of rain attenuation obtained for the second-year pe-
riod.
10.10.010.0010.0001
Percentage of time
0
5
10
15
20
25
30
A
rain
(dB)
3rd-year period
AY ITU-R
WM of the 3rd-year period
AWM I T U - R
Figure 10: CDs of rain attenuation obtained for the third-year pe-
riod.
ITU-R recommendation [5] for both the average year distri-
bution (Figure 4) and the average worst-month distribution
(Figure 7), it will be useful to analyze the results obtained
on a year-to-year basis. Measured values of R(1) for 0.01%
of time in individual-year periods, obtained from Figure 1,
were used for the calculation of CDs of rain attenuation for
individual-year periods in accordance with ITU-R recom-
mendation [5]. Worst-month distributions were calculated
from the year distributions using ITU-R recommendation
[8].
Resulting CDs of attenuation due to rain and the calcu-
lated ones in accordance with [5] for both the first-year pe-
riod and the worst month of the first-year period are plotted
together in Figure 8.
It can be seen that measured values of attenuation due
to rain are greater than the calculated ones by up to about
4.5 dB for both the first-year period and the worst month of
the first-year period.
10.10.010.0010.0001
Percentage of time
0
5
10
15
20
25
30
A
rain
(dB)
4th-year period
AY ITU-R
WM of the 4th-year period
AWM I T U - R
Figure 11: CDs of rain attenuation obtained for the fourth-year
period.
10.10.010.0010.0001
Percentage of time
0
5
10
15
20
25
30
A
rain
(dB)
5th-year period
AY ITU-R
WM of the 5th-year period
AWM I T U - R
Figure 12: CDs of rain attenuation obtained for the fifth-year pe-
riod.
The results obtained for the second-year period are
shown in Figure 9.
For the second-year period, the measured values of atten-
uation due to rain agree very well with the calculated values
of attenuation due to rain in accordance with the ITU-R rec-
ommendation [5] for the percentages of time greater than
0.02%. For the worst month of the second-year period, mea-
sured values of attenuation due to rain are lower than the
calculated ones by up to about 1.5 dB for percentages of
time greater than 0.09%. Measured values of attenuation are
greater than the calculated ones for smaller percentages of
time than forenamed.
The results obtained for the third-year period are drawn
in Figure 10.
For the third-year period, measured values of attenuation
due to rain agree very well with the calculated values of atten-
uation due to rain in accordance with the ITU-R recommen-
dation [5] for percentages of time greater than 0.01%. For the
6 EURASIP Journal on Wireless Communications and Networking
Table 1: Comparison of the measured rainfall intensities, the cal-
culated attenuation due to rain, and the measured attenuation due
to rain for the individual-year periods and the entire 5-year period
for 0.01% of time of year only. Note that the numbers in parenthesis
are the span of relevant quantities from the highest value to the lowest
one.
Period R
0.01
(1) (mm/h)
A
0.01
(dB) A
0.01
(dB)
ITU-R [1] measured
1st year 27.4 (3) 7.8 (3) 10.0 (3)
2nd year 56.4 (1) 14.0 (1) 16.8 (1)
3rd year 32.0 (2) 8.8 (2) 9.0 (4)
4th year 18.5 (5) 5.6 (5) 11.2 (2)
5th year 21.0 (4) 6.3 (4) 7.0 (5)
5 years 30.2 8.4 10.1
worst month of the third-year period, measured values of at-
tenuation due to rain agree very well with calculated values of
attenuation due to rain in accordance with the ITU-R recom-
mendation [5] for percentages of time greater than 0.07%.
Measured values of attenuation for both the third-year pe-
riod and its worst m onth grow up rapidly for smaller per-
centages of time than forenamed.
The results obtained for the fourth-year period are plot-
ted in Figure 11.
Both the measured values of attenuation due to rain for
the fourth-year period and for its worst month are greater
than the calculated ones by up to about 10 dB. Besides this,
the measured CD of attenuation due to rain for the fourth-
year period agree very well with the calculated CD of attenu-
ation due to rain for its worst month.
The results obtained for last-the fifth-year periods are
shown in Figure 12.
For the fifth-year period, measured values of attenuation
due to rain agree very well with calculated values of attenua-
tion due to rain in a ccordance with the ITU-R recommenda-
tion [5] for percentages of time greater than 0.01%. For the
worst month of the third-year period, measured values of at-
tenuation due to rain agree very well with the calculated ones
for percentages of time greater than 0.04%. For percentages
of time smaller than the forenamed ones, measured values of
attenuation due to rain are greater than the calculated ones
by up to about 5 dB for the year period and by up to about
7 dB for its worst month.
For the average year distribution, good agreement be-
tween measured values of rain attenuation and those calcu-
lated was found for percentages of t ime greater than 0.01%.
For percentages of time smaller than 0.01%, obtained values
of rain attenuation then grow up rapidly and a difference of
about 13 dB occurs for 0.001 percentage of time.
For the average worst-month distribution, good agree-
ment between measured values of rain attenuation and those
calculated was found for percentages of time greater than
0.05%. For percentages of time smaller than 0.05%, obtained
values of rain attenuation then grow up rapidly, and a differ-
ence of about 13 dB occurs for 0.01% of time.
Comparison of measured rainfall intensities, calculated
attenuation due to rain, and measured attenuation due to
rain for individual 1-year periods and the entire 5-year pe-
riod for exclusively 0.01% of time of year are given in Table 1.
Best agreement between the measured value of rain at-
tenuation and the calculated one for exclusively 0.01% of
time of year was found for the third year of observation. Very
good agreement, that is, a difference smaller than 3 dB be-
tween the calculated value of rain attenuation and the mea-
sured one, can be observed for the first-, the second-, and the
fifth-year periods.
While calculated values of attenuation in accordance with
the ITU-R recommendation correspond with measured rain-
fall intensities in individual-year periods very well (i.e., the
higher rain intensity, the higher rain attenuation), measured
values of rain attenuation do not correspond exactly with
measured rainfall intensities for the second, fourth, and fifth
years. Better correspondence can be found for the first and
the third years of observation.
While rainfall intensities for the fourth- and the fifth-year
periods are very close to each other, rain attenuation values
significantly differ by about 4 dB. While rainfall intensities
for the first- and the third-year periods are greater than rain-
fall intensities for the fourth- and fifth-year periods, rain at-
tenuation values are situated between the CDs for the fourth-
and the fifth-year periods.
Although the measured rainfall intensity of 32.0 mm/h
is the second highest one, the measured rain attenuation of
9.0 dB is on the fourth position. Similarly, the measured rain-
fall intensity of 18.5 mm/h is the lowest one while the mea-
sured rain attenuation of 11.2 dB is on the second position.
Finally, the measured rainfall intensity of 21.0 mm/h is on
the fourth position while the measured rain attenuation of
7.7 dB is the lowest one.
It is apparent that the span of measured rain attenuation
values for individual-year periods should correspond with
the span of values of measured rainfall intensities, similarly
as the correspondence is in the case of the span of rain atten-
uation values calculated in accordance with the ITU-R rec-
ommendation. It should be further analyzed why it is not so.
3.4. Conversion of annual statistics to
worst-month statistics
The obtained dependence of the percentage of time of the av-
erage year P
AY
on the percentage of time of the average worst
month P
AWM
for selected values of rain attenuation is drawn
in Figure 13. The dependence can be approximated for 1 dB
≤ A
rain
≤ 30 dB by the formula
P
AWM
= 3.79P
0.89
AY
(%) (1)
with a correlation coefficient r
= 0.9895.
It can be seen from Figure 13 that calculated percentages
of time of AWM in accordance with ITU-R recommendation
[8] are slightly lower than percentages of time corresponding
to linear approximation of measured values. The reason is
that ITU-R recommendation [8] presents slightly different
V. Kvicera and M. Grabner 7
10.10.010.001
Percentage of time of AY
0.01
0.1
1
10
Percentage of time of AWM
ITU-R
Measured
Approximation
Figure 13: Dependence of percentages of time of AWM on percent-
ages of time of AY.
formulas for the calculation of P
AWM
from P
AY
:
P
AWM
= 2.85P
0.87
AY
(%). (2)
4. CONCLUSIONS
Rain attenuation data obtained at 58 GHz for V polariza-
tions on an 850 m terrestrial path as wel l as rainfall inten-
sity data from rain gauge records were statistically processed
over five individual contiguous 1-year periods and over the
entire 5-year period of observation together. Cumulative dis-
tributions of average 1-minute rainfall intensities as well as
cumulative distributions of rain attenuation for individual-
year periods, individual worst months of 1-year periods, for
the average year and the average worst month were obtained.
Large year-to year variations of individual-year distribu-
tions were noted. Cumulative distributions of rain attenua-
tion for both the average year and the average worst month
obtained were compared with those calculated in accordance
with relevant ITU-R recommendation. Results obtained c an
be used as basis for the extension of ITU-R recommendation
[5] for frequencies over 40 GHz.
Cumulative distributions of rain attenuation obtained
were analyzed in detail on a year-to-year basis and were com-
pared with distributions corresponding to relevant ITU-R
recommendation. It may be seen clearly that the results ob-
tained f rom 1-year measurement only are not statistically re-
liable from the long-term point of view. Results of long-term
measurements only, that is, at least 3-year measurement, are
needed for the realistic assessment of availability of point-
to-point fixed systems. The conversion of cumulative distri-
butions of rainfall intensities into cumulative distributions
of rain attenuation should be further analyzed. The depen-
dence of average worst-month time percentages on average
year time percentages was examined and the result obtained
was compared with relevant ITU-R recommendation.
Our long-term experimental research will continue. Fur-
ther work will be focused on conversion of cumulative distri-
butions of rainfall intensities into cumulative distributions
of rain attenuation and on polarization dependence of rain
attenuation at 58 GHz.
ACKNOWLEDGMENTS
The work on recording and processing of both rainfall in-
tensity data and rain attenuation data was supported by the
Ministry of Informatics of the Czech Republic under the
Project no. MI0 0000346806 “Application of methods and
tools aimed at the development of communication infras-
tructure and services to information society in the Czech Re-
public.”
REFERENCES
[1] W.
˚
Asen and C. J. Gibbins, “A comparison of rain attenuation
and drop size distributions measured in Chilbolton and Singa-
pore,” Radio Science, vol. 37, no. 3, 2002.
[2] A. Kato, K. Sato, M. Fujise, and S. Kawakami, “Propaga-
tion characteristics of 60-GHz millimeter waves for ITS inter-
vehicle communications,” IEICE Transactions on Communica-
tions, vol. E84-B, no. 9, pp. 2530–2539, 2001.
[3] G. Timms, V. Kvicera, and M. Grabner, “60 GHz band propa-
gation experiments on terrestrial paths in Sydney and Praha,”
Radioengineering, vol. 14, no. 4, pp. 27–32, 2005.
[4] V. Kvicera, M. Grabner, and O. Fiser, “Results of 2-year concur-
rent measurements of attenuation at 58 GHz and rain intensi-
ties,” in Proceedings of the 11th Microcoll Conference, pp. 77–80,
Budapest, Hungary, September 2003.
[5] Rec. ITU-R P.530-11, “Propagation data and prediction meth-
ods required for the design of terrestrial line-of-sight systems,”
ITU-R Recommendations, September 2005.
[6] Rec. ITU-R P.676-6, “Attenuation by atmospheric gases,” ITU-R
Recommendations, September 2005.
[7] Rec. ITU-R P.837-4, “Characteristics of precipitation for propa-
gation modelling,” ITU-R Recommendations, September 2005.
[8] Rec. ITU-R P.841-4, “Conversion of annual statistics to worst-
month statistics,” ITU-R Recommendations, September 2005.