Báo cáo hóa học: " Research Article Design of Large Field-of-View High-Resolution Miniaturized Imaging System" potx
Bạn đang xem bản rút gọn của tài liệu. Xem và tải ngay bản đầy đủ của tài liệu tại đây (849.32 KB, 10 trang )
Hindawi Publishing Corporation
EURASIP Journal on Advances in Signal Processing
Volume 2007, Article ID 59546, 10 pages
doi:10.1155/2007/59546
Research Article
Design of Large Field-of-View High-Resolution
Miniaturized Imaging System
Nilesh A. Ahuja and N. K. Bose
Department of Electrical Engineering, Spatial and Temporal Signal Processing Center,
The Pennsylvania State University, University Park, PA 16802, USA
Received 29 September 2006; Revised 7 February 2007; Accepted 16 April 2007
Recommended by Russell C. Hardie
Steps are taken to design the optical system of lenslet array/photoreceptor array plexus on curved surfaces to achieve a large field
of view (FOV) with each lenslet capturing a portion of the scene. An optimal sampling rate in the image plane, as determined by
the pixel pitch, is found by the use of an information theoretic performance measure. Since this rate turns out to be sub-Nyquist,
superresolution techniques can be applied to the multiple low-resolution (LR) images captured on the photoreceptor array to
yield a single high-resolution (HR) image of an object of interest. Thus, the computational imaging system proposed is capable of
realizing both the specified resolution and specified FOV.
Copyright © 2007 N. A. Ahuja and N. K. Bose. This is an open access article distributed under the Creative Commons Attribution
License, which permits unrestricted use, distribution, and reproduction in any medium, provided the original work is properly
cited.
1. INTRODUCTION
Images captured by most modern image acquisition systems
require further processing in order to be useful. The over-
all imaging system can be therefore considered as a combi-
nation of an optical subsystem, which includes the optical
elements and the sensors, and a digital subsystem that com-
prises of the algorithms employed to perform the necessary
signal processing.
Traditionally, the design of the optical subsystem has
been separated from the design of the digital subsystem.
In recent years, however, there has been a thrust towards
an integrated approach for the design of the overall imag-
ing system. Such an approach has been successfully applied
to the design of high depth-of-field (DOF) systems. The
approach, suggested by Dowski and Cathey [1], involves
the use of optical phase masks to convert spatially variant
blur to spatially invariant blur. In another approach, sug-
gested by Adelson and Wang [2](andimproveduponby
Ng et al. [3]), a “plenoptic camera” (a “lightfield camera”),
comprising of a single large lens and an array of lenslets(small
lenses)/photoreceptors placed at the focal plane of the large
lens, is used to estimate the depth of the scene.
The integrated design of a large field-of-view (FOV)
imaging system is still an open problem. One of the chal-
lenges in the design of a large FOV imaging system is that
of maintaining the same image quality throughout the FOV.
Fisheye lenses provide a very large F OV; however, the cap-
tured image suffers from severe distortion which requires
subsequent correction [4]. Moreover, the resolution of the
captured image is not uniform throughout owing to off-axis
aberrations. Catadioptric omnidirectional cameras are capa-
ble of providing full 360
◦
field of view by using both lenses
and mirrors [4]. This, however, results in a system that is
bulky and costly. In this paper, therefore, a theoretical model
for a miniaturized high-resolution, large FOV imaging sys-
tem is presented and an approach to design such a system
is proposed. The proposed system comprises of an array of
lenslets arranged on a curved surface, with each lenslet cap-
turing an undersampled low-resolution (LR) image of a por-
tion of the scene. The multiple LR images captured thus are
registered onto a common grid and superresolution tech-
niques are used to obtain a single high-resolution (HR) im-
age. Since superresolution techniques have been well docu-
mented in signal processing literature [5–8], this paper will
focus on the design of the optical system. In Section 2 , the
factors influencing the design of miniaturized imaging sys-
tems are discussed. In Section 3, the specifications required
for the design of the imaging system are stated and the steps
involved in the design process are outlined. The rate at which
the radiance field is sampled by the photoreceptor array is de-
termined by the use of an information theoretic performance
2 EURASIP Journal on Advances in Signal Processing
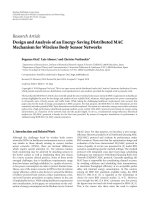
I II III
Figure 1: Compound eye configurations.
criterion, given in [9]. Conclusions and avenues for future re-
search are presented in Section 4.
It should be noted that manufacturability issues are not
addressed in this paper. Such issues present challenging prob-
lems with the cur rent state-of-the-art technology. The de-
sign presented will, hopefully, motivate engineers in industry
and government laboratories to address the manufacturabil-
ity problems, especially because, to the best of our knowl-
edge, alternate approaches to simultaneous realization of su-
perresolution and large FOV for computational imaging sys-
tems are nonexistent.
2. FACTORS INFLUENCING DESIGN
2.1. Miniaturized imaging systems
Figure 1 shows three possible configurations for miniatur-
ized imaging systems based on the compound eye of in-
sects. The use of configuration I was reported by Kitamura et
al. [10] and the use of configuration II was reported by Du-
parre et al. [11]. In configurations I and III, each lenslet is as-
sociated with multiple photoreceptors (pixels), while in con-
figuration II, only one pixel is associated with each lenslet.
Consequently, configurations I and III can employ superres-
olution techniques for resolution enhancement because of
the scope for forming multiple-shifted LR images of a fixed
subregioninobjectspace.Thisisnotpossibleinconfigu-
ration II in which only a single image is formed. The FOV
of the system in configuration I is the same as the FOV of
each of the lenslets. The systems in configurations II and
III, however, offer a FOV greater than that of the individual
lenslets used in them. This is achieved by making the pixel
pitch smaller than the pitch of the lenslets in configuration II
and by arranging the lenses and photoreceptors on suitable
curved surfaces in configuration III. The proposed configu-
ration III, therefore, offers the advantages of both large FOV
and resolution enhancement.
2.2. Effect of scaling on lenslet parameters
The effect of scaling on various lenslet properties was doc-
umented by Lohmann [12] and is summarized for a circu-
larly shaped lenslet in Table 1 .HereD is the diameter of the
lenslet, f is its focal length, and d is the pixel pitch in the im-
age plane. NA is the numerical aperture defined as D/2 f and
F is the f -number defined as f/D. The properties considered
here are the radius of the point spread function (PSF), the
FOV, sensitivity, aberrations and angular resolution of the
lenslet. Resolvable angular separation is the minimum angu-
lar separation required between two point sources in the ob-
ject space in order for them to be resolved in the captured im-
age. The expression for resolvable angular separation is jus-
tified in Section 3.1. Definitions and detailed explanations of
the other quantities can be found in any standard book on
optics [13, 14]. The following two factors highlight the limi-
tations of miniaturized imaging systems.
(1) The ability of the lenslet to resolve points in the object
space decreases with decreasing D. This is because the
resolvable angular separation, at a fixed wavelength, is
proportional to 1/D.
(2) The radius of the lenslet PSF roughly determines the
number of resolvable spots that can be produced in
the image plane. Decreasing D, while keeping F con-
stant, reduces the image area, but not the size of the
resolvable spots. As a result, the number of resolv-
able spots in the image decreases. To compensate for
this, the radius of the PSF should be reduced. From
Table 1, reducing the PSF radius entails the use of low
f -number optics which increases aberrations, as ex-
plained in Section 3.2.
These factors suggest that there is a practical limit to which
the size of each lenslet should be reduced.
2.3. Design assumptions
For simplicity of presentation, a number of simplifying but
reasonable assumptions made here are the following.
(1) For the sake of calculations, all the lenslets are assumed
to be circularly shaped, biconvex (plano-convex can
also be handled), symmetric, and identical in size and
optical characteristics.
(2) If a region in the object space is common to N noise-
free, undersampled and distinct LR frames, then the
resolution of that region can be improved by a fac-
tor of N by digital superresolution provided each LR
frame is undersampled by a factor of N.However,in
practice, the resolution enhancement obtainable will
be limited by noise and will be less than N, depend-
ing on the quality (peak signal-to-noise ratio (SNR))
of the LR frames.
(3) The same effective resolution should be obtained
throughout the FOV. Effective resolution refers to
the resolution obtainable after superresolution. This
requires the density of captured LR points to be
roughly the same throughout the FOV. Consequently,
N. A. Ahuja and N. K. Bose 3
Table 1: Effect of scaling on lenslet properties.
Parameter Expression Varying D ( f fixed) Varying D, f (NA fixed)
PSF radius 1.22 λf/D= 1.22 λF Increases with decreasing D Unchanged
FOV θtan
−1
(1/2F) Decreases with D Unchanged
Sensitivity
∝ (NA)
2
d
2
Decreases with D Unchanged
Aberrations — In general, decrease with D Scale linearly with size if NA is fixed
Resolvable angular separation
∝ λ/D Increases with decreasing D Depends on D only
2θ
FOV
2θ
ϕ
D
R
Z
Object
surface
θ
FOV
: FOV of system
θ :FOVoflens
θ
FOV
= Kϕ + θ
ϕ
= D/R
Figure 2: Structure of the large FOV imaging system using lenslets
on a curved surface.
the amount of overlap between the LR images of
neighboring lenslets should be the same throughout
the FOV. A simple way to ensure that this condition is
always met is to arrange the lenslets and the photore-
ceptors in a regular pattern on a spherical surface.
3. DESIGN STEPS
Figure 2 shows the structure of the large FOV imaging system
to be designed. The specifications are the following .
(1) Desired FOV θ
FOV
.
(2) Desired resolution Δz
at distance z.HereΔz
refers
to the closest spacing of points that can be resolved by
the system. Equivalently, the angular resolution, δθ
=
Δz
/z, can be specified.
(3) Mean radiance L
0
in the object plane required to deter-
mine the average signal strength as well as to calculate
the average noise power at the image sensor.
The object surface is assumed to be spherical, centered at
O, and of radius R + z. This ensures that the distance of the
object surface from any lenslet, along the axis of the lenslet,
is always z. Further, the set of photoreceptors (not shown in
Figure 2 to avoid clutter, but clearly indicated in Figure 1)for
each lenslet is assumed to lie in a plane perpendicular to the
axis of the lens and at a distance f from the optical center
of the lens. Thus, the image surface (photoreceptors) for the
entire system is also spherical and centered at O,butwith
aradiusofR
− f . With this arrangement, some of the light
captured by a particular lenslet would be focused on the pho-
toreceptors associated with an adjacent lenslet. In order to
prevent such crosstalk, an opaque wall could be constructed
between adjacent optical channels as has been done for the
case of lenslets arranged on a planar surface [10].
To desig n the system, the following parameter values
need to be determined.
(1) The diameter, D,and f -number, F,ofeachofthe
lenslets.
(2) Pixel pitch, d, assuming square-shaped pixels.
(3) The radius, R, of the surface on which the lenslets are
to be arranged.
(4) The number of lenslets, 2K + 1, assuming K lenses on
either side of the axis of the system, required to achieve
the specified FOV θ
FOV
.
Since the lenslets are small in size, the angular separation ϕ
between the axes of successive lenslets is given by
ϕ
≈
D
R
. (1)
The total (half-angle) FOV θ
FOV
is related to the (half-angle)
FOV θ of each lens by
θ
FOV
= Kϕ + θ. (2)
A systematic approach to arrive at appropriate values for
the parameters above is outlined next.
3.1. Resolution and lenslet diameter
Resolution of an optical system refers to its ability to dis-
tinguish between two closely spaced point sources in object
space. A real lens cannot distinguish between point sources
placed arbitrarily close to each other in the object space. As
the object points get closer, the contrast of their captured im-
ages keeps decreasing til l the two point sources are captured
as a single point in the image. The contrast of a signal refers
to the amount the signal varies about its mean value divided
by the mean value of the signal and is sometimes referred to
as the modulation depth [14, page 545]. It is a measure of
how discernible the fluctuations in the signal will be against
4 EURASIP Journal on Advances in Signal Processing
−1 −0.8 −0.6 −0.4 −0.200.20.40.60.81
Spatial frequency f
x
,normalizedto1/λ F
0
0.1
0.2
0.3
0.4
0.5
0.6
0.7
0.8
0.9
1
MTF
Figure 3: Diffraction limited OTF of circular lens for incoherent
light.
the dc background. In order to resolve finely spaced features
in the object space, the contrast in their captured image must
be high. Any measure of resolution, therefore, must necessar-
ily include contrast.
The resolution of a lenslet is typically characterized by its
response to different s patial frequencies. The relevant analy-
sis is presented next for the 1D case, but can be generalized
to 2D to yield similar results.
The pupil function of a diffraction-limited lenslet (no
optical aberrations) of diameter D,is[15, page 102]:
P(x)
=
⎧
⎪
⎨
⎪
⎩
1; |x|≤
D
2
,
0; otherwise.
(3)
The PSF of the lenslet for coherent light, denoted by b(x),
and its Fourier transform (FT), B( f
x
), are given by [15,page
130]
b(x)
=
1
λz
i
∞
−∞
P(u)exp
−
j
2πux
λz
i
du,(4)
where z
i
is the image distance at the photoreceptor array
from the corresponding lenslet and
B
f
x
= P
λz
i
f
x
. (5)
For incoherent light, the PSF is given by b(x)
=|b(x)|
2
.
The optical transfer function (OTF), B( f
x
), is the normal-
ized Fourier transform (FT) of
|b(x)|
2
and is given by [15,
page 139]
B
f
x
=
∞
−∞
B(v)B
∗
v − f
x
dv
∞
−∞
B(v)
2
dv
=
∞
−∞
P(v)P
∗
v − λz
i
f
x
dv
∞
−∞
P(v)
2
dv
.
(6)
The magnitude of the OTF, which is called the MTF, is the ra-
tio of image contrast to object contrast as a function of spatial
frequency, or equivalently, the ratio of image-to-object mod-
ulation depths. For a circularly shaped, diffraction-limited
lenslet, the MTF is as shown in Figure 3 [15]. From the fig-
ure, it is observed that the MTF always reduces contrast. Also,
the MTF is band limited to 1/λF.
To characterize the resolution of the lenslet, we consider
a periodic array of point sources of equal strength at a dis-
tance z from the lenslet. If the spacing between successive
sources is Δz, then the fundamental frequency of the input
signal is 1/Δz. Magnification M is given by M
= z
i
/z ≈ f/z.
The fundamental frequency of the image of the point sources
is, therefore,
f
x
=
z
( f Δz)
. (7)
By examining the Fourier series coefficients of the sources,
it is easy to see that the contrast of the sources at the fun-
damental frequency is 100%. Therefore, the contrast in their
images, at the fundamental frequency, is the MTF value at the
frequency. The sources are considered to be resolved if this
value is higher than some chosen values C (0 <C<1). If the
contrast is 50%, (corresponding to C
= 1/2), then the range
of frequencies for which the MTF B >Cis (from Figure 3)
f
x
<f
res
=
0.4
λF
. (8)
Using (7)in(8) and simplifying gives
Δz>
2.5λz
D
. (9)
Thus, the minimum resolvable angular separation in object
space is
δθ
=
Δz
z
=
2.5λ
D
. (10)
The smallest value of D that meets the desired specifications
is chosen. Note that a choice of C
= 0.09 (corresponding to
a contrast of 9%), would yield Δz
= 1.22λz/D,whichcorre-
sponds to the resolution that would have been obtained by
using the Rayleigh criterion [14, page 463].
As an example, suppose that the desired resolution is
5 cm at a distance of 50 m. Then, δθ
= 1 mrad (milliradian)
and the corresponding value of D,from(10), is 1.25 mm.
3.2. Optical aberrations and f -number
The analysis in the preceding section assumed that the optical
system was diffraction limited and free from optical aberra-
tions. In pr actice, lenses can suffer from a variety of optical
aberrations. These depend on the diameter, D, of the lens,
its f -number, F, and the shape of its surfaces. The value of
D to be used for the lenslets is already fixed from the pre-
vious subsection. Also, as stated in the first assumption in
Section 2.3, the lenses are assumed to be symmetric and bi-
convex with perfectly spherical surfaces (however, the proce-
dure presented here can be easily extended to lenses of differ-
ent shapes). Consequently, it only remains to choose a suit-
able value of F that keeps degradation owing to aberrations
N. A. Ahuja and N. K. Bose 5
h
D
0
Optical
system
P
0
P
1
O
1
W
S
P
1
P
∗
1
Object
plane
Entrance
pupil
Exit
pupil
Image
plane
P
0
: object point
P
∗
1
: Gaussian image point
S :idealsphericalwavefront
W :actualwavefront
Figure 4: Setup for calculating optical aberrations.
negligible. For this, it is desired to investigate the effects of
optical aberrations on the OTF of the lens. In the aberra-
tion free case, the OTF for incoherent light is related to the
pupil function, P(x), by (6). In the presence of aberrations,
the pupil function is modified to be [15]
P (x)
= P(x)e
jkΦ(x)
, (11)
where k
= 2π/λ and Φ(x) is known as the wave aberration
function. P (x) is referred to as the generalized pupil function
[15].
A geometric optics-based explanation of the quantity
Φ(x)isprovidedin[13] and is presented here briefly for
clarity. Consider a rotationally symmetrical optical system
as shown in Figure 4.LetP
0
be an object point and P
∗
1
its
Gaussian image. D
0
is the distance of the object plane f rom
the entrance pupil. P
1
and P
1
are the points at which a ray
from P
0
intersect the plane of the exit pupil and the Gaussian
image plane, respectively. Let W be the wavefront through
the center O
1
of the exit pupil associated with the rays that
reach the image space from P
0
. In the absence of aberra-
tions, W coincides with a spherical wavefront S which passes
through O
1
and is centered on P
∗
1
. The wave aberration func-
tion, Φ,atP
1
is the optical path length (refractive index of
the medium times the geometric length) between S and W
along the ray P
1
P
1
.LetP
0
and P
1
in Figure 4 be represented
in polar coordinates by, respectively, (h cos β
0
, h sin β
0
)and
(r cos β, r sin β). It is shown in [ 13 ] that Φ can be expanded
as a polynomial containing terms involving only h
2
, r
2
and
hr cos(β
− β
0
) of even total order (order o f h +orderofr)
greater than 2 [13, Chapter 5]. The fourth-order terms con-
stitute what are known as the primary aberrations;higher-
order terms are usually ignored as these do not have a sig-
nificant effect on the OTF. The five primary aberrations are
spherical aberration, astigmatism, field curvature, distortion,
and coma. Expressions for these terms have been derived in
[13] for a general centered optical system. These expressions
show that the lowering of the f -number of the lens results in
an increase in the effects of primary aberrations. Having de-
termined Φ(x), P (x) can be calculated from (11). The OTF,
−1 −0.8 −0.6 −0.4 −0.200.20.40.60.81
Spatial frequency f
x
,normalizedto1/λ F
0
0.1
0.2
0.3
0.4
0.5
0.6
0.7
0.8
0.9
1
MTF
F = 8
F
= 4
Figure 5: Plot of MTF with primary aberrations for different values
of f -number.
and hence the MTF, is then evaluated by replacing P(v)by
P (v)in(6). It can be show n that the presence of optical
aberrations always lowers the MTF value from its diffraction-
limited value without aberrations [15,Chapter6].Thus,F
should be selected such that the MTF with aberrations is not
significantly deg raded as compared to the diffraction-limited
MTF. The smallest value of F that causes the MTF at f
res
to
drop by some chosen value, e
1
, is found.
Figure 5 shows the MTF curves obtained for two differ -
ent values of F. The choice of F
= 8isseentoresultinaMTF
plot which is closer to the diffraction-limited plot in Figure 3.
This choice of F causes the MTF value at f
res
= 0.4/λF
to drop by only 2% from the diffract ion limited case (in
Figure 3). Substituting D
= 1.25 mm (from the previous sub-
section), and F
= 8inF = f/Dgives f = 10 mm. Also, using
F
= 8inθ = tan
−1
(1/2F) (from Tab le 1) gives the FOV of
each lenslet as θ
= 0.0625 rad = 3.58
◦
.
3.3. Pixel pitch
Theimageformedbyalensissampledintheimageplaneby
the pixels. The pixel pitch, d, determines the sampling rate in
the image plane. Each pixel measures the average light flux
incident over its area. This causes additional blurring over
and above that caused by the PSF of the lens. However, not
all of the pixel area is available for light gathering. The ratio of
the active pixel area to the total pixel area is referred to as the
fill factor γ,0<γ<1[16]. Larger the value of γ, greater the
blur caused by the pixel. For the following discussion, γ
≈ 1
is assumed.
Since the OTF of the lenslet is bandlimited to 1/λF,itis
possible to avoid aliasing completely by choosing d<0.5λF.
This is the Nyquist sampling criterion. However, for a given
fill factor, a smaller pixel pitch also implies that the area avail-
able to capture photons is smaller, and hence fewer photons
6 EURASIP Journal on Advances in Signal Processing
per pixel are captured for the same ir radiance. It is known
that the number of photons collected by a pixel is a Pois-
son random variable having standard deviation equal to the
square root of the mean number of photons captured per
pixel [17, page 74]. Thus, for a photon-noise limited imag-
ing system, SNR increases proportionally to the square root
of the area. Thus, the choice of d involves a tradeoff between
aliasing and SNR. In practice, the captured signal may be cor-
rupted by additional sources of noise such as thermal reset
noise, fixed pattern noise (FPN), and flicker noise [18,and
references therein]. However, by use of techniques such as
correlated double sampling (CDS) [18], it is possible to sig-
nificantly reduce or even eliminate these sources of noise. In
the subsequent analysis, therefore, only shot noise (photon-
limited noise) will be considered.
It is desirable to choose a pixel size that will achieve
the optimal tradeoff between the conflicting requirements
of SNR and aliasing. The optimality criterion used here is
based on an information theoretic metric. The definition of
the metric and an expression for it, given in [9], is presented
next.
Consider a planar object placed at a large distance z
0
from a lenslet. Since z
o
is large, z
i
≈ f holds, where z
i
is
the image distance. For the purpose of calculation, it is rea-
sonable to treat each point on the object plane as an inde-
pendent Lambertian source. Under this assumption, the ra-
diance, L
0
(x
0
, y
0
), at a point P
0
(x
0
, y
0
) in the object plane
depends only on its coordinates and not on the direction
from which the point is viewed. The radiance fi eld, L(x, y),
in the image plane is a spatially scaled version of the radiance
field in the object plane and is given by
L(x, y)
= L
0
x
0
, y
0
, where, x =
fx
0
z
0
, y =
fy
0
z
0
. (12)
Let the combined PSF of the lenslet and photodetector be
denoted by h(x, y). The incident field, L(x, y), is blurred by
h(x, y). This blurred field is then sampled at the pixel lo-
cations (kd, ld) and corrupted by the photodetector noise
n[k, l] to give the captured signal s[k, l]. This process can be
represented by
s[k, l]
= Kg[k, l]+n[k, l], (13)
where g(x, y)
= L(x, y) ∗ h(x, y), g[k, l] = g(kd, ld), and K
is the steady state gain of the linear radiance to signal conver-
sion. In this paper, both s[k, l]andn[k, l]willbemeasured
in terms of number of photoelectrons. The mutual infor-
mation between the sampled signal, s[k, l], and the radiance
field L(x, y)isdefinedas
I(s, L)
= H(s) − H(s | L), (14)
where H(s) is the entropy of s[k, l]andH(s | L) is the entropy
of s[k, l]givenL(x, y). L(x, y) is modeled as a wide-sense sta-
tionary ( WSS) stochastic process having power spectral den-
sity (PSD) S
L
(Ω
1
, Ω
2
). Then, the PSD, S
g
(Ω
1
, Ω
2
), of g(x, y)
is given by
S
g
Ω
1
, Ω
2
= S
L
Ω
1
, Ω
2
H
Ω
1
, Ω
2
2
, (15)
where
H(Ω
1
, Ω
2
) is the Fourier transform (FT) of h(x, y).
Since g[k, l] is obtained by sampling g( x, y), the PSD,
S
g
(ω
1
, ω
2
), of g[k, l] is related to S
g
(Ω
1
, Ω
2
)by
S
g
ω
1
, ω
2
=
1
d
2
k
1
, k
2
S
g
Ω
1
−
2πk
1
d
, Ω
2
−
2πk
2
d
Ω
1
=ω
1
/d, Ω
2
=ω
2
/d
=
1
d
2
k
1
, k
2
S
g
ω
1
d
−
2πk
1
d
,
ω
2
d
−
2πk
2
d
.
(16)
Define
S
(sig)
g
ω
1
, ω
2
=
1
d
2
S
g
ω
1
d
,
ω
2
d
,
S
(alias)
g
ω
1
, ω
2
=
1
d
2
k
1
, k
2
|(k
1
,k
2
)=(0,0)
S
g
ω
1
d
−
2πk
1
d
,
ω
2
d
−
2πk
2
d
.
(17)
Then, it is stated in [9] that I(s, L)in(14)isgivenby
I
=
1
2
B
log
1+
K
2
S
(sig)
g
ω
1
, ω
2
K
2
S
(alias)
g
ω
1
, ω
2
+
S
n
ω
1
, ω
2
dω
1
dω
2
,
(18)
where,
B =
ω
1
, ω
2
:
ω
1
≤
π,
ω
2
≤
π
(19)
and
S
n
(ω
1
, ω
2
) is the PSD of the discrete-domain noise
n[k, l]. It remains to determine the expressions for various
quantities required in the calculation of I(s, L)in(18). These
include the gain, K, the PSF, h(x, y), and the statistics of both
the signal, L(x, y), and the noise n[k, l].
We start by assuming that L(x, y) has mean L
0
and co-
variance K
L
(x, y) = σ
2
L
e
−r/μ
,wherer =
x
2
+ y
2
and μ is
the mean spatial detail of the radiance field [9]. μ can be
taken to be (δθ) f ,whereδθ is the resolvable angular sepa-
ration in (10)and f is the focal length of the lenslet. The
PSD, S
L
(Ω
1
, Ω
2
), is then given by
S
L
Ω
1
, Ω
2
=
2πμ
2
σ
2
L
1+(2πμρ)
2
3/2
, (20)
where ρ
=
Ω
2
1
+ Ω
2
2
. The radiance of the source is converted
to irradiance E(x, y) in the image plane and the two quanti-
ties are related by [19]
E(x, y)
=
πL(x, y)
1+(2F)
2
. (21)
The resulting irradiance is blurred by the PSF, b(x, y), of the
lens for incoherent light and integrated over the area of a sin-
gle pixel to give the total optical power, φ(x, y), incident at
the pixel. Integration over the pixel area can be modeled as
convolution w ith the function
a(x, y)
=
⎧
⎪
⎨
⎪
⎩
1
d
2
; |x|, |y|≤
d
2
,
0; otherwise
(22)
N. A. Ahuja and N. K. Bose 7
along with multiplication by the pixel area d
2
.Thus,
φ(x, y)
= d
2
E(x, y) ∗ b(x, y) ∗ a(x, y)
=
πd
2
1+4F
2
L(x, y) ∗ h(x, y)
=
πd
2
1+4F
2
g(x, y),
(23)
where h(x, y)
= b(x, y) ∗ a(x, y) is the combined PSF of the
lenslet and the pixel. The spatial frequency response of the
system is, therefore,
H
Ω
1
, Ω
2
=
B
Ω
1
, Ω
2
A
Ω
1
, Ω
2
, (24)
where B(Ω
1
, Ω
2
) is the OTF of the lenslet as given by (6), and
A(Ω
1
, Ω
2
) = sinc(Ω
1
d/2π)sinc(Ω
1
d/2π) is the FT of a(x, y).
Assuming that the light source is a monochromatic
source of wavelength λ, the mean number of photons inci-
dent at the pixel location [k, l] per second is given by
E
N
ph
[k, l]
n
ph
[k, l] =
φ[k, l]
(hc/λ)
, (25)
where E
{·} is the expec tation operator, h is Planck’s constant,
c is the speed of light in v acuum, and the number, N
ph
[k, l],
of photons is a discrete Poisson random variable [17,page
74].Themean,E
{N
pe
[k, l]}, of the number, N
pe
[k, l], of elec-
trons generated in response to this input flux in a time inter-
val t
int
, is, therefore, given by
E
N
pe
[k, l]
n
pe
[k, l]
= n
ph
[k, l]t
int
Q(λ) =
λπt
int
Q(λ)d
2
hc
1+4F
2
g[k, l],
(26)
where Q(λ) is the quantum efficiency of the pixel material
[17]. The gain K is, therefore, given by
K
=
λπt
int
Q(λ)d
2
hc
1+4F
2
. (27)
Since the number of photons collected at the pixel location
(kd, ld) is actually a discrete Poisson random variable, its
mean and variance are equal [20, page 108] and given by
(25). The number of photoelectrons generated in response
to this in a time interval t
int
, is, therefore, also a Poisson ran-
dom variable [17], whose mean and variance are each equal
to n
pe
[k, l]. The variance of this random variable constitutes
the shot noise power. Thus, strictly speaking, the shot noise
in each pixel depends on the signal strength at that pixel.
However,thisdependenceiscomplex.Itisusuallyacceptable
to consider the noise to be uncorrelated with the signal and
the noise power in all pixels to be equal to n
(0)
pe
, the noise gen-
erated by the average value, L
0
, of the illumination. Replac-
ing L(x, y)byL
0
in (21) and following the same reasoning
leads to n
(0)
pe
= KL
0
H(0, 0). From (24), it is easy to see that
Table 2: Constants and parameter values used in design process.
Parameter Symbol Value
Wavelengt h λ 500 e-9 m
Object radiance L
0
18 W/m
2
-sr
Quantum efficiency Q(λ)0.3
Refractive index η 1.6
Integration time t
int
10 e-3 s
H(0, 0) = 1. Since the noise is assumed to be white, we have
S
n
ω
1
, ω
2
=
n
(0)
pe
= KL
0
. (28)
This gives the expressions for all the quantities needed to
calculate I(s, L)in(18). Typical values of some of the param-
eters involved in this calculation are given in Table 2.Anap-
proximate conversion from photometric to radiometric units
suffices for our purpose. The choice of some of the parameter
values presented above is justified next.
(1) The lighting condition of the input scene was assumed
to be that present on an overcast day. The typical value
of luminance of an overcast sky is 2000 cd/m
2
(can-
dela per meter squared) [19, page 40] and the lumi-
nous efficacy is in the range of 103–115 lm/W (lumen
per Watt)[19, page 42]. Using a value of 110 lm/W for
luminous efficacy gives L
0
= 2000/110 ≈ 18 W/m
2
-sr.
Also, assuming that the scene has good contrast, it is
reasonable to choose σ
l
= 6 (approximately 1/3 rd the
mean value L
0
).
(2) A quantum efficiency value of 0.3 is typical for pixels
sensing light in the visible range [16].
To determine the optimal value of d, I(s, L) is calculated
for various values of d and the resulting curve is plotted in
Figure 6.AvalueofF
= 8, as determined from the previous
section, is used to obtain this plot. For this value of F, the
optical bandwidth is 1/λF
= 2.5 × 10
5
cycles/m. The Nyquist
sampling interval is therefore given by 0.5 λF
= 2 μm. In the
plot shown in Figure 6, d is var ied from 2 μm(Nyquistsam-
pling) to 8 μm (undersampling by a factor of 4). The curve
shows a maximum at d
= 3.6 μm indicating the tradeoff be-
tween aliasing and SNR. Also note that choosing d
= 3.6 μm
implies undersampling by a factor of 3.6/2
= 1.8, leaving
scope for enhancement of resolution by digital superresolu-
tion. Note that this resolution enhancement is achieved by
the recovery of frequency components lost due to aliasing.
The value of the fill factor γ (0 <γ<1) determines the
blur/SNR tradeoff. Specifically, a large γ gives better SNR at
the expense of increased blur, while a small γ gives poor SNR
but less blur. To counter the degr adations caused by pixel fill
factor and lens PSF, additional filtering operations could be
performed. From the second assumption in Section 2.3,we
conclude that each point in the object space should be cap-
tured in 1.8 LR frames in order to attain resolution up to the
diffraction limit. Hence, N
= 2 is chosen, since the number
of images should be an integer value.
8 EURASIP Journal on Advances in Signal Processing
2345678
d (μm)
2.5
3
3.5
4
4.5
5
5.5
I(s, L)
Figure 6: Plot of I(s, L) against pixel pitch d.
O
α
θ
RZ
Object surface
Center of lens
Figure 7: Field of view of single lenslet.
3.4. Resolution enhancement factor and radius of
curved surface
Figure 7 shows a single lenslet placed on a spherical surface
of radius R centered at O. The object surface is also spheri-
cal and centered at O,buthasaradiusofR + z,wherez is
the object distance. A particular lenslet captures the image of
a limited region in the object space, the extent of the region
being determined by its FOV, θ. Suppose that this region sub-
tends an angle 2α at O. The number of LR images in which a
point in the object space is captured depends on both ϕ (de-
fined in (1)) and α. For each point to be captured N times, it
is required that
ϕ
=
2α
N
. (29)
From (1)and(29), we get
D
R
=
2α
N
. (30)
Also, from the geometry of Figure 7, it can be shown, after
some calculations, that
sin α
=
tan θ
R sec
2
θ
−
R +
R
2
+
z
2
+2zR
sec
2
θ
. (31)
Equations (30)and(31) can be solved simultaneously for
both α and R using either numerical or graphical techniques.
Once R is known, ϕ can be determined from (1). Use of this
in (2) allows one to determine K and hence the total number
of lenslets required to achie ve the desired field of view.
Substituting D
= 1.25 mm (from Section 3.1), θ = 3.58
◦
(from Section 3.2), and N = 2in(30)and(31) and solving
gives R
= 2cm.Henceϕ ≈ D/R = 0.0625 rad = 3.58
◦
. Using
this and θ
FOV
= 90
◦
(for a total FOV of 180
◦
)in(2)gives
K
= 25. This completes the design of the high FOV optical
system.
4. CONCLUSIONS AND FUTURE WORK
A systematic procedure for the design of a miniaturized
imaging system with specified field of view and specified res-
olution has been presented here. Large FOV is obtained by
arranging a lenslets on a curved surface. An optimal value of
the pixel pitch in the image plane is determined by consid-
ering the mutual information between the incident radiance
field and the image captured by each lenslet. This value turns
out to be larger than that required for Nyquist sampling; con-
sequently, superresolution techniques [5–8]canbeusedto
compensate for this lower resolution due to aliasing and ob-
tain resolution up to the diffraction limit of the optics.
The design procedure presented here seeks to maximize
the mutual information, I(L, X
i
), i = 1, , n, between the
radiance field L and each of the captured LR frames X
i
,
i
= 1, , n, independent of the subsequent processing per-
formedontheLRframes.However,togetatrulyend-to-end
optimized imaging system, the mutual information between
the radiance field L and the HR image, Y,formedaftersu-
perresolution should be considered. The distinction between
this and the approach presented in this paper is shown in
Figure 8. Such analysis is considerably more complicated and
is being explored as part of future work.
Finally, a number of generalizations can be made to the
design approach suggested here. These include
(i) hexagonal arrangement of lenslets on the curved sur-
face and of pixels in the image plane to achieve greater
packing density;
(ii) carrying out the SNR and aberration analysis for poly-
chromatic light instead of monochromatic light;
(iii) exploring the utility of the system to realize superreso-
lution in 3D imaging.
Although the above generalizations will complicate the cal-
culations involved in the design, it is expected that the same
design principles and s teps can be used.
N. A. Ahuja and N. K. Bose 9
L
X
2
X
n
.
.
.
Superresolution
deblurring,
etc.
X
1
Y
Captured
LR frames
Incident
radiance
Maximize
I(L, X
i
)
i
= 1, , n
Current design procedure
(a)
L
X
2
X
n
.
.
.
Superresolution
deblurring,
etc.
X
1
Y
Captured
LR frames
Incident
radiance
Maximize
I(L, Y)
Future work
(b)
Figure 8: Extending the proposed design procedure.
ACKNOWLEDGMENTS
The authors thank the three reviewers for their very con-
structivecomments.Theresearchreportedherewascon-
ducted under the sponsorship of the National Science Foun-
dation Grant CCF-0429481.
REFERENCES
[1] E. R. Dowski Jr. and W. T. Cathey, “Extended depth of field
through wave-front coding,” Applied Optics, vol. 34, no. 11,
pp. 1859–1866, 1995.
[2]E.H.AdelsonandJ.Y.A.Wang,“Singlelensstereowitha
plenoptic camera,” IEEE Transactions on Pattern Analysis and
Machine Intelligence, vol. 14, no. 2, pp. 99–106, 1992.
[3] R. Ng, M. Levoy, M. Br
´
edif, G. Duval, M. Horowitz, and
P. Hanrahan, “Light field photography with a hand-held
plenoptic camera,” Tech. Rep. CTSR 2005-02, Stanford Uni-
versity, Stanford, Calif, USA, 2005, nford
.edu/papers/lfcamera/lfcamera-150dpi.pdf.
[4] S. K. Nayar, “Catadioptric omnidirectional camera,” in Pro-
ceedings of the IEEE Computer Society Conference on Computer
Vision and Pattern Recognition, pp. 482–488, San Juan, Puerto
Rico, USA, June 1997.
[5] M. G. Kang and S. Chaudhuri, Eds., “Super-resolution im-
age reconstruction,” IEEE Signal Processing Magazine, vol. 20,
no. 3, pp. 19–20, 2003.
[6] N. K. Bose and N. A. Ahuja, “Superresolution and noise filter-
ing using moving least squares,” IEEE Transactions on Image
Processing, vol. 15, no. 8, pp. 2239–2248, 2006.
[7] N. K. Bose, R. H. Chan, and M. K. Ng, Eds., “High-resolution
image reconstruction—I,” International Journal of Imaging
Systems and Technology, vol. 14, no. 2, pp. 35–89, 2004.
[8] N. K. Bose, R. H. Chan, and M. K. Ng, Eds., “High-resolution
image reconstruction—II,” International Journal of Imaging
Systems and Technology, vol. 14, no. 3, pp. 91–145, 2004.
[9] F. O. Huck, C. L. Fales, R. Alter-Gartenberg, S. K. Park, and
Z. Rahman, “Information-theoretic assessment of sampled
imaging systems,” Optical Engineering, vol. 38, no. 5, pp. 742–
762, 1999.
[10] Y. Kitamura, R. Shogenji, K. Yamada, et al., “Reconstruction of
a high-resolution image on a compound-eye image-capturing
system,” Applied Optics, vol. 43, no. 8, pp. 1719–1727, 2004.
[11] J. Duparr
´
e, P. Dannberg, P. Schreiber, A. Br
¨
auer, and A.
T
¨
unnermann, “Artificial apposition compound eye fabricated
by micro-optics technology,” Applied Optics, vol. 43, no. 22,
pp. 4303–4310, 2004.
[12] A. W. Lohmann, “Scaling laws for lens systems,” Applied Op-
tics, vol. 28, no. 23, pp. 4996–4998, 1989.
[13] M. Born and E. Wolf, Principles of Optics: Electromagnetic The-
ory of Propogation, Interference and Diffraction of Light,Perga-
mon Press, Oxford, UK, 1980.
[14] E. Hecht, Optics, Addison Wesley, New York, NY, USA, 1998.
[15] J. W. Goodman, Introduction to Fourier Optics, McGraw-Hill,
New York, NY, USA, 2nd edition, 1996.
[16] E. R. Fossum, “Digital camera system on a chip,” IEEE Micro,
vol. 18, no. 3, pp. 8–15, 1998.
[17] J. Nakamura, “Basics of image sensors,” in Image Sensors and
Signal Processing for Digital Still Cameras, J. Nakamura, Ed.,
pp. 53–64, Taylor and Francis, London, UK, 2006.
[18] A. El Gamal and H. Eltoukhy, “CMOS image sensors,” IEEE
Circuits and Devices Magazine, vol. 21, no. 3, pp. 6–20, 2005.
[19] R. McCluney, Introduction to Radiometry and Photometry ,
Artech House, Boston, Mass, USA, 1994.
[20] A. Papoulis, Probability, Random Variables and Stochastic Pro-
cesses, McGraw-Hill, New York, NY, USA, 3rd edition, 1991.
Nilesh A. Ahuja received the B.E. degree in
electronics engineering from V.J.T.I, Mum-
bai University, Mumbai, India in 2001.
From 2001 to 2003, he served as an I.C. De-
sign Engineer in Texas Instruments, Banga-
lore, India. In 2005, he received the M.S.
degree in electrical engineering from the
Pennsylvania State University, where he is
currently a Ph.D. candidate in electrical en-
gineering.
N. K. Bose is the HRB-Systems Professor of
electrical engineering at The Pennsylvania
State University at University Park. He is,
since 1990, the founding Editor-in-Chief of
the International Journal on Multidimen-
sional Systems and Signal Processing and
has served on the editorial boards of several
other journals. He served as either a regu-
lar or visiting faculty for extended periods at
10 EURASIP Journal on Advances in Signal Processing
several institutions, including the American University of Beirut,
Lebanon, the University of Maryland, College Park, the University
of California at Berkeley, Ruhr University (Germany), and Prince-
ton University, Princeton. He was also invited for long-term visits
to LAAS at Toulouse, France, the Centre for Artificial Intelligence
and Robotics in Bangalore, India, Tokyo Institute of Technology
(1999–2000), and Akita Prefectural University in Japan (2005) to
conduct research and give seminars. Professor Bose received sev-
eral honors and awards, including, more recently, the Invitational
Fellowship from the Japan Society for the Promotion of Science in
1999, the Alexander von Humboldt Research Award from Germany
in 2000, and the Charles H. Fetter University Endowed Fellowship
from 2001–2004. He is the author of several textbooks in multidi-
mensional systems theory, digital filters, and artificial neural net-
works.