Báo cáo hóa học: " Research Article Perceptual Image Representation" potx
Bạn đang xem bản rút gọn của tài liệu. Xem và tải ngay bản đầy đủ của tài liệu tại đây (7.93 MB, 9 trang )
Hindawi Publishing Corporation
EURASIP Journal on Image and Video Processing
Volume 2007, Article ID 98181, 9 pages
doi:10.1155/2007/98181
Research Article
Perceptual Image Representation
Matei Mancas,
1
Bernard Gosselin,
1
and Beno
ˆ
ıt Macq
2
1
Th
´
eorie des Circuits et Traitement du Signal (TCTS) Lab, Facult
´
e Polytechnique de Mons, 7000 Mons, Belgium
2
Laboratoire de T
´
el
´
ecommunications et T
´
el
´
ed
´
etection (TELE), Universit
´
e Catholique de Louvain, 1348 Louvain-la-Neuve, Belgium
Received 1 August 2006; Revised 8 March 2007; Accepted 2 July 2007
Recommended by Ling Guan
This paper describes a rarity-based visual attention model working on both still images and video sequences. Applications of this
kind of models are numerous and we focus on a perceptual image representation which enhances the perceptually important areas
and uses lower resolution for perceptually less important regions. Our aim is to provide an approximation of human perception
by visualizing its gradual discovery of the visual environment. Comparisons with classical methods for visual attention show that
the proposed algorithm is well adapted to anisotropic filtering purposes. Moreover, it has a high ability to preserve perceptually
important areas as defects or abnormalities from an important loss of information. High accuracy on low-contrast defects and
scalable real-time video compression may be some practical applications of the proposed image representation.
Copyright © 2007 Matei Mancas et al. This is an open access article distributed under the Creative Commons Attribution License,
which permits unrestricted use, distribution, and reproduction in any medium, provided the original work is properly cited.
1. INTRODUCTION
The human visual system (HVS) is a topic of increasing im-
portance in computer vision research since Hubel’s work [1]
and the comprehension of the basics of biological vision.
Mimicking some of the processes done by our visual system
may help to improve the current computer vision systems.
Visual attention is part of a major task of the HVS, which
is to extract relevant features from visual scenes in order to
react in a relevant manner for our survival.
Several anisotropic filtering techniques are available for
still images. These algorithms aim at preserving edges (con-
sidered as perceptually valuable) while they lowpass filter
the rest of the image. These techniques are widely used
in advanced image enhancement and sometimes in pre-
processing of some segmentation steps for example. How-
ever, several visual attention (VA) models showed that edges
were not the only areas in an image which are perceptually
important. We propose here a novel and computationally ef-
ficient approach of visual attention for anisotropic filtering
in both still images and video sequences. This global rarity-
based approach better handles spatial and temporal texture
and it performs accurate detection of low-contrast defects.
The general idea of our visual attention model is de-
scribed in the next section. Sections 3 and 4 provide an adap-
tation of the rarity-based attention idea to still images and
video sequences. Section 5 deals with an application of the
proposed model to anisotropic filtering of both still images
and videos. Finally, the last section will conclude the work
and discuss our approach.
2. VISUAL ATTENTION
Treisman and Gelade [2] demonstrated that visual attention
in still images can be divided into two distinct steps. The first
one is a preattentive “parallel,” unconscious, and fast pro-
cess. The second one is an attentive conscious saccade-based
image analysis which is a “serial” and slower process. Preat-
tentive visual attention occurs faster than 200 milliseconds
after viewing an image in the case of humans. For video se-
quences, preattentive vision seems to be more complex. Each
new frame could be considered as a novel image, or the first
200 milliseconds of the video sequence should only be con-
sidered. Nevertheless in this latter case, what does the begin-
ning of a video sequence mean in real life? If preattentive vi-
sion is an unconscious reflex which adapts itself to a time-
evolving saliency map, it could be applied for each new fix-
ation computation. This preattentive vision should compete
in this case with higher-level feedback coming with the image
understanding process: more an image makes sense, more
the high-level feedback is important and vision becomes at-
tentive. In the particular case of novel (never seen before) still
images, there is no information for the first fixation, there-
fore the high-level feedback may be very low and the fixation
preattentive; but in real life, the visual consciousness level
2 EURASIP Journal on Image and Video Processing
depends on the degree of understanding of the environment
from previous fixations.
As the definition of preattentive vision is unclear in real-
life vision, we will use the term of low-level vision which
highlights pop-out regions in a parallel way without com-
paring regions in the image. In this article, we will address
this reflex low-level vision.
2.1. Biological background
The superior colliculus (SC) is the brain structure which di-
rectly communicates with the eye motor command in charge
of eye orientation. One of its tasks is to direct the eyes onto
the “important” areas of the surrounding space. Studying the
SC afferent and efferent paths can provide important clues
about how biological systems classify scenes as interesting or
not in a preattentive way.
There are two afferent pathways for the SC, one direct
path from the retina and one indirect path crossing the lat-
eral geniculate nucleus (LGN) and the primary cortex area
V1 before coming back to the SC. There are also two efferent
paths, one to the eye motor area of course, and the other one
to the LGN. Studies on afferent SC pathways [3] showed that
the direct path from the retina is responsible of spatial (W
cells) and temporal (Y cells) analysis and the indirect path-
way is mainly responsible of spatial and motion direction
and certainly colour analysis. Both paths may be related to
preattentive reflex attention but the indirect path also brings
higher-level decisions responsible for attentive vision.
2.2. Attention modelling
Many methods may be found in the literature about visual at-
tention and image saliency. Some of them attempt to mimic
the biological knowledge as Itti and Koch’s (I&K) method
[4]. They define a multiresolution- and multifeature-based
system which models the visual search in primates. Le Meur
et al. [5] suggested a global architecture close to I&K, but us-
ing a smart combination between the different feature maps.
Instead of combining simply normalised feature maps, they
use some coefficients which give more or less weight to the
different features into the final saliency map. In these ap-
proaches, only local processes mimicking different cells are
used.
Walke r et al. [6], Mudge et al. [7], Stentiford [8], and
Boiman and Irani [9] base their saliency maps on the idea
that important areas are unusual in the image. The saliency
of a configuration of pixels is inversely related to their oc-
currence frequency. These techniques use comparisons be-
tween neighbourhoods of different shapes and at different
scales in order to assign an attention score to a region. Itti and
Baldi [10] also published a probabilistic approach of surprise
based on the Kullback-Leibler divergence also called “net sur-
prisal.” These methods have a more global approach and are
based on the similarity quantification inside an image or a
database.
We think that the local processing done by cells is some-
how globally integrated (possibly inside the SC). Our defini-
tion will be based on the rarity concept which is necessarily
global. We also think that our visual attention is not driven
by a specific feature as some models could assess. Heteroge-
neous or homogeneous, dark or bright, symmetric or asym-
metric, fast moving or slow moving objects can all attract
our visual attention. The HVS is attracted by the features
which are in minority in an image. That is why we can say
that visual attention is based on the observation of things
which are rare in a scene. Beyond the intuition that rarity
is a concept of primary importance in computational atten-
tion, the work of N
¨
a
¨
at
¨
anen et al. [11] in 1972 on the audi-
tory attention provided evidences that the evoked potential
(electroencephalogram-based) has an improved negative re-
sponse called mismatch negativity (MMN) when the subject
was presented with rare stimuli than with frequent ones. Ex-
periments were also made using the visual stimuli. Tales et
al. [12] concluded to the existence of an MMN response to
visual stimuli but the rare stimuli had a different complexity
compared to the most frequent ones. Crottaz-Herbette led
in her thesis [13] an experiment in the same conditions as
N
¨
a
¨
at
¨
anen for auditory MMN in order to find out if a visual
MMN really exists. The result was clearly positive with a high
increase of the negativity of the evoked potential when seeing
rare stimuli compared to the evoked potential when seeing
frequent stimuli.
2.3. Rarity quantification
A preattentive analysis is achieved by humans in less than
200 milliseconds; hence rarity quantification should be fast
and simple. The most basic operation is to count similar ar-
eas (histogram) and provide higher scores to the rarest areas.
Within the context of information theory, this approach is
close to the self-information. Let us call m
i
a message con-
taining an amount of information. This message is part of a
message set M. A message self-information I(m
i
)isdefined
as:
I
m
i
=−
log
p
m
i
,(1)
where p(m
i
) is the probability that a message is chosen from
all possible choices in the message set M (message occurrence
likelihood). We obtain an attention map by replacing each
message m
i
by its corresponding self-information I(m
i
). The
self-information is also known to describe the amount of sur-
prise of a message inside its message set [14] as it indicates
how surprised we should be at receiving that message (the
unit of self-information is the bit). We estimate p(m
i
)as:
p
m
i
=
H
m
i
Card(M)
,(2)
where H(m
i
) is the value of the histogram H for message m
i
,
and Card(M) is the cardinality of M. The quantification of
the message set M provides the sensitivity of p(m
i
):asmaller
quantification value will let messages which are not exactly
the same to be considered as similar.
Matei Mancas et al. 3
25
32
64
115
180
13
200
160
2
25
25
25
225
125
12
200
160
75
25
2
16
200
11
12
200
150
12
t
−2 t −1 t0
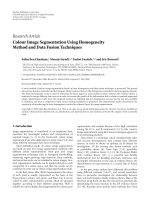
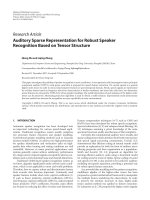
Figure 1: Example of m
i
and M on a three frame sequence of 3 ×3
images.
3. VISUAL ATTENTION FOR STILL IMAGES
In an image, we can consider in a first approximation that m
i
is the grey-level of a pixel at a given space location and M is
the entire image at a given time as shown in Figure 1.Ifwe
consider as a message the pixel with the coordinates (2, 2,t
0
),
we have m
i
= 11 and M ={25, 2, 16, 200, 11,12, 200, 150,
12
}.
The proposed model is global as the set M is considered
as the entire image and the probability of occurrence of each
message is computed on the whole set. Nevertheless, compar-
ing only isolated pixels is not efficient. In order to introduce
a spatial relationship, areas surrounding each pixel should be
considered.
Stanford [15] showed that the W-cells which are respon-
sible of the spatial analysis inside the SC may be separated
into two classes: the tonic W-cells (sustained response all over
the stimulus) and the phasic W-cells (high responses at stim-
ulus variations).
Our approach uses the mean and the variance of a pixel
neighbourhood in order to describe its statistics and to
model the action of tonic and phasic W-cells. We compute
the local mean and variance on a 3
× 3 sliding window and
our experience showed that this parameter is not of primary
importance. To find similar pixel neighbourhoods, we count
the neighbourhoods which have the same mean and variance
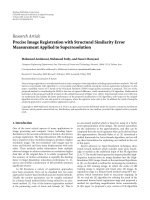
(2). Contours and smaller areas get higher attention scores
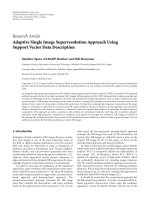
on the VA map (Figure 2, top row, second image). If we con-
sider only local computations as, for example, the local stan-
dard deviation or the local entropy (Figure 2, top row, third
and fourth image), contours are also highlighted but there
are some differences like the camera fixation system or the
cameraman’s trousers. The local entropy seems to provide
better results but the textured grass area has a too high score.
This difference is even more important on textured im-
ages. As it contains repeating patterns, its rarity score will be
lower. More regular a texture is, less surprising it is and less
important the attention score will be [16]. Local computa-
tions have a uniform high response for this textured image
(Figure 2, bottom row, third and fourth image). In the case
of our VA map (Figure 2, bottom row, second image), the
response is important only for the white mark or the grey
areas which are rare and which consequently attract human
attention. Most of the vertical and horizontal separation lines
between the bricks are also well highlighted. Achieved obser-
vations prove the importance of a global integration of the
local processing made by the cells. Rarity or surprise which
obviously attracts our attention cannot be computed only lo-
cally, but they need to be estimated on the whole image.
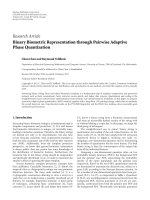
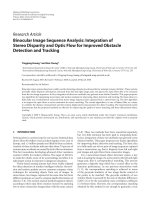
Moreover, Figure 3 compares I&K model to the proposed
VA map for a visual inspection of an apple. The left image
displays the original apple and the low-contrast defect con-
tour in red. The I&K model does not manage to locate the
defect even after more than 20 fixations and it focuses on the
apple edges, whereas the proposed model (right image) pro-
vides to the defects the more important attention score after
the apple edges. Even if for general purposes I&K model pro-
vides consistent results concerning saliency, our rarity-based
model outperforms it in detecting abnormalities and defects
especially in the case where these defects have a low contrast
with their neighbourhood [17] and humans detect them us-
ing global rarity or strangeness in the image.
4. VISUAL ATTENTION FOR VIDEO SEQUENCES
Y cells, which are responsible for the motion analysis, have a
high temporal resolution but a low spatial one [1]. Thus, the
image spatial resolution is reduced and a 3
×3 window mean
filtering is applied on the resulting image. As Y cells are not
sensitive to colour, only the luminance is used.
Message m is here the grey-level of a pixel at a given spa-
tial location and message set M is the history of all grey-
levels the pixel had over time. For example, the pixel with
the coordinates (2, 2,t
0
)inFigure 1 has m
i
= 11 and M =
{
180, 125, 11}.
However, if at each frame, the whole pixel history is
needed, this may need huge size data to be stored. Hopefully,
our ability to forget lets us specify a history size and to take
into account only recent frames providing a limit to the set
M.
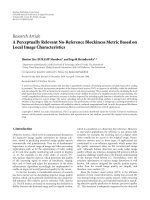
As motion is generally rare in an image where most pixels
are quite the same from one frame to another, moving objects
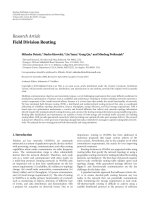
will be naturally well highlighted. On the top of Figure 4,a
video frame was annotated with two regions. Region 1 is a
flickering light (regular time texture). The second region is a
walking person. The middle row of Figure 4 displays a mo-
tion estimation map obtained by the subtraction of the cur-
rent frame from a 200-frame-estimated background using a
Gaussian model (GM) [18] and its thresholded map. The
bottom row of Figure 4 displays our VA map computed on
a 200-frame history and its thresholded map. The GM-based
motion map and our VA map were both normalised and the
same threshold was used in both cases. The two thresholded
maps show that the region 2 is detected by both approaches.
Our model seems to detect more largely the walking per-
son which is underestimated by the GM method, but it also
detects a little part of its shadow. The most noticeable differ-
ence is in the region 1. Our VA model awards little attention
score to the flickering light as it has a higher frequency and
thus is a less rare event.
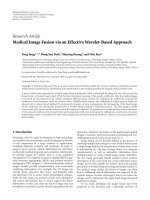
Figure 5 provides the results on another video sequence.
Both methods correctly detected regions 1 and 2 (a mov-
ing car and a walking person). However, our method reacted
with a very low attention score on region 3 (a tree moving be-
cause of the wind). The flickering light and the moving tree
are well highlighted at the beginning of the video sequences
4 EURASIP Journal on Image and Video Processing
Figure 2: Left to right: initial image, proposed VA model, local standard deviation, local entropy.
Figure 3: Left to right: original annotated defected apple, saccades and fixations in I&K, proposed VA map.
while the memory did not record enough events to see them
as less rare, but after 200 frames, the attention score of these
two events naturally decreases without the need of any high-
level information or inhibition. As the attention map is here
only computed in parallel across the visual field and no serial
region computation is required, this is a low-level and reflex
process. These two examples show that the same behaviour is
obtained for temporal or spatial attention: textures, in space
or in time, are considered as less important areas because of
the global integration of information in space or in time.
5. APPLICATION: ANISOTROPIC IMAGE
REPRESENTATION
5.1. An attention-based anisotropic
filtering framework
Unlike digital cameras and their uniform sampling acquisi-
tion system, humans do not see the world uniformly. The
retina receptors are not equally dispatched on its surface, but
they are concentrated around the centre of the optical axis in
aplacecalledfovea[1]. The image resolution exponentially
decreases from the fovea to the retina periphery. The brain
gets information about the visual environment by registering
several views acquired while the eye fixates some “interesting
points.”
Computationally, these interesting points may be consid-
ered as the most highlighted areas of the VA map, thus the
most salient regions in the image. While the eye fixates the
highest-level attention areas, the resolution of the other areas
dramatically decreases when going further and further from
the fixations. The proposed perception of the visual environ-
ment is based on the fact that a mean observer will fixate the
higher attention level areas and only then he will have a look
at the others.
To mimic this perceptual behaviour, the VA map is first
separated into 10 areas (10 is experimentally chosen) sorted
by level of saliency. A decreasing resolution function (1/x
like) which is quite well correlated with the distribution of
the cone cells in the retina is used. To decrease the resolu-
tion, a simple idea is to use lowpass filters with an increasing
kernel size from the unfiltered most salient areas to the most
filtered and least salient areas. The kernel size K is defined as
K
= α + β
1 −
1
x
. (3)
The variable x represents the distance from the fovea.
Here, x is a vector with a range going from 1 to 10 as 10 im-
portance levels were defined. A parameter β provides control
on the anisotropic image representation: more important β
is, more the kernel size increases faster and the image resolu-
tion decreases faster from the most salient to the least salient
regions.
Matei Mancas et al. 5
Figure 4: Annotated frame on top. Middle row: GM-based motion
estimation map and thresholded map, Bottom row: our VA map
and thresholded map.
Figure 5: Annotated frame on top. Middle row: GM-based motion
estimation map and thresholded map, Bottom row: our VA map
and thresholded map.
Figure 6: Left: original image, top row: I&K saliency map and cor-
responding anisotropic filtering (β
= 23, α = 0, OT = 0), Bottom
row: our VA map and corresponding anisotropic filtering (β
= 23,
α
= 0, OT = 0).
The parameter α can optionally be used to control the
kernel size of the filtering (K) for the most salient regions.
The default value is “0” which means that the most salient
areas from an image are not filtered at all. Nevertheless, in
some applications (e.g., high frequency noise spreads on the
entire image) one may want to filter with a certain kernel size
even the most important areas.
Finally, a parameter called “observation time” (OT) is
also added to the algorithm. When OT
= 0, the image is vi-
sualised as previously described by keeping a good resolution
only to the most salient regions. More OT increases, more
we model the fact that a viewer has more time to observe the
scene, hence after visualizing the most salient areas, he will
also have a look at the least salient ones.
The filtering method used here to decrease the image
resolution is a median filtering with increasing kernel sizes
computed with (3). Nevertheless, several other lowpass fil-
tering techniques with different kernel shapes could also be
used. The used computational attention model is very im-
portant because the filtering result directly depends on the
VA map and its characteristics. Saliency models which pro-
vide fuzzy saliency maps as I&K model are less convenient
here: even if some important regions are well highlighted,
many others are not taken into account and the filtering will
not provide satisfying results on object boundaries. A com-
parison between anisotropic filtering using the proposed VA
map and I&K saliency map is done in Figure 6. The visual at-
tention model proposed by Stentiford could be more efficient
inthiscaseasitproved[19] its possibility in achieving still
images coding. The problem is that there is no generalization
of this model to video sequences until now. Moreover, it is
6 EURASIP Journal on Image and Video Processing
Figure 7: Anisotropic filtering (β = 8, α = 0) from left to right: OT = 0, OT = 2, OT = 4andOT= 8.
Defect
Figure 8: Top: the annotated original image, middle row: PM filter-
ing and difference with the original, bottom row: proposed filtering
and difference with the original.
difficult to compare several attention models as few of them
are publicly available. Therefore, the proposed VA algorithm
was chosen because it efficiently highlights the interesting ar-
eas and their edges which is important for filtering purposes.
This method is also simple to implement and fast which is a
critical point especially for video sequences filtering.
5.2. Still images attention-based anisotropic filtering
Figure 7 shows the cameraman image in an anisotropic rep-
resentation (β
= 8). When OT = 0, only the very salient
regions have a high resolution, as the rest of the image was
lowpassed. When OT increases, the image resolution is en-
hanced in more regions until a uniform high resolution.
If we compare the proposed anisotropic representation
with a classical anisotropic filtering as the Perona and Malik
(PM) diffusion algorithm [20], there is no significant differ-
ence on an image like the cameraman. An objective compari-
son between the different algorithms is difficult and depends
on the application of interest. Some papers which compare
anisotropic filtering techniques use as a comparison criterion
the fact that a filtering technique is “good” if it preserves well
the boundaries and provides sharper “objects” edges than the
others using several sets of parameters [21]. Based on the
sharpness of the edges for a set of natural scene images, the
results of the presented algorithm appeared to be equivalent
to those of the PM algorithm. Even if for general purpose
images, the proposed algorithm has equivalent results with
already existing algorithms, it brings improvements for some
categories of still images.
Our algorithm leaves the important areas unfiltered while
classical approaches may filter the image between the high
gradients. This case may be seen in Figure 8.Thedefect
on the apple has an important contrast, so both methods
keep the defect edges quite well defined even if the proposed
method seems more accurate; but inside the defect, some
variations have less contrast, which lead to different results
using the PM algorithm and the proposed one. While de-
tails inside the defect are lost using the PM diffusion, they
remain intact when using the proposed anisotropic filtering.
This fact can be verified by the difference between the fil-
tered image and the original one. If both methods filter the
healthy skin, the PM algorithm also filters the defect and
looses plenty of information about it (middle row, last im-
age). The proposed algorithm keeps the main information of
the defect unfiltered (bottom row, last image) preserving its
characteristics.
In medical imaging, abnormalities are usually rare; there-
fore, pathologies can be awarded with higher attention scores
even if the overall contrast is poor. Figure 9 displays an axial
neck CT-Scan image where the presence of a tumour is iden-
tified. After a small observation time (OT
= 1) the active
area of a tumour becomes interesting, therefore it remains
unfiltered (bottom row) while the surrounding muscles are
heavily filtered. For the same result on the muscles, the PM
diffusion will filter the active tumour and loose information
about it (middle row, first image). If the tumour is preserved,
the muscles are not filtered enough (middle row, last image).
Matei Mancas et al. 7
Tumo ur ( act iv e a re a)
Figure 9: Top: the annotated original image, middle row: PM fil-
tering (smooth muscles) and PM filtering (good quality tumour),
bottom row: proposed filtering and difference with the original.
The ability to keep the entire region of interest unfiltered
is an important advantage of the proposed method. Usually,
full resolution is needed for regions of interest for further fea-
ture extraction in domains like image-based quality control
or medical imaging.
5.3. Video sequences attention-based
anisotropic filtering
Let us now generalise the image anisotropic representation to
video sequences. The maximum operator is used to fuse the
spatial and temporal saliency maps of a frame: humans react
to the most important stimulus from all the saliency maps
(Figure 10).
Figure 11 shows in each column for three different video
sequences the evolution of the image resolution from a first
frame to increasing OT values on the following frames. Hu-
mans first look at the moving regions, and then frame by
frame they discover the rest of the image. Usually after a cer-
tain time, if the background is fixed, the observer will then
focus only on the moving objects. If parts of the moving tree
or flickering light have a good resolution even when OT
= 0,
this is not due to their temporal attention map (see Figure 4)
but to their spatial saliency map.
The interest of the anisotropic filtering in video se-
quences is to enhance an adaptative coding or information
transmission method. These methods aim at transmitting
first important information with a small compression rate,
and then the less important information with a higher com-
pression rate. The proposed filtering technique is able to
smoothen areas which are less important before the com-
pression leading to a higher compression rate for the same
quality factor.
Ta ble 1 displays the sizes of the top frames in Figure 11
for the sequences S1, S2, and S3 and the different file sizes,
function of the OT parameter after using a JPEG compres-
sion with a quality of 90. One can see that for low OT values,
the images are naturally twice smaller than the original.
Even if the file size difference for OT
= 5orOT= 8
is less significant, the perceptual difference between the im-
ages is small and the difference of compression for a MJPEG
video file (25 frames per second) could become significant.
Moreover, by varying the OT value, the compression rate be-
comes scalable and it is able to adapt to the network in order
to provide a realtime transmission, even if sometimes, de-
tails considered as less important are smoothed. The main
information may remain unfiltered and realtime. For this
scheme, classical MJPEG compression algorithm would re-
main unchanged: the only need is an anisotropic filtering be-
fore the transmission. Here, the transmission “intelligence”
is not contained into the compression algorithm but in the
preprocessing step.
6. CONCLUSION
We presented a rarity-based visual attention (VA) model
working on both still images and video sequences. This
model is a reflex one and it takes into account the whole im-
age and not only local processing. Mathematically, the model
is based on the self-information (1) which expresses how
“surprising” information is and its results are close to the ex-
pected reaction of a human.
Comparisons were made between the spatial VA map,
the gradient amplitude and the local entropy, showing some
similarities but also fundamental differences connected to
the global computation of our model versus local compu-
tations. As spatial textures are repeating patterns, their rarity
and their saliency will be lower than the saliency of each of
their isolated patterns. The proposed model was also com-
pared with a reference publicly available algorithm: the I&K
model. For the precise case of low-contrast defects, our VA
model outperforms the I&K one.
The temporal VA map was compared to the classical GM
background estimation using Gaussians to model pixel be-
haviours. Similar results were obtained for most movements,
but again, we noticed differences concerning the temporal
textures. When pixel values often repeat in time, the area
saliency drops using our model. The GM-based background
estimation will add the texture “mean” to the background
and false detection or false alarms can be caused even by reg-
ular temporal textures as flickering lights or moving trees.
Our model avoids most of these problems as it assumes that
8 EURASIP Journal on Image and Video Processing
Figure 10: Left to right: the video frame, the temporal VA map, the spatial VA map and the final VA map.
Figure 11: Top to bottom: anisotropic representation on several consecutive frames for sequences S1, S2, S3 (β = 21, α = 0, OT = 0, 2, 5, 8
fromtoptobottom).
these temporal textures are not rare and allow low attention
scores to them.
An anisotropic representation based on the retina prop-
erties was then provided for both still images and video se-
quences. The presented model is particularly well adapted
to provide attention maps for filtering and coding as op-
posed with I&K model which provides fuzzy saliency maps
difficult to use for this particular application. Comparisons
with the classical Perona and Malik anisotropic filtering
were made. Similar results were often obtained, however our
method seems to provide smoother results. Moreover, as the
anisotropic filtering is gradient-based, the behaviours of our
image representation and the classical anisotropic filtering
are very different when textures take an important place in
the image. A medical imaging example and an apple defect
example show that our image representation provides high
resolution to high gradients but also to defects and abnor-
malities. This shows that our model is a first step into image
Matei Mancas et al. 9
Table 1: JPEG quality 90 compression on original S1, S2, S3 top
frames from Figure 11 and on filtered frames using the proposed
perceptual representation at different OT values.
OT
S1 S2 S3
(original: 6.39 KB) (original: 8.29 KB) (original: 7.47 KB)
0 3.89 KB 3.99 KB 3.39 KB
2 5.19 KB 5.93 KB 5.41 KB
5 6.14 KB 7.58 KB 6.74 KB
8 6.36 KB 8.10 KB 7.29 KB
understanding and even at a low-level processing, important
information is more accurately found than with local pro-
cessing methods.
The perceptual video images representation that we pro-
vide seems to correspond to a human-like approach of our
environment with high attention scores on moving objects,
but also with a progressive discovery of the background. Ex-
amples on several video sequences show this evolution of im-
age discovery and demonstrate the ability to provide higher
compression rates for the same JPEG quality compression.
Scalable video compression can thus be achieved by vary-
ing the OT parameter of the anisotropic filtering prior to the
compression step.
Compared to other global attention models described in
Section 2.2, our approach is much simpler and related to the
information theory framework. It can be generalised from
image to video and even to other signals like sound. More-
over, our model does not use multiresolution at this stage
and it can be efficiently coded for real-time processing.
ACKNOWLEDGMENT
The authors would like to thank the Multivision group of
Multitel research centre, Belgium for the high quality and nu-
merous video sequences they provided.
REFERENCES
[1] D. H. Hubel, Eye, Brain, and Vision, Scientific American Li-
brary, no. 22, W. H. Freeman, New York, NY, USA, 1989.
[2] A. M. Treisman and G. Gelade, “A feature-integration theory
of attention,” Cognitive Psycholog y, vol. 12, no. 1, pp. 97–136,
1980.
[3] J. W. Crabtree, P. D. Spear, M. A. McCall, K. R. Jones, and S.
E. Kornguth, “Contributions of Y- and W-cell pathways to re-
sponse properties of cat superior colliculus neurons: compari-
son of antibody- and deprivation-induced alterations,” Journal
of Neurophysiology, vol. 56, no. 4, pp. 1157–1173, 1986.
[4] L. Itti and C. Koch, “A saliency-based search mechanism for
overt and covert shifts of visual attention,” Vision Research,
vol. 40, no. 10–12, pp. 1489–1506, 2000.
[5] O.LeMeur,P.LeCallet,D.Barba,andD.Thoreau,“Acoher-
ent computational approach to model bottom-up visual at-
tention,” IEEE Transactions on Pattern Analysis and Machine
Intelligence, vol. 28, no. 5, pp. 802–817, 2006.
[6] K. N. Walker, T. F. Cootes, and C. J. Taylor, “Locating salient
object features,” in Proceedings of the 9th British Machine Vi-
sion Conference (BMVC ’98), vol. 2, pp. 557–566, Southamp-
ton, UK, September 1998.
[7] T. N. Mudge, J. L. Turney, and R. A. Volz, “Automatic genera-
tion of salient features for the recognition of partially occluded
parts,” Robotica, vol. 5, no. 2, pp. 117–127, 1987.
[8] F. W. M. Stentiford, “An estimator for visual attention through
competitive novelty with application to image compression,”
in Proceedings of the 22nd Picture Coding Symposium (PCS
’01), pp. 101–104, Seoul, Korea, April 2001.
[9] O. Boiman and M. Irani, “Detecting irregularities in images
and in video,” in Proceedings of the 10th IEEE International
Conference on Computer Vision (ICCV ’05), vol. 1, pp. 462–
469, Beijing, China, October 2005.
[10] L. Itti and P. Baldi, “A principled approach to detecting sur-
prising events in video,” in Proceedings of IEEE Computer So-
ciety Conference on Computer Vision and Pattern Recognition
(CVPR ’05), vol. 1, pp. 631–637, San Diego, Calif, USA, June
2005.
[11] R. N
¨
a
¨
at
¨
anen, A. W. K. Gaillard, and S. M
¨
antysalo, “Early
selective-attention effect on evoked potential reinterpreted,”
Acta Psychologica, vol. 42, no. 4, pp. 313–329, 1978.
[12] A. Tales, P. Newton, T. Troscianko, and S. Butler, “Mismatch
negativity in the visual modality,” NeuroReport, vol. 10, no. 16,
pp. 3363–3367, 1999.
[13] S. Crottaz-Herbette, “Attention spatiale auditive et visuelle
chez des patients h
´
emin
´
egligents et des sujets normaux:
´
etude
clinique, comportementale et
´
electrophysiologique,” M.S. the-
sis, University of Geneva, Geneva, Switzerland, 2001.
[14] M. Tribus, Thermodynamics and Thermostatics: An Introduc-
tion to Energy, Information and States of Matter, with Engineer-
ing Applications, D. Van Nostrand, New York, NY, USA, 1961.
[15] L. R. Stanford, “W-cells in the cat retina: correlated morpho-
logical and physiological evidence for two distinct classes,”
Journal of Neurophysiology, vol. 57, no. 1, pp. 218–244, 1987.
[16] M. Mancas, C. Mancas-Thillou, B. Gosselin, and B. Macq,
“A rarity-based visual attention map: application to texture
description,” in Proceedings of IEEE International Conference
on Image (ICIP ’06), pp. 445–448, San Antonio, Tex, USA,
September 2006.
[17] M. Mancas, B. Unay, B. Gosselin, and D. Macq, “Computa-
tional attention for defect localisation,” in
Proceedings of ICVS
Workshop on Computational Attention & Applications (WCAA
’07), Bielefeld, Germany, March 2007.
[18] C. R. Wren, A. Azarbayejani, T. Darrell, and A. P. Pentland,
“Pfinder: real-time tracking of the human body,” IEEE Trans-
actions on Pattern Analysis and Machine Intelligence, vol. 19,
no. 7, pp. 780–785, 1997.
[19] A. P. Bradley and F. W. M. Stentiford, “JPEG 2000 and region
of interest coding,” in Digital Image Computing: Techniques
and Applications (DICTA ’02), pp. 303–308, Melbourne, Aus-
tralia, January 2002.
[20] P. Perona and J. Malik, “Scale-space and edge detection using
anisotropic diffusion,” IEEE Transactions on Pattern Analysis
and Machine Intelligence, vol. 12, no. 7, pp. 629–639, 1990.
[21] D. Barash and D. Comaniciu, “A common framework for non-
linear diffusion, adaptive smoothing, bilateral filtering and
mean shift,” Image and Vision Computing,vol.22,no.1,pp.
73–81, 2004.