Báo cáo hóa học: " Strategies for Controlled Placement of Nanoscale Building Blocks" doc
Bạn đang xem bản rút gọn của tài liệu. Xem và tải ngay bản đầy đủ của tài liệu tại đây (1.34 MB, 27 trang )
NANO REVIEW
Strategies for Controlled Placement of Nanoscale Building Blocks
Seong Jin Koh
Received: 2 June 2007 / Accepted: 20 August 2007 / Published online: 9 October 2007
Ó to the authors 2007
Abstract The capability of placing individual nanoscale
building blocks on exact substrate locations in a controlled
manner is one of the key requirements to realize future
electronic, optical, and magnetic devices and sensors that
are composed of such blocks. This article reviews some
important advances in the strategies for controlled place-
ment of nanoscale building blocks. In particular, we will
overview template assisted placement that utilizes
physical, molecular, or electrostatic templates, DNA-pro-
grammed assembly, placement using dielectrophoresis,
approaches for non-close-packed assembly of spherical
particles, and recent development of focused placement
schemes including electrostatic funneling, focused place-
ment via molecular gradient patterns, electrodynamic
focusing of charged aerosols, and others.
Keywords Placement Á Array Á Alignment Á
Nanoscale building blocks Á Nanoparticle Á Nanocrystal Á
Quantum dot Á Nanowire Á DNA Á Protein Á
Carbon nanotube Á Template Á Electrostatic Á SAMs Á
Dielectrophoresis Á Capillary force Á Growth
Introduction
There has been a lot of interest recently in fabricating
electronic, optical, and magnetic devices/sensors that are
built on nanoscale building blocks such as nanoparticles,
nanowires, carbon nanotubes, DNA, proteins, etc. Over
the past decade, very promising performances have been
demonstrated at the single device level or in a collection of
a few single units [1–14]. Despite these successes, a major
challenge remains: for the individual functional units to be
incorporated into practical devices and sensors, they must
be placed onto exact substrate locations so that they can be
addressed and connected among themselves and to the
outside world. This, i.e., the precise placement of nanoscale
building blocks on exact substrate locations, is an extre-
mely challenging goal. This article reviews recent progress
in a variety of placement strategies, some of which are
nearing maturity, while others are in their infant stages
[15]. Specifically, this review will discuss the following:
(1) Placement using physical templates, employing capil-
lary forces, spin-coating, surface steps, and others. This
section also discusses template-assisted growth of quantum
dot arrays; (2) Placement using molecular templates,
employing patterned self-assembled monolayers (SAMs),
whose specific terminal groups are functionalized to
selectively interact with the building blocks; (3) Placement
using electrostatic templates, employing localized charges
on the substrate surface to attract charged building blocks;
(4) DNA-programmed placement, employing 2D DNA
crystals as scaffolds; (5) Placement using dielectrophoresis;
(6) Non-close-packed assembly of spherical particles; and
(7) Focused placement, employing focusing mechanisms to
guide nanoscale building blocks to substrate locations
which are smaller than the template guiding them.
The strategies that we will discuss in this article are not
limited to absolute placement in the fixed substrate coor-
dinates, but include relative positioning of nanoscale
entities with respect to each other or to some reference
structures. An example is a formation of 2D nanoparticle or
protein arrays using a scaffold of 2D DNA crystal; relative
positions between nanoparticles or proteins within the 2D
S. J. Koh (&)
Department of Materials Science and Engineering,
The University of Texas at Arlington, Arlington, TX 76019,
USA
e-mail:
123
Nanoscale Res Lett (2007) 2:519–545
DOI 10.1007/s11671-007-9091-3
DNA scaffold are well defined, although placement of
DNA scaffolds themselves on the substrate is not easily
controlled. We will also cover the growth or formation
(rather than placement) of nanoscale entities that organize
into an ordered form in one- or two-dimension. Formation
of 2D quantum dot arrays using physical templates and
growth of nanowires along the step edges belong to this
category.
Placement Using Physical Templates
Physical templates can be utilized for controlled placement
of nanoscale or microscale building blocks. Examples of
physical templates include holes and trenches that can be
fabricated on a substrate surface using lithography and
etching/lift-off techniques, surface steps that naturally exist
on crystalline metal and semiconductor surfaces, corruga-
tion of substrate surfaces, and channels formed in a
microstamp for molecular printings. In this section, we will
review several strategies to position nanoscale and micro-
scale building blocks using these physical templates.
Capillary Force Driven Placement into Physical
Templates
Capillary force has been successfully exploited to place
individual nanoscale/microscale building blocks into tren-
ches or holes pre-defined on the substrate. In this approach
[16–20], the substrate is immersed into a colloidal solution,
and then slowly pulled out or slowly dried by solvent
evaporation through heating. In both cases, the solution–air
interface slowly recedes. At the front of the receding
interface, the thickness of solution becomes smaller than
the diameter of nanoparticles (for non-spherical shape, the
height of the building blocks) and a three-phase solution–
air–nanoparticle interface is formed around the nanoparti-
cle surfaces. This three-phase interface creates capillary
forces on the nanoparticles. The direction of the capillary
force depends on thickness of the solution layer, which
depends on the substrate pattern, thicker in the trenches or
holes. The net result is that the nanoparticles are pushed
into the trenches or holes while they pass through other
areas without any deposition.
This capillary force driven placement has been suc-
cessfully demonstrated by many groups. Xia et al.
demonstrated uniform 1D and 2D aggregates of colloidal
particles characterized by a range of well-defined sizes,
shapes, and structures [16, 20]. Figure 1 shows one
example of their accomplishments where polystyrene (PS)
beads and gold nanoparticles were placed along the trench
lines. In addition, by systematically changing the
geometric shape of the template and the size of the col-
loidal spheres, they were able to place colloidal particles
into templates and form aggregates in well-controlled
configurations [16]. With appropriate template design,
such as using V-shaped grooves, they placed spherical
colloids into multi-layered aggregates such as helical
chains [19]. Alivisatos and co-workers showed that the
capillary forces are still effective for the placement of
nanoparticles below 50 nm [17]. They showed organiza-
tion of nanoparticles of 50-, 8-, and 2-nm in diameter into
lithographically defined trenches and holes. Placement of
non-spherical shape building blocks such as CdTe nano-
tetrapods has also been demonstrated.
Particle aggregates composed of different types of par-
ticles (different in size, chemical composition, surface
functionality, density or sign of surface charges, etc.) have
also been assembled using capillary force driven place-
ment. Xia and co-workers demonstrated the formation of
asymmetric dimers composed of two different kinds of
particles [21]. In their approach, they first prepared an array
of cylindrical holes (diameter: 5.0 lm, height: 2.5 lm) in
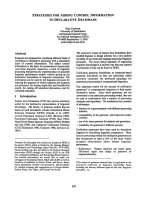
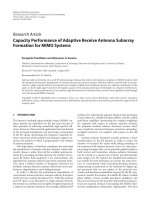
Fig. 1 SEM images of (A) two linear chains of 150 nm PS beads and
(B) a stripe of closely packed lattice of gold nanoparticles (*50 nm
in diameter) that were formed by templating against trenches
120 nm · 150 nm in cross-section (see the inset for an AFM image).
The trenches were, in turn, fabricated using near-field optical
lithography with an elastomeric stamp as the binary phase shift
mask. (Reprinted with permission from Reference [16]. Copyright
2003 Wiley-VCH.)
520 Nanoscale Res Lett (2007) 2:519–545
123
photoresist film spin-coated on a glass substrate, and then
single 2.8-lm PS beads were trapped inside each hole,
Fig. 2A. This was achieved by a careful choice of the
diameter and height of the holes as well as the particle
diameter. Under this geometrical constraint, during the
drying process, capillary force pushed a single PS particle
into each hole one by one. After fixing the position of the
PS beads inside the holes by heating the sample to a
temperature slightly higher than the glass transition tem-
perature of PS (*93 °C), the sample went through a 2nd
dewetting process where 1.6-lm single silica colloids were
positioned into the remaining space of each hole due to the
capillary force, Fig. 2B. These asymmetric dimers can be
permanently welded onto single pieces by heating the
sample at temperature slightly higher than the glass tran-
sition temperature of PS. The seamless bonding of the
dimers can be seen in the TEM image, Fig. 2C, which was
obtained after the removing the photoresist film. This
approach allows controlled fabrication and placement of
many other combinations of asymmetric dimers. An
example is displayed in Fig. 2D.
Formation of Quantum Dot (QD) Arrays Using
Physical Templates
Quantum dots (QDs) are nanoscale objects in which elec-
trons are confined in a dimension that is smaller than their
de Broglie wavelength, resulting in the change of energy
gaps or creation of quantized energy levels much like
individual atoms (therefore, QDs are sometimes called
artificial atoms) [22–24]. QDs have been of great interest
due to their promising applications such as quantum elec-
tronic/optical devices [25–27], single electron devices [3],
and single photon sources [28–30]. Among many methods,
the formation of QDs in the heteroepitaxial growth of thin
films using molecular beam epitaxy (MBE) has been most
extensively studied. The usual growth mode is Stranski-
Krastanow (SK) growth, in which self-assembled QDs are
formed via 2D to 3D transition of epitaxial films in het-
eroepitaxial growth of lattice mismatched materials. This
transition occurs spontaneously to reduce the misfit strain
in the 2D strained heteroepitaxial wetting layers by form-
ing dislocation-free 3D islands (QDs). Various QD systems
have been grown using SK growth mode including Ge QDs
on Si (001), GaAs QDs on GaAs (001), and InAs/InGaAs
QDs on GaAs (001) [31–33].
The QDs produced as above, however, are randomly
distributed over the surface and control of positioning has
been difficult. For practical applications where individual
QDs must be addressable, including integrated systems on
single chips and single QD devices, it is required to grow
QDs at exact locations. Among many strategies to grow
QDs with precise position control, the template-assisted SK
growth (specifically, the SK growth of QDs on pre-pat-
terned substrates) has been shown to be very promising as
demonstrated by many recent studies [30, 34–44]. This
section briefly reviews recent advances in this strategy.
One method to grow well-ordered QD arrays is to use
selective epitaxial growth (SEG) on a patterned substrate.
In this approach, the substrate surface is masked with a
material different from the substrate, and upon exposure to
source gases, QDs grow only on the unmasked exposed
surface, leading to a QD array in the original mask pattern.
For example, well-ordered Ge QD arrays were grown on Si
(001) by Kim et al. [44]. They first made a square array of
windows in SiO
2
film (thickness 50 nm) on a Si (001)
substrate. After selective deposition of a Si buffer layer on
the exposed Si substrate, selective SK growth of Ge on the
Si buffer layer was carried out. With a window size of
300 nm or below, they were able to grow exactly one Ge
QD at the center of each window with excellent size uni-
formity, which was attributed to nucleation and diffusion
kinetics, and/or strain energetics. Importantly, using this
method, the size of the QDs can be made smaller than that
of exposed windows.
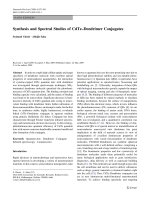
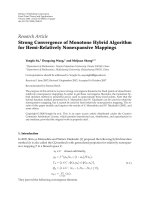
Fig. 2 (A, B) SEM images that illustrate the procedure used to
assemble two different types of spherical colloids (2.8-lm PS beads,
1.6-lm silica balls) into dimeric units. The cylindrical holes were
patterned in a thin film of photoresist. (C) TEM image of one of the
dimers after released from their original support by dissolving the
photoresist pattern in ethanol, followed by redeposition onto a TEM
grid. (D) The fluorescence microscopy image of a 2D array of dimers
that were self-assembled from PS beads that were different in both
size and color: 3.0-lm beads doped with a green dye (FITC) and 1.7-
lm beads doped with a red dye (Rhodamin). (Reprinted with
permission from Reference [21]. Copyright 2001 American Chemical
Society.)
Nanoscale Res Lett (2007) 2:519–545 521
123
Well-positioned QD arrays can also be made without
resorting to any masks, but relying on surface templates.
For example, Bauer and co-workers first made 2D peri-
odic pits on a Si (100) surface using lithography and RIE,
which was followed by deposition of a Si buffer layer
[38]. Subsequent deposition of 4–10 monolayers (MLs) of
Ge led to the formation of precisely positioned QD arrays
having the same ordering as the underlying template.
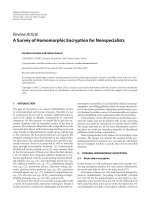
Figure 3 demonstrates AFM topographies and their
Fourier transforms (FT) of well-positioned QD arrays for
10 ML Ge and 6 ML Ge deposition. The preferential
growth of Ge QDs at the center of the pits was attributed
to the fast downward diffusion of Ge dimers and accu-
mulation of Ge atoms at the bottom of the pits. Because
the area at the pit bottom was small, only one QD was
formed per each pit.
Formation of well-positioned QD arrays can also be
realized on almost flat surfaces that are made by deposition
of buffer layers/spacers on pre-patterned substrates [37, 40,
45–47]. The key to controlled positioning of the QDs is to
use the long-range order of the underlying pre-patterns to
produce appropriate strain fields in the subsequent layers.
The pre-patterns are defined using typical lithography and
etching/lift-off. Then, buffer layers/spacers are deposited
over them, resulting in a film which is nearly flat and which
bears modulated strain fields that have the same lateral 2D
ordering as the underlying pre-patterns. The strain field
causes strain-modulated diffusion of deposited adatoms as
well as accumulation/preferential nucleation of adatoms in
the area of minimum strain energy density [41, 46, 48, 49].
This leads to the formation of QDs in a long-range ordered
array which is a replica of the underlying pre-patterns.
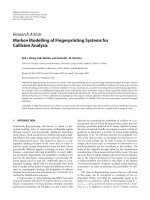
Kiravittaya et al., for example, demonstrated formation of
near-perfect QD arrays [34, 37, 46]. A representative AFM
image is shown in Fig. 4, where a square array of InAs
QDs was grown on a patterned GaAs (001) substrate [34,
37]. This highly ordered positioning of QDs was also
achieved for other systems such as Ge QDs on Si (001) and
InGaAs QDs on GaAs (001) [40, 47]. With this method,
QDs can be positioned over a large area in parallel pro-
cessing. For example, Heidemeyer et al. demonstrated a
growth of a QD array composed of about one million
InGaAs QDs with near-perfect (99.8% yield) site control
[47]. In addition, QD formation on pre-patterned substrates
produced superior shape and size uniformity compared to
growth on unpatterned substrates. A very narrow size dis-
tribution, *5% in height and diameter, was demonstrated
for InAs QDs on GaAs (001), Fig. 4C[34, 37].
The formation of precisely positioned QD arrays is not
limited to 2D arrays, but can be realized for 1D and 3D
arrays as well. One-dimensional QD arrays were formed
utilizing modulated strain fields created by underlying pre-
patterned trenches [39, 45, 50, 51]. The capability of
forming ordered 2D QD arrays can be utilized to form 3D
QD crystals through stacking of 2D QD arrays. Formation
of 3D QD crystals was demonstrated for InAs/GaAs QDs
on patterned GaAs (001) [36, 46] and for Ge QDs on
patterned Si (001) [
40]. The capability of growing QDs on
exact substrate locations has significant implications for the
realization of practical quantum devices. For example,
Kiravittaya et al. grew ordered GaAs QD arrays on GaAs
(001) and demonstrated single photon emission from the
ordered QDs [30]. The formation of addressable QDs could
lead to fabrication of integrated single QD devices.
Other Placement Schemes Utilizing Physical Templates
In addition to the capillary force assisted method and for-
mation of QD arrays using pre-patterns, spin-coating
assisted placement, assembly along the step edges of the
surface, and sonication-assisted solution embossing are
examples of other placement schemes using physical
templates. Brueck and co-workers explored spin-coating to
place sub-100 nm silica particles into holes and grooves
patterned on silicon oxide film or a silicon wafer [52]. They
showed that the controlled placement of spherical particles
can be achieved by choosing appropriate spin speed, the
pH, and the geometries of grooves and holes (width, depth,
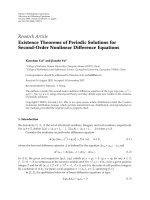
Fig. 3 3D AFM topographies of the islands and their Fourier
transforms. Top: 3D AFM image of a sample with 10 ML Ge
deposition (top left) and its Fourier transform (top right). Period:
370 nm · 370 nm, along h110i directions. Bottom: 3D AFM image
of a sample with 6 ML Ge deposition (bottom right) and its Fourier
transform (bottom left). Period: 400 nm · 400 nm, along [110] and
[100] directions. (Reprinted with permission from Reference [38].
Copyright 2004 American Institute of Physics.)
522 Nanoscale Res Lett (2007) 2:519–545
123
diameter, and the sidewall slope). By adjusting these
parameters, they formed one-particle wide linear chains,
zigzag chains (1.5 particle wide), and two-column arrays of
*80 nm silica nanoparticles inside pre-defined grooves.
Step edges, which naturally exist on the surface of
crystalline metals or semiconductors, can be utilized as
templates along which nanowires of various materials can
be grown. In this approach, the atoms are deposited onto
the substrate surface in ultrahigh vacuum (UHV) and dif-
fuse to atomic step edges, forming nanoscale wires. The
width of nanowires and the spacing between them can be
independently controlled by varying deposition time and
step spacing (via miscut angle), respectively. By control-
ling the surface diffusion of Cu atoms on Pd(110) surface,
Ro
¨
der et al. demonstrated the formation of monatomic one-
dimensional Cu chains along the step edges of a Pd(110)
surface [53], Fig. 5. Gambardella et al. demonstrated
high-density parallel arrays of regularly spaced nanowires
by systematically controlling the growth kinetics [54].
They showed regularly spaced monatomic rows of Ag and
Cu along step edges of a Pt(997) surface. Nanowire for-
mation has been demonstrated for other systems including
Cu nanowires on step edges of a Mo(110) surface [55–57]
and Cu nanowires on step edges of a W(110) surface
[55, 58].
Electrodeposition of atoms along the surface step edge
is another useful method for positioning of nanowires on
the substrate. For example, Penner and co-workers utilized
step edges on a graphite surface to produce metallic
molybdenum nanowires [59]. Their approach involved two
steps; first electrodeposition of molybdenum oxide (MoO
x
)
along step edges and reduction of MoO
x
to metallic Mo
wires by hydrogen treatment. Mo wires with diameters
ranging from 15 nm to 1.0 lm and lengths up to 0.5 mm
were produced along the step edges. A similar approach
allowed nanowire formation along the step edges with
other materials such as Fe
2
O
3
,Cu
2
O, and Pd [60, 61]. The
parallel alignment of Pd nanowires formed along the step
edges was utilized by Penner and co-workers to fabricate
hydrogen sensors [60].
Sonication-assisted solution embossing, recently repor-
ted by Stupp and co-workers, is a useful way for a
simultaneous self-assembly, orientation, and patterning of
one-dimensional nanostructures as demonstrated for the
nanofibers of peptide-amphiphile molecules [62]. In their
approach, a stamp made of polydimethylsiloxane (PDMS)
was pressed and held onto a glass or silicon substrate in a
beaker containing peptide-amphiphile nanofibers in water,
trapping the nanofibers between the channels of the stamp
and the substrate. The combined effect of solvent evapo-
ration, ultrasonic agitation, and confinement within the
channels of the PDMS stamp resulted in alignment of
peptide-amphiphile nanofibers parallel to stamp channels.
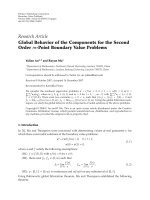
Fig. 4 (A) 3D view AFM image of a homogeneously ordered InAs QD array on flat GaAs surface. (B) Large area AFM image of the same
sample. (C) Height and diameter distributions extracted from the AFM image. (Reprinted with permission from Reference [34]. Copyright 2006
Springer.)
Fig. 5 STM (Scanning Tunneling Microscope) image of monatomic
Cu wires grown on the Pd(110) surface; the one-dimensional copper
chains were grown and imaged at 300 K, the total coverage was
h
Cu
= 0.05 ML. (Reprinted with permission from Reference [53].
Copyright 1993 Macmillan Publishers Ltd.)
Nanoscale Res Lett (2007) 2:519–545 523
123
Its capability of simultaneously orienting and patterning
macromolecules may find many useful applications.
Placement Using Molecular Templates (SAMs)
Self-assembled monolayers (SAMs) are ordered assembly
of organic molecules that spontaneously form on the sur-
face of metals, metal oxides, and semiconductors [63–68].
The surface properties of SAMs can be engineered by
selecting an appropriate tail group of the organic molecules
comprising SAMs or modifying the tail group of existing
SAMs with various techniques. Then, the substrate surface
functionalized with localized patterns of SAMs can serve
as templates onto which nanoscale or microscale building
blocks are selectively attracted. There are many approaches
for producing or modifying SAMs patterns and subsequent
organization of the building blocks into the pattern areas.
Since these are extensively reviewed by others [69–77],
only some major approaches will be briefly described here.
The techniques for creating patterned SAMs can be
categorized into three themes [69, 73]. First is to locally
attach SAMs molecules onto desired substrate locations.
This scheme includes microcontact printing (lCP) [78, 79],
dip-pen nanolithography (DPN) [74, 80], and selective
adsorption of specific SAMs molecules onto pre-defined
substrate patterns [81, 82]. Second approach is to locally
remove SAMs molecules from existing SAMs layer. This
includes selective removal of SAMs using UV light [83,
84], STM-induced localized desorption of SAMs [73, 85,
86], and AFM-assisted localized removal of SAMs [73, 74,
77, 87–89]. For both themes, the exposed surface area
having no SAMs can either be backfilled with other SAMs
molecules or left bare. The third approach is to locally
modify the terminal group of SAMs molecules, followed by
selective functionalization and/or selective attachment of
nanoscale building blocks [73, 88, 90–95].
An example of the first theme (patterning via attaching
SAMs) is the lCP method [78, 79]. In this approach,
organic molecules are inked onto an elastomeric stamp
(typically made of polydimethylsiloxane (PDMS)) and
transferred to the substrate surface by stamping. For
example, alkanethiol molecules can be printed to form
patterned SAMs on gold surfaces. Micrometer or sub-
micrometer resolution patterns can be routinely obtained
with this method. Selective placement of nanoscale or
microscale building blocks onto the SAMs patterns were
demonstrated for nanoscale or microscale particles, carbon
nanotubes, nanowires, proteins, and DNA [96–100
]. In
another approach, target molecules (to-be-deposited mol-
ecules) themselves are inked onto the stamp and directly
printed onto the SAMs-coated substrate surface utilizing
specific binding between the target molecules and tail
groups of SAMs molecules. For example, Whitesides and
co-workers demonstrated patterned placement of biotin and
benzenesulfonamide ligands onto SAMs of alkanethiolates
on gold [101]. The merit of lCP is that it is a parallel
process and allows placement of nanoscale objects over a
large area in very short time. Another merit is that place-
ment of building blocks is possible for flexible or even
curved substrates [102].
Another example of the attaching scheme is dip-pen
nanolithography (DPN), which was pioneered by Mirkin
and co-workers [74, 80]. This method uses an atomic force
microscope (AFM) tip to transport molecules adsorbed on
the tip to precise substrate locations with resolution as high
as a few tens of nanometers. The transported molecules
spontaneously form self-assembled monolayers (SAMs)
and SAMs patterns can be ‘‘written’’ as the AFM tip
migrates across the substrate surface. This patterned area
can be used as templates onto which nanoscale building
blocks are selectively attached. The other way is to directly
print the desired molecules (such as DNA and proteins) by
inking the AFM tip with those molecules [103]. The SAMs
pattern generated by DPN was used to place nanoparticles
[104, 105], proteins [106], virus [107], and carbon na-
notubes [96, 108, 109]. For example, Mirkin, Schatz, and
their co-workers demonstrated placement of singe-walled
carbon nanotubes (SWNTs) onto very thin lines (sub-
100 nm) of SAMs patterns produced by DPN, Fig. 6 [109].
The SAMs patterns were made by writing 16-mercapto-
hexadecanoic acid (MHA) on gold substrate using DPN,
followed by passivating (backfilling) the rest of the surface
with 1-octadecanethiol (ODT). When a drop of 1,2-
dichlorobenzene containing SWNTs was applied on the
substrate, the drop first wetted on the hydrophilic MHA
pattern and then, during subsequent solvent evaporation,
van der Waals interactions between SWNTs and the MHA-
SAM drove the SWNTs to the boundary of MHA-SAM
and ODT-SAM, resulting in well-controlled placement of
SWNTs, Fig. 6. Placement of SWNTs in line shape, ring-
shape, and more complex geometry was realized with sub-
100-nm resolution.
An example of the second theme (patterning via removal
of SAMs) is STM-assisted patterning [73, 85, 86]. There
are several mechanisms for the STM-assisted removal of
SAMs (or combinations of these) including mechanical
removal by tip-surface interactions, electron-beam-induced
degradation or desorption, field ionization, and field-
enhanced surface diffusion. For example, Kim and Bard
demonstrated patterning SAMs of n-Octadecanethiol
(ODT) on a gold surface through mechanical removal by
bringing the STM tip closer to the substrate and employing
a low bias (10 mV) and high tunneling current (10 nA)
[85]. Crooks and co-workers showed patterning of ODT
SAMs with a resolution of 25 nm · 25 nm [86]. AFM can
524 Nanoscale Res Lett (2007) 2:519–545
123
also be utilized to locally remove SAMs [73, 74, 87–89].
The SAMs can be mechanically removed by the AFM tip, a
process sometimes called nanoshaving. For example, Liu
and co-workers demonstrated AFM-assisted removal of
alkanethiol SAMs on a Au surface, followed by selective
attachment of thiol-passivated Au nanoparticles onto
exposed SAMs patterns [89]. Another type of AFM-assis-
ted patterning involves removal of SAMs and simultaneous
oxidation of the exposed substrate surface, named local
oxidation nanolithography (LON) [77, 87]. LON is based
on localized oxidation reaction that occurs within a water
meniscus formed between an AFM tip and the substrate
surface. Lateral resolution of several tens of nanometers
can be obtained with LON [110]. The localized oxide
pattern was utilized as templates to place nanoscale objects
such as single-molecule magnets [87].
The third theme of SAMs patterning involves modifying
the tail group (terminal group). The SAMs tail group can
be locally modified using various techniques such as
focused electron beam irradiation [111, 112], ultraviolet
(UV) light irradiation [93, 94, 113, 114], and AFM [88, 90–
92, 94, 95]. The modified tail group can be used directly as
templates onto which the building blocks attach or further
functionalized by attaching other molecules. For example,
Calvert et al. used deep UV irradiation to modify and
pattern organosilane SAMs [93]. The UV-modified pattern
was further functionalized by reacting with other mole-
cules. The patterned SAMs were utilized as templates
to attract fluorophores, metals, and biological cells such
as human SK-N-SH neuroblastoma cells. Sagiv and
co-workers utilized a conductive AFM tip to locally
modify the SAMs of n-octadecyltrichlorosilane (OTS) on
silicon substrate and selectively attach Au nanoparticles
onto the modified patterns [91]. In this approach, named
constructive nanolithography [90], the voltage bias applied
to the AFM tip induced local electrochemical reaction
converting the terminal group of OTS (–CH
3
) to carboxyl
(–COOH). The tip-inscribed –COOH patterns were further
functionalized with nonadecenyltrichlorosilane (NTS) via
photoreaction and reduction, producing bilayer SAMs
patterns terminated with amine group (–NH
2
; –NH
3
+
),
Fig. 7A. When the substrate was immersed into a colloid
containing negatively charged Au nanoparticles, they
selectively attached onto the amine terminated patterns via
the electrostatic interaction, Fig. 7A. They demonstrated
placement of Au nanoparticles (diameter 17 nm or 2–
6 nm) onto the amine terminated patterns, forming 2D
square arrays, letters, and more complex nanoarchitecture,
Fig. 7C.
As a final note for this section, it is appropriate to point
out that the scanning probe techniques, like other scanning
techniques (e.g. e-beam and ion beam), have a limited
throughput because they are serial processes. Nevertheless,
recent studies employing a large number of probe tips have
demonstrated the practicality of higher throughput pro-
cessing [74, 106, 115–121]. For example, Mirkin and
co-workers designed and fabricated a 55,000-pen 2D array,
with a pen spacing of 90 and 20 lminthex and y direc-
tions, respectively, occupying an area of 1 cm
2
[115, 118].
With this parallel approach, they constructed a 2D array
Fig. 6 AFM tapping mode
topographic images of SWNT
arrays. (A) Parallel aligned
SWNTs with a line density
approaching 5.0 · 10
7
/cm
2
.(B)
Linked SWNTs following MHA
lines (20 lm · 200 nm) spaced
by 2 lm, 1 lm, and 600 nm.
(C) Random line structure,
showing the precise positioning,
bending, and linking of SWNTs
to a MHA affinity template. All
images were taken at a scan rate
of 0.5 Hz. The height scale is
20 nm. (Reprinted with
permission from Reference
[109]. Copyright 2006 National
Academy of Sciences, U.S.A.)
Nanoscale Res Lett (2007) 2:519–545 525
123
composed of 88 million gold dots on silicon wafer [115]. A
massive array of phospholipids has been constructed as
well with a lateral resolution of *100 nm and a throughput
of 5 cm
2
/min [118].
Placement Using Electrostatic Templates
Electrostatic interactions between a charged substrate sur-
face and nanoscale building blocks can be utilized for
controlled placement. This is done by creating charge
patterns, i.e. electrostatic templates, on the substrate sur-
face and letting the building blocks interact with the charge
patterns. Electret materials such as poly(methylmethacry-
late) (PMMA), poly(tetrafluoroethylene) (PTFE), silicon
dioxide, and silicon nitride can hold trapped charges or
polarization for a long time, and charge patterns can be
created on the electret film through direct injection of
electrons, holes, or ions [122–128]. Several methods have
been developed to locally charge the electret surface and
then place the building blocks selectively on the charged
areas. These include methods using electrical microcontact
printing (e-lCP), electron beams, ion beams, and scanning
probe microscopes such as AFM. These techniques will be
reviewed one by one.
Creating Charge Patterns Using Electrical Microcontact
Printing (e-lCP)
Jacobs and Whitesides have developed a method, called
electrical microcontact printing (e-lCP), wherein charge
patterns are created in a thin electret film in parallel pro-
cessing by injecting charges via a flexible metal electrode
in contact with the electret surface [122]. Figure 8
illustrates the concept of e-lCP. A patterned stamp made
of polydimethylsiloxane (PDMS) is coated with a thin Au/
Cr layer and is brought into contact with a thin PMMA film
(80 nm) on doped silicon wafer, Fig. 8A and B. A voltage
pulse is applied between the Au/Cr layer on the PDMS
stamp and the conductive silicon wafer, Fig. 8B. The
PDMS stamp is removed and the PMMA electret retains
charges (positive or negative depending on the polarity of
voltage pulse) in patterns which replicate the patterns on
the PDMS stamp, Fig. 8C. Using this method, they made
patterns of trapped charges at a resolution better than
150 nm in less than 20 s for areas as large as 1 cm
2
.
Selective placement of 500 nm–20 lm particles onto the
micrometer scale charged patterns on PMMA film was
demonstrated.
The e-lCP method was extended to the nanoscale
through improved electrode design that enabled higher
resolution charge transfer to PMMA electret. Barry et al.
was able to place 5–40 nm sized nanoparticles from gas
phase onto a PMMA surface in shapes of lines and squares
with 60 nm lateral resolution [129]. This was accomplished
using a flexible thin Si electrode that was patterned by
phase-shift photolithography and reactive-ion etching, to
produce line widths as small as 50 nm. Another approach to
higher resolution charge transfer has recently been intro-
duced by Whitesides and co-workers [130]. This method
utilizes the nanotransfer printing (nTP) developed by
Rogers and co-workers [131] and produces narrow
(10–40 nm) metal lines only along the edges of raised
features of the PDMS stamp. When e-lCP is used to
transfer charges through these thin metal lines, the area of
charge transfer is greatly reduced as can be seen in the KFM
(Kelvin probe force microscopy [132]) images shown in
Fig. 9A and B. Figure 9C and D show SEM images after
200 nm solfonate-modified PS spheres were selectively
adsorbed on charged patterns shown in Fig. 9A and B,
Fig. 7 Fabrication of a nanoarchitecture made of 2–6 nm Au
nanoparticles selectively attached onto patterned SAMs. (A) Sche-
matic of Au nanoparticle/SAMs structure created by AFM inscription,
further functionalization of inscribed SAMs pattern with NTS, and
selective attachment of Au nanoparticles. (B) The poster, entitled
‘‘World Without Weapons’’, created by Picasso in 1962. This was
translated into an input signal to the conducting AFM tip that
inscribes (contact mode, line width *30 nm) a corresponding pattern
on the top surface of OTS/Si monolayer specimen. (C) AFM
topography image after 2–6 nm Au nanoparticles were deposited on
amine terminated SAMs pattern, showing nanoscale replica of the
poster made of nanoparticles/SAMs. (Reprinted with permission from
Reference [91]. Copyright 2004 American Chemical Society.)
526 Nanoscale Res Lett (2007) 2:519–545
123
respectively. The nanoparticles placed on the size-reduction
pattern, i.e. the pattern in Fig. 9B, yielded structures only
one particle across, Fig. 9D.
Creating Charge Patterns Using Electron Beams
Electron beam irradiation also can create charge patterns
on the electret material. Although electron beam irradiation
is a serial process and, therefore, slow, charge patterns can
be generated with enhanced speed if a low dose electron
beam is used. Joo et al. demonstrated fast charge patterning
employing a low dose electron beam, which was followed
by deposition of positively charged silver nanoparticles via
an electrospray technique [133]. The charged nanoparticles
were selectively deposited onto a charge pattern on PMMA
with a lateral resolution of 0.7 lm, Fig. 10. Since the dose
they used for charge patterning on PMMA was very low
(50 nC/cm
2
), several orders of magnitude lower than typ-
ical e-beam resist dose, this approach holds potential for
controlled placement of nanoscale building blocks for a
large area in a reasonably short time.
Controlled placement of biological molecules, such as
DNA and proteins, was made by exploiting electron beam
induced charge trapping [127, 134]. For example, by
selecting an appropriate electron beam irradiation energy
on glass substrate, Chen and co-workers created a layer
(5–20 nm) of highly localized positive charges at the irra-
diated spot even though the net charge in the region as a
whole was negative [134]. This effect was due to the
escape of secondary electrons, which varies with the inci-
dent electron beam energy [135, 136]. When the glass
substrate with positively charged pattern was immersed in
the DNA solution, the DNA, which are negatively charged,
were selectively attracted onto the positively charged area.
Using this procedure, they demonstrated the placement of
DNA on a glass substrate with lateral resolution of
*50 nm.
Creating Charge Patterns Using Ion Beams
Ion beams are also used as charge sources for creating
patterns on electret films. Once the charged pattern is
produced, oppositely charged nanoscale building blocks
can be selectively adsorbed by immersing in a colloid
containing charged particles, spraying the building blocks
from the gas phases, or attracting them from the solid state
powder form. For example, Fudouzi et al. used a Ga
+
-
focused ion beam (FIB) to draw a charge pattern on a
CaTiO
3
substrate [137]. They made a charged dot array
(dot diameter: *6 lm), with the electric field from the
charged dots being controlled by the Ga
+
ion dose. Using
an appropriate ion dose and choosing appropriate size
microspheres (10 lm polymer spheres), they were able to
place only one particle onto each charged dot. They
attributed this one-particle-per-dot deposition to the
shielding effect: once one particle occupies a charged dot,
it shields the electric field coming from the charged dot,
reducing the effective electric field.
Creating Charge Patterns Using AFM
Atomic force microcopy (AFM) offers another way to
deposit localized charges on electret films [124, 125, 138,
139]. In this approach, a conducting AFM tip is positioned
on the surface of a thin electret film which is deposited on a
conducting substrate. When voltage pulses are applied
between the conducting AFM tip and the substrate, local-
ized charges can be deposited in the electret film.
Depending on the polarity of the voltage pulses, either
positive or negative charges can be deposited. This is a
Fig. 8 Principle of electrical microcontact printing (e-lCP). (A) The
flexible, metal-coated stamp is placed on top of a thin film of PMMA
supported on a doped, electrically conducting Si wafer. (B)An
external voltage is applied between the Au and the Si to write the
pattern of the stamp into the electret. (C) The stamp is removed; the
PMMA is left with a patterned electrostatic potential. (Reprinted with
permission from Reference [122]. Copyright 2001 American Asso-
ciation for the Advancement of Science.)
Nanoscale Res Lett (2007) 2:519–545 527
123
very attractive feature of AFM assisted patterning since it
can create a combination of positively and negatively
charged patterns on a same substrate by just varying the
voltage pulse polarity. The amount of charge deposited and
the area of the localized charge can be controlled by
varying the height of the voltage pulses; with increasing
pulse height, the amount of deposited charge and charged
area increases [138]. The charge area also depends on the
tip geometry and quality. With their best tips, Mesquida
and Stemmer obtained a lateral resolution of *100 nm
using poly(tetrafluoroethylene) (PTFE) as an electret, as
verified by the surface potential image acquired with KFM
[138]. On the charge patterns created with AFM, they were
able to selectively deposit 290 and 50 nm silica beads.
With AFM under high-vacuum conditions (*1 · 10
–6
Torr) and using a layered structure, Si
3
N
4
/SiO
2
/Si (NOS),
as an electret film, Gwo and co-workers were able to write
charge patterns with a lateral resolution of *30 nm [139].
Figure 11A shows a schematic of their experimental setup
for writing and sensing charge patterns with nanoscale
resolution. Figure 11B and C show KFM images demon-
strating the capability of patterning with a minimum
feature size of *30 nm. The darker and brighter regions
correspond to electron and hole injections, respectively. If
one charged dot is used as one bit in the application of a
charge storage device, this lateral resolution corresponds to
*500 Gbit/in
2
. The charge patterns can serve as electro-
static templates onto which charged nanoscale building
Fig. 9 Size-reduction of charge
transfer area exploiting nTP and
its application to nanoparticle
placement. (A–B) KFM (Kelvin
probe force microscopy [132])
images obtained from the e-lCP
of metal-coated PDMS stamps
without using nTP (A) and with
using nTP (B). (C–D) SEM
images of nanoparticle
adsorption over the pattern of
charge shown in (A) and (B),
respectively. The nanoparticles
are 200 nm sulfonate-modified
PS spheres. The size-reduction
pattern, (D), yields structures
only one particle across.
(Reprinted with permission
from Reference [130].
Copyright 2005 Wiley-VCH.)
Fig. 10 SEM images after positively charged silver nanoparticles
were sprayed onto the negatively charged e-beam pattern. About
0.7 lm thick lines were generated over a large area with doses as low
as 50 nC/cm
2
, showing the feasibility of ultrafast patterning by
electrostatic lithography. (A) Scale bar = 50 lm. (B) Scale bar = 10
lm. (Reprinted with permission from Reference [133]. Copyright
2006 AVS The Science & Technology Society.)
528 Nanoscale Res Lett (2007) 2:519–545
123
blocks can be selectively adsorbed. Figure 12 shows
controlled placement of thiol-terminated 5 nm Au nano-
particles that are selectively adsorbed onto negatively
charged line patterns with *30 nm resolution.
DNA-Programmed Placement
DNA is a remarkable molecule that stores all the genetic
information required for proper functioning and reproduc-
tion of living organisms. The important feature of DNA is
the capability of molecular recognition through the Wat-
son–Crick base paring, in which, through hydrogen
bonding, Adenine (A) binds specifically to Thymine (T)
and Guanine (G) to Cytosine (C). In addition, the DNA is a
nanoscale molecule; for double-helical B-DNA, the diam-
eter is about 2 nm and its helical pitch is about 3.4 nm
[140–142]. The molecular recognition capability of DNA
as well as its nanoscale dimension has been utilized as a
powerful tool for programmed arrangement of various
nanoscale building blocks. The key to this approach is to
design DNA motifs that contain molecular recognition
parts which can specifically combine with other DNA
motifs in a selective and programmable manner. Conju-
gating nanoscale building blocks such as nanoparticles,
proteins, ions, and organic/inorganic molecules with the
DNA motifs can lead to the well-defined arrangement of
nanoscale building blocks. This DNA-programmed
assembly of nanoscale building blocks is a fascinating
emerging field with high potential for bottom-up con-
struction of nanoscale devices and sensors. Here we present
several examples of recent successful studies. The inter-
ested reader may also look at excellent reviews and the
references therein [140–150]. In this section, we first
introduce DNA-assisted assembly using single-stranded
DNA (ss-DNA), which leads to formation of linear arrays
of nanoscale building blocks. We then briefly describe the
key aspects of artificial DNA motifs (DNA tiles), which are
more rigid than ordinary DNA, can be assembled into
crystals, and are suitable as scaffolding for nanoscale
building blocks. We then review programmed assembly of
nanoscale building blocks that utilize DNA crystals as
scaffolds. Several successful studies will be presented as
examples.
Because ss-DNA is topographically of one-dimension, it
is natural to try to utilize it for assembly of linear arrays of
nanoscale building blocks. Many studies over the last
decade have demonstrated that this approach is successful.
For example, Niemeyer et al. used DNA–protein conjugate
motifs to form linear protein arrays [148, 151–153]. They
first made STV–ssDNA (streptavidin–single-stranded
DNA) conjugates through covalent coupling between STV
and thiol terminated short ss-DNA. These STV–ssDNA
motifs were then hybridized with a long ss-DNA that
contains sections with sequences complementary to those
of the short DNA in STV–ssDNA. This led to the pro-
grammed formation of a linear streptavidin array along the
long ss-DNA. This approach is not limited to streptavidin,
but can be applied to many nanoscale objects that can bind
to ss-DNA. For example, Matsuura et al. demonstrated
one-dimensional assembly of galactose [154], Waybright
et al. showed the assembly of organometallic compound
Fig. 11 Charge writing and sensing with nanoscale resolution. (A)
Schematic of the experimental setup. (B) KFM images of high areal
density (*500 Gbit/in
2
) charge bits injected into an NOS (30 A
˚
Si
3
N
4
/22A
˚
SiO
2
/Si) ultrathin film. The darker and brighter regions
were injected with electrons and holes, respectively. (C) KFM image
and cross-sectional KFM line profile of charge bits. (Reprinted with
permission from Reference [139]. Copyright 2006 Wiley-VCH.)
Fig. 12 SEM images of selectively adsorbed Au nanoparticles. The
images show that thiol-terminated 5 nm Au nanoparticles can be
selectively adsorbed onto negatively charged line patterns at a line-
width resolution of 30 nm. (Reprinted with permission from Refer-
ence [139]. Copyright 2006 Wiley-VCH.)
Nanoscale Res Lett (2007) 2:519–545 529
123
arrays [155], and various nanoparticle arrays were also
demonstrated by other groups [156–158].
For more complex assemblies in two- or three-dimen-
sional forms, the ordinary DNA is not appropriate as a
building unit because it is topographically one-dimensional
and it is not mechanically stiff enough. However, artificial
DNA has been designed and fabricated which is suitable
for systematic and robust assembly of DNA arrays in two-,
and three-dimension [140, 142, 147, 159–162]. The key to
this approach, which was pioneered by Seeman, is to
design DNA motifs or DNA ‘‘tiles’’ that are mechanically
robust and contain molecular recognition parts, called
sticky ends, which can specifically fit together with the
complementary sticky ends of other DNA tiles, much like
mating Lego pieces. (A sticky end is a short single-stran-
ded DNA portion protruding from the end of double-
stranded DNA [142]. A sticky end can combine with
another sticky end only if their base sequences are com-
plementary to each other, much like a key and lock fit
together.) The artificial DNA motifs were made using a
process called reciprocal exchange, in which two DNA
strands are juxtaposed, nicked, and rejoined, leading to a
crossover of the two original strands [147, 163]. Various
robust artificial DNA motifs with programmed sticky ends
have been made using reciprocal exchange. An example is
shown in Fig. 13 where DNA double-crossover (DX) units
were synthesized and used for construction of two-
dimensional DNA arrays [142]. The DX units were made
through two reciprocal exchanges between two double-
stranded DNA molecules [147, 159, 163]. When two dif-
ferent DX molecules (A and B* in Fig. 13B) were linked
together through complementary sticky ends, well-orga-
nized two-dimensional DNA arrays (2D DNA crystals)
were made, Fig. 13C and D. Many other types of artificial
DNA motifs were also synthesized. For example, DNA
triple-crossover (TX) molecules were made in which three
double-stranded DNA helices are linked together [147,
163, 164]. Using artificial DNA motifs as building tiles
(having different sequences, sizes, and shapes), various
two-dimensional DNA crystals have been assembled [161,
162, 164–168].
Programmable DNA tiles and their assembly into
crystals can be exploited to construct arrays of various
nanoscale building blocks. This has been accomplished by
employing the DNA crystals as scaffolds onto which
nanoscale building blocks systematically attach. This
may be done either by post-attachment of the building
blocks on the pre-existing DNA scaffolds or by pre-
attachment of the building blocks to DNA tiles, forming
DNA-building block conjugates, followed by the DNA-
programmed assembly of the DNA-building block conju-
gates. Using these approaches, various building blocks
were controllably assembled, including arrays of proteins
[165, 167, 169–171] and nanoparticles [168,
171–173]. A
few examples of these recent studies are presented below.
Yan, LaBean, and their co-workers demonstrated self-
assembly of streptavidin arrays using DNA scaffolds [165].
They first designed and constructed DNA tiles that were
made of four four-arm DNA branched junctions (4 · 4
DNA tiles), consisting of multiple DNA strands, pointing
in four directions (north, south, east, and west in the tile
plane). These 4 · 4 DNA tiles were self-assembled,
through the Watson–Crick base paring at the sticky ends,
Fig. 13 Two-dimensional DNA arrays. (A) Schematic drawings of
DNA double crossover (DX) units. In the meiotic DX recombination
intermediate, labeled MDX, a pair of homologous chromosomes, each
consisting of two DNA strands, align and crossover in order to swap
equivalent portions of genetic information; ‘HJ’ indicates the
Holliday junctions. The structure of an analogue unit (ADX), used
as a tiling unit in the construction of DNA two-dimensional arrays,
comprises two red strands, two blue crossover strands and a central
green crossover strand. (B) The strand structure and base pairing of
the analogue ADX molecule, labeled A, and a variant, labeled B*. B*
contains an extra DNA domain extending from the central green
strand that, in practice, protrudes roughly perpendicular to the plane
of the rest of the DX molecule. (C) Schematic representations of A
and B* where the perpendicular domain of B* is represented as a blue
circle. The complementary ends of the ADX molecules are
represented as geometrical shapes to illustrate how they fit together
when they self-assemble. The dimensions of the resulting tiles are
about 4 · 16 nm and are joined together so that the B* protrusions lie
about 32 nm apart. (D) The B* protrusions are visible as ‘stripes’ in
tiled DNA arrays under an atomic force microscope. (Reprinted with
permission from Reference [142]. Copyright 2003 Macmillan Pub-
lishers Ltd.)
530 Nanoscale Res Lett (2007) 2:519–545
123
into an array of nanogrids (schematic in Fig. 14A). The
nanogrid array was then modified by incorporating a biotin
group into the center of each 4 · 4 DNA tile. When
streptavidin was added to the solution of the biotin-modi-
fied nanogrids array, the streptavidin combined with the
biotin, resulting in a well-defined streptavidin nanoarray,
Fig. 14.
Nanoparticle arrays were also constructed through
DNA-programmed assembly. For example, Le et al. dem-
onstrated programmed assembly of Au nanoparticles by
hybridizing DNA-functionalized Au nanoparticles with
pre-assembled 2D DNA scaffolds on a mica surface [173].
In their approach, they first designed and fabricated four
distinct DNA double-crossover (DX) tiles (tile type: A, B,
C, and D; dimension: *2nm· 4nm· 16 nm) using 21
synthetic DNA strands. The DX tiles contained sticky ends
whose sequences were designed such that they can self-
assemble into a 2D DNA crystal (schematic in Fig. 15C)
where each tile type forms a row and each row comes
together in a repeated sequence of A, B, C, and D.
In Fig. 15C, the DX tile B (red) contained an extended
single-stranded DNA feature onto which a DNA–Au
nanocomponent was able to bind. The DNA–Au nano-
components were separately prepared by functionalizing
5 nm Au nanoparticles with thiolated single-stranded DNA
via well-known thiolate-Au conjugation [69]. When a
droplet containing DNA–Au nanocomponents was depos-
ited onto a pre-assembled 2D DNA crystal, the DNA–Au
nanocomponents were selectively attached to DX tile B’s
via DNA hybridization, leading to self-assembly of 5 nm
Au nanoparticles as evidenced by AFM and TEM images
in Fig. 15A and B, respectively.
The 2D DNA crystal architecture composed of four tiles
A, B, C, and D (called an ABCD tile array, like the one in
Fig. 15C) has been utilized for construction of 2D arrays of
other nanoscale entities. For example, Williams et al.
demonstrated assemblies of 2D peptide arrays and 2D
peptide–antibody arrays, Fig. 16 [169]. They used the four
DNA tiles described above, except that tile B did not contain
an ss-DNA extension, but tile D contained two extensions of
DNA capture probes. The DNA capture probe (schematic in
Fig. 16A) is a ss-DNA designed to capture a myc-peptide
fusion, a conjugate formed by covalent linking between a
ss-DNA and a myc-peptide. The sequence of ss-DNA in the
myc-peptide fusion is complementary to that of the DNA
capture probe, leading to a programmed binding between
them, Fig. 16B. An anti-myc antibody can then bind to an
myc-peptide through peptide–antibody interaction, Fig. 16
C. Figure 16D–F show AFM images of sequential con-
struction of 2D arrays, starting from the formation of a DNA
crystal (Fig. 16D), an array of the myc-peptides (Fig. 16E),
and an array of peptide–antibody conjugates (Fig. 16F). The
AFM height profiles in Figs. 16G–I show the step-by-step
increase of the heights due to the capture of the myc-peptide
fusions and subsequent binding of the anti-myc antibodies to
the myc-peptides.
Previous examples demonstrate assembly of nanoscale
building block arrays that were made through post-place-
ment of building blocks onto pre-assembled DNA crystal
scaffolds. An alternative scheme is to prepare ss-DNA-
building block conjugates first, followed by incorporation
of the conjugates into DNA tiles and eventually into a
DNA crystal. This leads to programmed placement of
nanoscale building blocks onto specific sites in a DNA
crystal. For example, Xiao et al. demonstrated self-
assembly of metallic nanoparticle arrays using ss-DNA–
nanoparticle conjugates [174]. They designed 22 different
types of ss-DNA which form four types of DX tiles
(referred to A, B, C, and D). Au nanoparticles of 1.4 nm in
diameter were used to form DNA–nanoparticle conjugates
Fig. 14 Self-assembly of protein arrays templated by 4 · 4 DNA
nanogrids. (A) Schematic drawing of the DNA nanogrids scaffolded
assembly of streptavidin. (Left) The DNA nanogrids, a biotin group is
incorporated into one of the loops at the center of each tile. (Right)
Binding of streptavidin (represented by a blue tetramer) to biotin will
lead to protein nanoarrays on DNA lattices. (B) AFM image of the
self-assembled protein arrays. (Reprinted with permission from
Reference [165]. Copyright 2003 American Association for the
Advancement of Science.)
Nanoscale Res Lett (2007) 2:519–545 531
123
through covalent bonding between the Au nanoparticles
and one type of ss-DNA which was modified with a thiol.
These conjugates were then specifically incorporated into
tile B during tile formation. When the DNA tiles self-
assembled to a 2D DNA crystal, a 2D Au nanoparticle
array having programmed nanoscale separations (4 and
64 nm in x and y direction, respectively) was constructed.
Other examples include recent demonstration of pro-
grammed assembly of 5 and 10 nm Au nanoparticles into a
2D rhombic pattern by Zheng et al. [168]. They designed
and constructed triangular DNA motifs (termed 3D DX
triangles) that were composed of three DX molecules
forming a triangle. For each motif (3D DX triangle), two
DX molecules were designed to form a rhombic DNA
crystal, with one remaining DX molecule being used for
attachment of a 5 or 10 nm Au nanoparticle. Self-assembly
of the 3D DX triangles into a DNA crystal led to a for-
mation of a precisely positioned nanoparticle array in
rhombic pattern.
Placement Using Dielectrophoresis
Dielectrophoresis is the movement of uncharged objects in a
liquid dielectric medium under the influence of a
non-uniform electric field [175]. Dielectrophoresis origi-
nates from the induced dipole moment of an object, whose
value depends on the dielectric and electrical properties of
both the object and the surrounding medium. With an
appropriate design of the non-uniformity of the electric field,
the movement of an object can be manipulated, allowing
controlled placement onto specific locations and/or align-
ment in a particular direction. Dielectrophoresis has been
extensively studied as a promising tool for manipulating
various nanoscale or microscale objects such as nanowires,
carbon nanotubes, nanoparticles, DNA, proteins, cells,
bacteria, and viruses [176–188]. Recently, a lot of effort has
been made to utilize dielectrophoresis for controlled place-
ment/alignment of nanoscale building blocks for fabrication
of nanoelectronic devices or sensors, where precise place-
ment of the building blocks onto addressable locations is
required on a large scale. A brief review of these advances is
given here.
The dielectrophoretic force is governed by many factors;
the complex dielectric constant of an object and that of
surrounding medium, the geometry of the object, the mag-
nitude and frequency of the applied electric field, and the
spatial distribution of the electric field. For an AC bias, the
time-average dielectrophoretic force on a cylindrical object
with diameter r and length l, hFi, is given by [189–191]
Fig. 15 Visualization of the DNA–Au nanocomponent arrays. (A)
Topographical AFM image of an assembled array providing a 3D
visualization of the assembled DNA–Au nanocomponents, DNA
marker rows, and DNA scaffolding. (B) TEM image of the
nanocomponent array. The high-contrast particles in the image
measure 6.2 ± 0.8 nm in diameter. (C) Schematic of DNA–Au
nanocomponent arrays. DX tile color: blue, red, green, and yellow for
DX tiles A, B, C, and D, respectively. DX tile B (red) contains an
extended single-stranded DNA feature that hybridizes to comple-
mentary single-stranded DNA in the DNA–Au nanocomponent. DX
tile D (yellow) includes extended structures composed of DNA
hairpins above and below the crystal plane, which are used as
topographical markers on the DNA crystal. (Reprinted with permis-
sion from Reference [173]. Copyright 2004 American Chemical
Society.)
532 Nanoscale Res Lett (2007) 2:519–545
123
F
hi
=
1
2
pr
2
le
m
RefK(x)grE
rms
jj
2
; ð1Þ
where
KðxÞ¼ðe
Ã
obj
À e
Ã
m
Þ=e
Ã
m
: ð2Þ
E
rms
is the root mean square value of the electric field and
e
m
is the dielectric constant of the medium. e
obj
*
and e
m
*
are
complex dielectric constants for the object and the
medium, respectively. The complex dielectric constant e
*
is a function of bias frequency x, dielectric constant e, and
conductivity r, and is given by
e
Ã
¼ e À ir=x: ð3Þ
Equations 1–3 provide the fundamental basis for control-
ling the dielectrophoretic forces exerted on the objects.
With appropriate choice of parameters (electric field gra-
dient, frequency, dielectric medium, etc.), controlled
placement and/or alignment of nanoscale and microscale
building blocks have been accomplished.
Using AC bias with frequency above 1 MHz, Nagahara
et al. was able to place single-walled carbon nanotubes
(SWNTs) between two metal electrodes separated by a few
tens of nanometers [178]. In addition, they found that when
high frequency ([1 MHz) AC bias was used, very few
contaminants were attached to the substrate although the
aqueous SWNT solution generally contains a lot of impu-
rities such as amorphous carbons. They attributed this
selective placement of SWNTs over contaminants to the
influence of frequency on the dielectrophoretic forces as
expressed in the Eqs. 1–3; at higher frequencies, the K(x)
(therefore hFi) is proportional to the dielectric constant
difference, e
obj
– e
m
. If the difference is larger for SWNTs,
then the dielectrophoretic force hFi for SWNTs would be
larger than that for the contaminants, leading to selective
attraction of SWNTs. In addition, under AC bias, the time-
averaged force exerted on any charged objects becomes
zero and no effective attractive forces are applied to the
charged impurities. Their observation was in agreement
with results from other groups [180, 192]. For example,
Chen and co-workers studied the effect of the frequency of
AC bias on the alignment of SWNTs [192]. They observed
increasing SWNTs alignment and decreasing contaminants
as frequency was increased from 0 (DC) to 5 MHz. Krupke
and co-workers reported excellent and reproducible align-
ment of single carbon nanotube bundles with AC frequency
over 1 kHz, Fig. 17 [180]. Similar studies have been car-
ried out for nanowires of various materials including Au,
Ag, GaN, SnO
2
,Ga
2
O
3
, CdSe, and SiC [188, 190, 191,
193].
Beyond the capability of positioning carbon nanotubes
or nanowires between electrode pairs, for practical
Fig. 16 AFM imaging of the
peptide nanoarrays. (A–C)
Schematic illustration showing
the DNA capture probe on the
DNA surface, annealed to the
myc-peptide fusion, and
immunocaptured by the anti-
myc antibody, respectively. (D–
F) AFM images were collected
for the array before
hybridization of the myc-
peptide fusion, after
hybridization of the myc
peptide, and following
incubation with the anti-myc
antibody, respectively. (G–I)
Height profiles were determined
for the array, the array
displaying the myc-peptide
epitope, and the array with the
anti-myc antibody bound to the
myc epitope, respectively.
(Reprinted with permission
from Reference [169].
Copyright 2007 Wiley-VCH.)
Nanoscale Res Lett (2007) 2:519–545 533
123
realization of nanoscale devices and sensors, more chal-
lenging requirements must be met. First, every electrode
pair should be bridged by only a single nanotube/nano-
wire. Second, positioning of single nanotubes/nanowires
over electrode pairs should be done simultaneously over a
large area in parallel processing. A lot of effort, and with
significant progress, has been made to meet these chal-
lenges over the past few years. For example, Chung et al.
explored placing multi-walled carbon nanotubes
(MWNTs) between a pair of opposing electrodes sepa-
rated by a gap [179]. They studied the effect of
combining DC and AC electric fields on positioning of
MWNTs and found that the ratio of DC versus AC field
affects the degree of alignment, the separation between
adjacent MWNTs deposited between electrodes, and the
degree of contaminant deposition. With an appropriate
electrode design and an optimized DC/AC ratio (AC
frequency fixed at 5 MHz), they were able to place a
single MWCT onto each electrode pair with a 90% yield
as demonstrated for an array of 100 electrode pairs. They
attributed this controlled placement of single MWNTs to
a combined result of a dielectrophoretic force, an elec-
trophoretic force, and a mechanical flow of ions generated
by electrokinetic force. Upon bridging of an electrode pair
by a single MWNT, these forces dramatically change and
prevent the approach of other MWNTs, leading to single
MWNT placement per electrode pair.
Krupke and co-workers utilized dielectrophoretic forces
for simultaneous and site-selective placement of single
bundles of SWNTs onto an array of electrode pairs [177].
With AC bias, typically V
p-p
= 1 V and frequency at
1 MHz, they showed that *70% of the electrode pairs
were bridged by SWNT bundles, of which more than 50%
were by single bundles. This self-limiting positioning of
single bundles was attributed to the change of electric field
upon bridging of an electrode pair [194]. An additional
important finding of this study is that only metallic or
quasi-metallic SWNTs were attracted to the electrodes,
whereas semiconducting SWNTs were repelled. This was
attributed to the fact that at high AC frequency the dielec-
trophoretic force is proportional to the difference of
dielectric constants of carbon nanotubes and solvent med-
ium, e
CNT
– e
m
,wheree
CNT
is the dielectric constant of
nanotubes and e
m
that of the solvent medium (see Eqs. 1–3).
They used N,N-dimethylformamide (DMF) as solvent,
whose dielectric constant e
m
is 39. At the 1 MHz frequency
they used, the dielectric constant e
CNT
for metallic SWNTs
is much larger than 39, whereas it is less than 5 for semi-
conducting SWNTs [195]. This led to the attraction of
metallic SWNTs to the electrodes, but repulsion of semi-
conducting SWNTs from the electrodes. Combined with a
technique to well disperse individual SWNTs [196], this
capability of dielectrophoretic forces to selectively position
metallic SWNTs was exploited to separate metallic
SWNTs from the usual mixture of metallic and semicon-
ducting SWNTs [176].
A significant advance was made recently for directed
positioning of carbon nanotubes. Using AC dielectropho-
resis and systematic electrode design, Krupke and
co-workers were able to position single SWNTs across
electrode pairs over a large area with more than 90% yield
[194]. The density of the SWNT arrays was also very high,
in the order of 3–4 million SWNTs per cm
2
. This high
density was possible due to the systematic design of elec-
trodes (along with an appropriate choice of gate oxide
thickness), where the biasing electrodes were all connected
to one AC source, while counter electrodes were floated
and capacitively coupled to a gate electrode. Most of the
electrode pairs were bridged by a single SWNT or a single
nanotube bundle. Figure 18A shows a representative image
of the whole array, where each of the five adjacent elec-
trode pairs was connected by exactly one nanotube. This
was attributed to the self-limiting behavior in nanotube
bridging: when a nanotube assembles into an electrode pair
and makes electrical contact with the two electrodes, the
dielectrophoretic force fields change incisively, preventing
other nanotubes from approaching. They performed
numerical simulations of the dielectrophoretic forces using
the finite element method (FEM). Figure 19B, D and A, C
compare rE
2
, hence the dielectrophoretic forces hFi (see
Eq. 1), with and without the presence of a nanotube
bridging two electrodes, respectively. In the absence of
nanotubes, the dielectrophoretic forces are attractive in all
regions, while the forces become repulsive between elec-
trodes when a nanotube bridges the electrodes.
Fig. 17 Scanning electron micrograph of a single bundle of carbon
nanotubes trapped on four Au electrodes. The alternating electric field
has been generated between the upper right and lower right
electrodes. The other two electrodes were at floating potential. The
bundle diameter is 9 nm. (Reprinted with permission from Reference
[180]. Copyright 2003 Springer.)
534 Nanoscale Res Lett (2007) 2:519–545
123
As we briefly discussed, dielectrophoresis is emerging
as a powerful tool to manipulate and position individual
nanoscale objects, especially one-dimensional entities such
as nanowires and carbon nanotubes. In particular, the
capability of self-limiting deposition and that of large area
positioning in parallel processing are important character-
istics of this method, making it a candidate for practical
fabrication of nanoelectronic devices or sensors.
Non-close-packed (ncp) Patterns of Spherical Particles
Self-assembly of nanoscale and microscale spherical par-
ticles into two-dimensional ordered form has been
extensively explored by many researchers exploiting cap-
illary forces, spin coating, and controlled solvent
evaporation [16, 197–203]. In these types of self-assembly,
the structure is usually limited to the hexagonal close-
packed (hcp) structure. For many applications, it is desir-
able to have non-close-packed (ncp) arrays. Yang and
co-workers have developed a method which can form ncp
arrays of colloidal spheres by controllably deforming the
substrates supporting the spheres [204, 205]. In their
approach, they first fabricated a three-dimensional hcp
array of silica spheres via controlled solvent evaporation of
a silica suspension. Then, by using lift-up soft lithography,
a top single layer of hcp spheres was transferred to the
surface of a PDMS film. This PDMS film was subsequently
swollen with a solution of toluene in acetone, transforming
the hcp array of silica spheres on the PDMS surface into a
ncp array. The lattice spacing of this ncp array was readily
tuned by varying toluene concentration. A *50% increase
in the lattice spacing was demonstrated using pure toluene.
Finally, using the lCP (micro contact printing) technique,
the two-dimensional ncp array of silica spheres on the
deformed PDMS film was then transferred to the surface
of a substrate that was spin-coated with a thin film of
poly(vinyl alcohol) (PVA), producing an ncp array on the
PVA-coated substrate.
In another approach, ncp arrays with lattice structures
other than hexagonal were obtained by mechanically
stretching the sphere-coated PDMS elastomers instead of
swelling. Figure 20A shows a schematic of this approach
and Fig. 20B shows an example where a square ncp array of
spheres was obtained by stretching the PDMS film along
one direction (y-direction) while maintaining the length in
the orthogonal direction (x-direction). An array of parallel
lines was formed by stretching the PDMS film in the
x-direction, Fig. 20A and C. Using a patterned PDMS stamp
and stretching, patterned ncp arrays of spheres were also
generated, Fig. 20D. These ncp arrays of colloidal spheres
may find application in areas such as optics, photonics,
surface patterning, and growth templates [20, 201, 202].
Fig. 18 (A) Zoom-in of the electrode array showing five adjacent
devices, with each electrode pair bridged by one carbon nanotube,
visible as fine white lines within the dark central areas. The dark areas
are due to contrast enhancement while scanning the zoomed-in area
around each device. (B) Atomic force microscopy image of one such
device. The height profile confirms the bridging by an individual
nanotube. (Reprinted with permission from Reference [194]. Copy-
right 2007 American Chemical Society.)
Fig. 19 Simulation of dielectrophoretic force fields. Simulated map
of rE
2
in a volume around the electrodes for two orthogonal cross-
sections. (A, B) rE
2
at the surface of the substrate (X–Y plane at
Z = 0). (C, D) rE
2
perpendicular to the substrate (X–Z plane at
Y = 0). The arrows indicate the direction of the force acting on a
highly polarizable nanotube–surfactant hybrid and, hence, the direc-
tion of nanotube motion. The background color is the magnitude of
rE
2
. The dielectrophoretic force is attractive in all regions in the
absence of deposited nanotubes (A, C), while the force becomes
repulsive between the electrodes, once a nanotube (magenta line) has
been deposited (B, D). (Reprinted with permission from Reference
[194]. Copyright 2007 American Chemical Society.)
Nanoscale Res Lett (2007) 2:519–545 535
123
Mo
¨
ller and co-workers utilized micellar block copoly-
mers to generate ncp arrays of metal and metal-oxide
nanoparticles [203]. In this approach, they first generated
polymeric micelles by dissolving poly(styrene)-block-
poly(2-vinylpyridine) (PS-b-P2VP) block copolymers in
toluene, Fig. 21. When metal precursors, such as HAuCl
4
,
were added, the metal ions were reduced at the micelle
cores in such a way that exactly one elemental or oxidic
particle was formed in each micelle, Fig. 21. A close-
packed monolayer hexagonal array of the micelles was
then formed by dipping a substrate into a dilute solution
of the micelles (velocity: 40 mm/min) and pulling it out of
the solution (velocity: 10 mm/min). Then the polymers
wrapping the nanoparticles were removed using oxygen
plasma, resulting in an ncp array of nanoparticles. Fig-
ure 22A is an AFM image in which a monolayer of close-
packed micelle arrays was formed on a glass substrate
from a PS(1700)-b-P[2VP(HAuCl
4
)
0.3
(450)] solution. In
this AFM image, the bright spots are from the elevations
where the Au nanoparticles are located at the center of
each micelle. After the polymers were removed by oxygen
plasma (as can be seen from the height reduction from
35 nm to 8 nm in the AFM height profiles at the bottom
of Fig. 22), an ncp array of gold nanoparticles was cre-
ated, Fig. 22B. More importantly, this approach allowed
the control of nanoparticle sizes as well as the interparticle
spacing; the nanoparticle sizes were controlled between
1 nm and 15 nm by varying the concentration of metal
precursors, and the interparticle distance was varied
between 30 nm and 140 nm by using block copolymers
with differing block lengths.
Focused Placement
For the various placement strategies discussed thus far, the
placement precision is, at best, determined by the precision
with which the templates (physical, molecular, or electro-
static) are defined on the substrate. Recently, there has been
a lot of effort to develop new strategies that enable
placement with much higher precision than the templates
are defined [206]. These strategies have a common theme,
which may be termed ‘‘focused placement’’, since the
nanoscale building blocks are guided or focused onto tar-
geted locations via electrostatic or mechanical forces. An
analogy may be found in the operation of an electron
microscope, where electron beam can be focused with sub-
nanometer resolution although the guiding electromagnetic
lenses are defined on the centimeter scale. In this section,
we will review some recent advances in this approach
including (1) electrostatic funneling, (2) directed assembly
using molecular gradient patterns, (3) electrodynamic
focusing of charged aerosols, and (4) guided placement
Fig. 20 (A) A schematic
illustration of the 2D ncp sphere
arrays with new crystal lattices
formed by stretching the PDMS
film along one direction while
maintaining the length in the
orthogonal direction; SEM
images of 2D ncp arrays on
PVA-coated substrates with (B)
square lattice, (C) parallel
single sphere-wires; and (D)
ordered array of parallel lines of
the 2D ncp array. Insets in the
right display the corresponding
FFT images. A high magnified
view of (D) is shown in the left
inset (the scale bar is 2 lm).
(Reprinted with permission
from Reference [204].
Copyright 2005 American
Chemical Society.)
Fig. 21 Schematic drawing of the micelle formation of poly(sty-
rene)-block-poly(2-vinylpyridine) (PS-b-P2VP) block copolymers in
toluene. After complexation of HAuCl
4
to the pyridine units in the
micellar core, the metal compound can be reduced to the zero-valent
state by chemical conversion, leading to exactly one gold particle in
each block copolymer micelle. (Reprinted with permission from
Reference [203]. Copyright 2000 American Chemical Society.)
536 Nanoscale Res Lett (2007) 2:519–545
123
combining capillary effect and electrostatic forces. In
addition, precision placement of nanoparticles utilizing
polymer micelles via template-assisted placement will be
presented. Although this scheme might not be considered
as truly focused placement, we will discuss this approach in
this section because the nanoparticle placement is confined
to a small area in the center of a template, allowing pre-
cision placement using much coarser templates.
Electrostatic Funneling
One of the recently developed focused placement schemes
utilizes long-range ([*100 nm) electrostatic interactions
between charged nanoscale building blocks and a charged
surface in a solvent medium. In the approach developed by
Koh and co-workers, named ‘‘electrostatic funneling’’, the
substrate surface is charged with an appropriate combina-
tion of positively and negatively charged regions, and the
combined electrostatic forces guide charged nanoparticles
onto focused locations with nanoscale precision [82]. One
example of the electrostatic funneling scheme is illustrated
in Fig. 23, in which negatively charged nanoparticles are
guided by a series of parallel lines that are functionalized
alternatively with positively and negatively charged SAMs.
This configuration produces maxima and minima in the
interaction energy, creating a gradient in the interaction
energy, Fig. 23A. The lateral forces generated by the
interaction energy gradient push the charged nanoparticles
onto the center region of the oppositely charged lines,
where the interaction energy is minimum, resulting in the
focused placement, Fig. 23B.
The effectiveness of electrostatic funneling has been
demonstrated for a variety of geometries. Figure 24A shows
an SEM image of Au nanoparticles (* 20 nm diameter)
placed along the center of the silicon oxide lines (dark). The
silicon oxide lines were functionalized with SAMs of (3-am-
inopropyl)triethoxysilane (APTES, (C
2
H
5
O)
3
–Si–(CH
2
)
3
–
NH
2
), which were positively charged in aqueous solution
[65, 69]. The bright lines are gold functionalized with 16-
mercaptohexadecanoic acid (MHA, HS–(CH
2
)
15
–COOH),
which were negatively charged in aqueous solution [65, 69].
The placement precision was as good as *5 nm as obtained
from measuring the deviation of each nanoparticle from the
centerline of the silicon oxide lines (from total 217 nano-
particles including all outliers). It is important to note that
this nanometer scale precision was obtained over a large area
even though the electrostatic guiding structure (silicon oxide
and gold lines) was defined on a much coarser scale (line
width *100 nm) using conventional CMOS fabrication
processes.
This electrostatic funneling scheme works for other
geometries as long as appropriate guiding structures are
created. For example, when the guiding structures are
Fig. 22 (A) AFM topography image of a monomicellar film cast
from a PS(1700)-b-P[2VP(HAuCl
4
)
0.3
(450)] solution onto a glass
substrate. The polymer micelles form a close-packed hexagonal array.
(B) Same sample as in (A) but after the oxygen plasma treatment,
resulting in naked Au particles on the glass substrate. The height
profiles of the horizontal lines indicated in the images demonstrate the
unchanged lateral periodicity of 90 nm after the plasma process and
reduction of height to 8 nm, the height of the naked Au particles.
(Reprinted with permission from Reference [203]. Copyright 2000
American Chemical Society.)
Fig. 23 Wafer-scale nanoparticle placement with electrostatic fun-
neling. (A) A schematic of the electrostatic interaction energy in an
aqueous solution for a negatively charged nanoparticle near a
substrate surface functionalized with positively and negatively
charged molecules. (B) The nanoparticles (red dots) are guided to
the centers of positively charged lines (of width W *100 nm) where
the interaction energy is minimum. (Reprinted with permission from
Reference [82]. Copyright 2007 American Chemical Society.)
Nanoscale Res Lett (2007) 2:519–545 537
123
changed from lines to dots, it is possible to place individual
nanoparticles onto targeted locations, one nanoparticle per
dot. Figure 24B shows an SEM image where *20 nm Au
nanoparticles were funneled into the center area of square-
shaped guiding patterns, one Au nanoparticle per square-
shaped pattern. The electrostatic funneling method is not
constrained to rely on surface patterns but is also effective
for three-dimensional structures having appropriate guiding
geometry. An example is shown in Fig. 24C, where
*50 nm Au nanoparticles were placed along the centers of
the exposed silicon oxide stripe made in a three-dimen-
sional step structure.
Molecular Gradient Patterns
As previously discussed, self-assembled monolayers
(SAMs) can be used as templates where nanoscale building
blocks can be selectively attracted. The interaction between
the SAMs and the building blocks can be readily controlled
by appropriate selection of the SAMs molecules. For
example, either repulsive or attractive interaction can occur
depending on the polarity of the tail group of the SAMs
molecules. Furthermore, the interaction intensity can be
tuned by appropriate mixing of polar and non-polar mol-
ecules. Controlling the gradient of interaction intensity,
Hong and co-workers recently reported the focused
placement of nanowires and carbon nanotubes into the
center area of the SAMs pattern, leading to placement with
much higher precision than the precision that the SAMs
templates are defined [207]. They named this scheme the
‘‘lens effect’’ because the building blocks are directed or
focused onto the small center regions of the patterns much
as light is focused onto a small spot by optical lenses. This
focusing effect was achieved by creating a gradient in the
molecular density in the SAMs pattern using two kinds of
molecules, one is cysteamine (amine terminated; positively
charged) and the other 1-octadecanethiol (ODT; methyl
terminated, non-polar). The concentration of cysteamine
was maximum in the center of the SAMs pattern and
decreased away from the center. This molecular gradient
was achieved by stamping the cysteamine on a gold sub-
strate and letting it diffuse across the surface, followed by
backfilling with ODT molecules. Figure 25, where two
types of samples are compared, one without molecular
gradient and the other with molecular gradient, shows the
effectiveness of their approach. For the uniform SAMs
patterns, when the substrate was immersed in a solution of
V
2
O
5
nanowires, the V
2
O
5
nanowires (negatively charged)
were adsorbed uniformly over the cysteamine patterns,
Fig. 25A. However, for the patterns with molecular gra-
dient, the V
2
O
5
nanowires were directed onto the center of
SAMs lines, resulting in placement precision of *80 nm
even though the line width of the SAMs pattern was
*2 lm. Similar results were obtained for the placement of
single-walled carbon nanotubes (SWNTs), Fig. 25C and D.
Electrodynamic Focusing of Charged Aerosols
If microscale or nanoscale electrostatic lenses could be
made near the substrate, it may be possible for charged
nanoscale building blocks to be directed and placed on the
focal spots on the substrate, resulting in high precision
placement of nanoscale building blocks. This approach has
been demonstrated for charged aerosols by Choi and
co-workers [208] and independently by Barry and Jacobs
[209]. In the approach by Choi and co-workers, a silicon
substrate which was pre-patterned with PMMA (holes and
lines in a PMMA film) was put inside a chamber into which
Fig. 24 Nanoparticle placement using electrostatic funneling scheme.
(A) SEM image of Au nanoparticles (diameter *20 nm) placed along
the centers of silicon oxide lines using the electrostatic funneling
scheme. (B) Zero-dimensional placement of individual nanoparticles
(*20 nm diameter) onto the square-shaped pattern. Note that only
one nanoparticle is placed in the center of each square-shaped
pattern due to the repulsive electrostatic interactions between charged
nanoparticles. (C) Nanoparticle placement in a step structure. Au
nanoparticles (diameter *50 nm) are placed along the center line of
the exposed silicon oxide sidewall (dark stripe). For all SEM images:
the patterns in dark, silicon oxide functionalized with APTES SAMs;
the bright area, gold surface functionalized with MHA SAMs. The Au
nanoparticles appear as bright dots. (Reprinted with permission from
Reference [82]. Copyright 2007 American Chemical Society.)
538 Nanoscale Res Lett (2007) 2:519–545
123
an aerosol of positively charged silver nanoparticles and
positively charged nitrogen ions was introduced with the
substrate biased at –4 kV. During this process, the PMMA
patterns were selectively charged with positive nitrogen
ions because the nitrogen ions have two orders of magni-
tude higher mobility than the charged silver particles and
they deposit much faster. The positively charged PMMA
patterns worked as electrostatic lenses and guided the
positively charged silver nanoparticles away from the
PMMA patterns, leading to focused placement of nano-
particles. The nitrogen ions and silver particles arriving at
the exposed silicon substrate were immediately neutralized
since the silicon substrate was conductive. Figure 26 shows
the effectiveness of this approach where they varied the
nitrogen ion concentration introduced into the chamber,
thereby changing the ion concentration on the PMMA
patterns. Increased focusing effect is clearly seen as the
nitrogen ion concentration introduced is increased. Note
that although the dimension of the guiding structure (the
diameter of the hole in the PMMA) is more than 200 nm,
multiple numbers of 10 nm silver nanoparticles were
directed and placed within a 35 nm circle, Fig. 26D. Using
this approach, they demonstrated directed nanoparticle
placement into the center locations of holes and lines in
large-scale arrays of square (width: 230 nm) and line-
shaped (line width: 230 nm) PMMA templates; using
10 nm silver particles, placement precision of *75 and
*50 nm were demonstrated for arrays of squares and line
patterns, respectively. Barry and Jacobs have also demon-
strated the effectiveness of focused placement using PMMA
and SiO
2
as electret materials [209]. The PMMA and SiO
2
were charged via built-in potential or through ion injection
as verified by KFM (Kelvin probe force microscopy). They
also exploited different types of nanoparticle sources,
including evaporative, electrospray, and plasma, to create
metallic and semiconducting nanoparticles of 10–50 nm in
diameter and demonstrated focused nanoparticle placement
with *50 nm lateral precision. For example, for *100 nm
sized holes in corona-charged PMMA, 10–40 nm silver
nanoparticles were placed onto center locations of the holes
with a precision of *25 nm. For 300 nm wide trenches,
gold nanoparticles were placed along the center locations of
the trench lines with a precision of *75 nm.
Combination of Electrostatic Forces and Capillary
Forces
Focused placement of spherical particles also can be
achieved by exploiting both electrostatic forces and capil-
lary forces. Using microscale polystyrene (PS) spheres as
model systems, Aizenberg et al. have demonstrated a
focused assembly of PS spheres (*1 lm in diameter) onto
small targeted spots using a two-step process; first, elec-
trostatic attachment of the particles onto functionalized
surface patterns of circular shape, then rearrangement of
the attached particles toward the center area of the circular
patterns [210]. The functionalized surface patterns were
made using lCP [78], which created patterns with nega-
tively charged SAMs, and the remainder with positively
charged SAMs. When the sample was immersed into the
PS colloid in water, the PS particles (positively charged
with amidine termination) selectively attached onto the
negatively charged areas. In this process, the long-range
electrostatic interaction (the electrical double-layer inter-
action [211, 212]) repelled the particles away from the
positively charged SAMs and pushed them toward the
center region of the pattern that was charged negatively,
resulting in the first stage focusing effect. Second stage
focusing effect, which is more dominant, was achieved
during the drying process when the immersed sample was
pulled from the colloid, rinsed, and allowed to dry. While
the sample was drying, they monitored the movement of PS
particles in real time using an optical microscope, which
revealed dynamic rearrangement of particles toward to the
center region of the circular patterns. This rearrangement,
Fig. 25 AFM topography images of V
2
O
5
nanowires and SWNTs on
various SAM patterns. (A)V
2
O
5
nanowires on uniform patterns
comprised of ODT (bright area) and cysteamine (dark area). (B)V
2
O
5
nanowires on the mixed SAM regions with gradient cysteamine surface
molecular density on Au (ODT is utilized for passivation). (C) SWNTs
on uniform cysteamine SAM patterns on Au. (D) SWNTs on gradient
cysteamine patterns on Au. Theses patterns cover a large surface area
(*1cm· 1 cm) on the substrates. (Reprinted with permission from
Reference [207]. Copyright 2006 American Chemical Society.)
Nanoscale Res Lett (2007) 2:519–545 539
123
the second focusing effect, was attributed to lateral capil-
lary forces that were created when water–air interfaces
formed asymmetrically on the particle surfaces during the
drying process.
This combination of electrostatic and capillary forces
was further utilized for controlled assembly of ordered
two-dimensional patterns of single colloidal spheres. Fig-
ure 27 demonstrates a directed placement (focusing effect)
of positively charged 1 lm spheres onto a square array of
negatively charged circular patterns, where the circle
diameter is 2.9 lm and the distance between the circle
centers is 10 lm. The focusing effect is clearly seen in
Fig. 27B, where the locations of the sphere centers were
superimposed into one plot, with the outer circle repre-
senting the boundary of the negatively charged pattern
(2.9 lm in diameter). Figure 27C is a schematic of the
proposed mechanism of particle ordering in which the
lateral capillary force pushes the particle toward the center
of the circular pattern. When a particle is located off the
center of the circular pattern, the deformation of water
layer is asymmetric, resulting in asymmetric contact angle.
This produces a net lateral force toward the center until the
particle migrates into the center of the circular pattern.
Placement precision of *0.25 lm has been accomplished
using charged circular patterns of diameter *1.5 lm, a
factor of 6 focusing efficiency.
Precision Placement Using Polymer Micelles
Polymer micelles containing nanoparticles in their cores
can be used for high precision placement of nanoparticles
when combined with template-assisted placement schemes
described earlier. In an approach by Spatz et al. [213],
Fig. 26 Control of focusing with an increase of N
2
ion flow rate on a
substrate with 230-nm-wide and 135-nm-thick PMMA patterns. Scale
bars: 100 nm. (A) Particle deposition with no ion injection. (B–D)
Particle deposition with ion injection: 3 L/min (ion concentration:
*3.31 · 10
5
cm
–3
), 4 L/min (ion concentration: *4.73 · 10
5
cm
–3
),
and 6 L/min (ion concentration: *6.13 · 10
5
cm
–3
) for (B), (C), and
(D), respectively. For all, an aerosol of 10 nm Ag nanoparticles was
used. (Reprinted with permission from Reference [208]. Copyright
2006 Macmillan Publishers Ltd.)
Fig. 27 Fabrication of ordered 2D arrays of single colloidal particles.
(A) Light micrograph of a sample array; the inset shows a SEM of the
template structure. (B) Mapped distribution of particles demonstrating
a high degree of focusing within the outlined circle. (C) Schematic
presentation of the proposed mechanism of particle ordering.
(Reprinted with permission from Reference [210]. Copyright 2000
American Physical Society.)
540 Nanoscale Res Lett (2007) 2:519–545
123
physical templates such as holes and grooves were first
patterned on a PMMA film using e-beam lithography.
Polymer micelles, whose size were comparable to the
hole diameter or trench width of the templates, were
prepared [203] and spin-coated on the patterned PMMA
film. During solvent evaporation, the micelles were
pushed into holes and grooves by capillary forces. By
systematically controlling the hole size, PMMA thickness,
and concentration of micelles, they were able to place
single micelles in each hole (diameter *200 nm). Dis-
solution of the PMMA in acetone (lift-off) removed all
micelles located on top of PMMA film that failed to go
into holes and grooves. Exposure of the template to
oxygen plasma removed the polymers selectively, leaving
behind the nanoparticles which were loaded into the cores
of the micelles. Using this approach, they were able to
place individual nanoparticles on pre-defined locations of
either periodic or aperiodic patterns. Figure 28 shows one
example where single 7 nm Au nanoparticles were pre-
cisely placed on targeted substrate locations with a
precision of better than 10 nm. It is worth noting that this
nanoscale precision was obtained with much coarser
template size; the diameter of the template holes made in
the PMMA film was *200 nm, comparable to the
diameter of the starting polymer micelles.
Summary
We have reviewed recent advances in various strategies for
the controlled placement/growth of nanoscale building
blocks. These were discussed in the context of seven cat-
egories; (1) placement using physical templates, (2)
placement using molecular templates, (3) placement using
electrostatic templates, (4) DNA-programmed placement,
(5) placement using dielectrophoresis, (6) self-assembly
of non-close-packed structure, and (7) focused placement.
For the placement scheme using physical templates, we
reviewed various approaches utilizing capillary forces,
spin-coating, step-edges of crystalline metal and semicon-
ductor surfaces, and sonication-assisted solution
embossing. These methods allow controlled placement of
spherical particles in the range of a few nanometers to
several micrometers, nanometer scale non-spherical shape
building blocks, nanofibers, and metal/metal-oxide nano-
wires. We also reviewed the formation/growth of 2D QD
arrays utilizing underlying pre-defined patterns. A near-
perfect yield of QD arrays has been demonstrated over a
large area with a narrow size distribution.
Molecular templates (patterned SAMs) allow controlled
placement of various nanoentities including nanoscale and
microscale particles, carbon nanotubes, nanowires, pro-
teins, viruses, and DNA. Patterning SAMs can be realized
via selective attachment, removal, and/or modification of
SAMs molecules. The associated techniques for SAMs
patterning include microcontact printing (lCP), dip-pen
nanolithography (DPN), scanning tunneling microscopy
(STM), atomic force microscopy (AFM), and irradiation
with deep UV light or electron-beams. Placement precision
of up to a few tens of nanometers was achieved using these
approaches.
Placement using electrostatic templates utilizes electret
materials to create charge patterns onto which charged
building blocks are selectively attracted. The charging
methods include electrical microcontact printing (e-lCP),
electron-beam writing, ion-beam writing, and writing
using a conductive AFM tip. Placement precision of a few
tens of nanometers has been demonstrated using these
approaches.
The molecular recognition capability of DNA has been
utilized to form one- or two-dimensional arrays of nano-
scale building blocks. Single-stranded DNA has been used
to form one-dimensional arrays of nanoparticles, proteins,
and organometallic compounds. Rigid artificial DNA
motifs (DNA tiles) have been synthesized via reciprocal
exchanges. The DNA tiles have been built into 2D DNA
crystals through programmed matching of sticky ends in
DNA tiles. Utilizing DNA crystals as scaffolds, 2D arrays
of nanoparticles, proteins, and peptide–antibodies have
been constructed.
Fig. 28 Three-dimensional AFM image of single Au nanoparticles
with a diameter of 7 nm separated by 2 lm. The two arrows in the
image indicate the line along which the height profile was taken. The
10 lm line crosses six individual Au clusters, which corresponds to a
positioning accuracy better than 10 nm. (Reprinted with permission
from Reference [213]. Copyright 2002 Wiley-VCH.)
Nanoscale Res Lett (2007) 2:519–545 541
123
Dielectrophoresis has been exploited to manipulate
uncharged nanoscale objects in dielectric liquid medium.
The control of dielectrophoresis with many parameters,
such as dielectric constants of an object and its surrounding
medium, magnitude and frequency of applied electric field,
and electric field gradient, has been discussed. Special
attention has been paid to utilizing dielectrophoresis to
place one-dimensional objects (such as nanowires and
carbon nanotubes) between two electrodes, which is
essential for fabrication of nanoelectronic devices and
sensors. A recent advance has demonstrated self-limiting
deposition of single SWNTs across electrode pairs with
more than 90% yield over a large area.
Self-assembly of spherical particles to non-close-packed
(ncp) structure provides an important pathway to large-
scale placement of nanoscale or microscale particles with a
variety of spatial configuration and varying lattice param-
eters. Two advances were discussed in this article; one is
based on geometrical change of PDMS films either by
expansion in solvent or mechanical stretching. The other
uses polymer micelles whose core either contains or
reduces to metal or metal-oxide nanoparticles. Control of
nanoparticle diameter and lattice spacing of nanoparticle
arrays was demonstrated by appropriate selection of block
copolymers.
Focused placement approaches allow placement of
nanoscale building blocks with precision much higher than
the precision with which guiding templates are defined.
This approach includes electrostatic funneling, placement
using molecular gradient patterns, electrodynamic focusing
of charged aerosols, guided placement using the synergy of
electrostatic force and capillary force, and precision
placement using polymer micelles. The important merit of
these focused placement approaches is that large scale
placement with nanoscale precision can be accomplished
because the guiding structures can be defined on the scale
of a few hundreds nanometers using conventional lithog-
raphy. Placement precision of less than 10 nm was
demonstrated over large areas using guiding structures on
the scale of * 100 nm.
Although the materials covered in this review are only a
small portion of vast research effort on-going or performed
over the last decade or so, it is quite clear that there are
already many techniques that are maturing and have
potential for practical implementation. Considering the
accelerating speed of new discoveries and developments in
this field, we may anticipate practical devices or sensors
based on nanoscale building blocks being a reality in the
near future.
Acknowledgements The author gratefully acknowledges Dr. Nancy
Michael for valuable discussions. This work was supported in part by
the Office of Naval Research (N00014-05-1-0030), National Science
Foundation CAREER Grant (ECS-0449958), and Advanced Research
Program of Texas Higher Education Coordinating Board (003656-
0014-2006).
References
1. A. Javey, J. Guo, Q. Wang, M. Lundstrom, H.J. Dai, Nature 424,
654 (2003)
2. A. Bachtold, P. Hadley, T. Nakanishi, C. Dekker, Science 294,
1317 (2001)
3. D.L. Klein, R. Roth, A.K.L. Lim, A.P. Alivisatos, P.L. McEuen,
Nature 389, 699 (1997)
4. S.J. Wind, J. Appenzeller, R. Martel, V. Derycke, P. Avouris,
Appl. Phys. Lett. 80, 3817 (2002)
5. N.R. Franklin, Q. Wang, T.W. Tombler, A. Javey, M. Shim, H.
Dai, Appl. Phys. Lett. 81, 913 (2002)
6. X. Duan, Y. Huang, Y. Cui, J. Wang, C.M. Lieber, Nature 409,
66 (2001)
7. A. Javey, Q. Wang, A. Ural, Y. Li, H. Dai, Nano Lett. 2, 929
(2002)
8. Y. Huang, X. Duan, Y. Cui, L.J. Lauhon, K H. Kim, C.M.
Lieber, Science 294, 1313 (2001)
9. J. Wang, M.S. Gudiksen, X. Duan, Y. Cui, C.M. Lieber, Science
293, 1455 (2001)
10. Y. Cui, Q. Wei, H. Park, C.M. Lieber, Science 293, 1289 (2001)
11. J.A. Misewich, R. Martel, P. Avouris, J.C. Tsang, S. Heinze, J.
Tersoff, Science 300, 783 (2003)
12. A. Javey, H. Kim, M. Brink, Q. Wang, A. Ural, J. Guo, P.
Mcintyre, P. McEuen, M. Lundstrom, H. Dai, Nat. Mater. 1, 241
(2002)
13. X. Duan, Y. Huang, C.M. Lieber, Nano Lett. 2, 487 (2002)
14. N.I. Kovtyukhova, B.K. Kelley, T.E. Mallouk, J. Am. Chem.
Soc. 126, 12738 (2004)
15. For a brief overview, see S.J. Koh, JOM 59, 22 (2007)
16. Y.N. Xia, Y.D. Yin, Y. Lu, J. McLellan, Adv. Funct. Mater. 13,
907 (2003)
17. Y. Cui, M.T. Bjork, J.A. Liddle, C. Sonnichsen, B. Boussert,
A.P. Alivisatos, Nano Lett. 4, 1093 (2004)
18. M.J. Gordon, D. Peyrade, Appl. Phys. Lett. 89, 053112 (2006)
19. Y.D. Yin, Y.N. Xia, J. Am. Chem. Soc. 125, 2048 (2003)
20. Y. Lu, Y.D. Yin, Y.N. Xia, Adv. Mater. 13, 34 (2001)
21. Y.D. Yin, Y. Lu, Y.N. Xia, J. Am. Chem. Soc. 123, 771 (2001)
22. G. Costantini, A. Rastelli, C. Manzano, P. Acosta-Diaz, R.
Songmuang, G. Katsaros, O. Schmidt, K. Kern, Phys. Rev. Lett.
96, 226106 (2006)
23. M.A. Kastner, Phys. Today 46, 24 (1993)
24. A.P. Alivisatos, Science 271, 933 (1996)
25. A.O. Orlov, I. Amlani, G.H. Bernstein, C.S. Lent, G.L. Snider,
Science 277, 928 (1997)
26. A. Zrenner, E. Beham, S. Stufler, F. Findeis, M. Bichler, G.
Abstreiter, Nature 418, 612 (2002)
27. C. Emary, L.J. Sham, Phys. Rev. B 75, 125317 (2007)
28. P. Michler, A. Kiraz, C. Becher, W.V. Schoenfeld, P.M. Petroff,
L.D. Zhang, E. Hu, A. Imamoglu, Science 290, 2282 (2000)
29. Z.L. Yuan, B.E. Kardynal, R.M. Stevenson, A.J. Shields, C.J.
Lobo, K. Cooper, N.S. Beattie, D.A. Ritchie, M. Pepper, Science
295, 102 (2002)
30. S. Kiravittaya, M. Benyoucef, R. Zapf-Gottwick, A. Rastelli,
O.G. Schmidt, Appl. Phys. Lett. 89, 233102 (2006)
31. H. Sunamura, N. Usami, Y. Shiraki, S. Fukatsu, Appl. Phys.
Lett. 66, 3024 (1995)
32. P. Schittenhelm, M. Gail, J. Brunner, J.F. Nutzel, G. Abstreiter,
Appl. Phys. Lett. 67, 1292 (1995)
33. M. Henini, Nanoscale Res. Lett. 1, 32 (2006)
542 Nanoscale Res Lett (2007) 2:519–545
123
34. S. Kiravittaya, R. Songmuang, A. Rastelli, H. Heidemeyer, O.G.
Schmidt, Nanoscale Res. Lett. 1, 1 (2006)
35. J. Stangl, V. Holy, G. Bauer, Rev. Mod. Phys. 76, 725 (2004)
36. S. Kiravittaya, H. Heidemeyer, O.G. Schmidt, Appl. Phys. Lett.
86, 263113 (2005)
37. S. Kiravittaya, O.G. Schmidt, Appl. Phys. Lett. 86, 206101
(2005)
38. Z.Y. Zhong, G. Bauer, Appl. Phys. Lett. 84, 1922 (2004)
39. Z.Y. Zhong, A. Halilovic, M. Muhlberger, F. Schaffler, G.
Bauer, Appl. Phys. Lett. 82, 445 (2003)
40. Z.Y. Zhong, A. Halilovic, T. Fromherz, F. Schaffler, G. Bauer,
Appl. Phys. Lett. 82, 4779 (2003)
41. H. Heidemeyer, U. Denker, C. Muller, O.G. Schmidt, Phys. Rev.
Lett. 91, 196103 (2003)
42. T. Kitajima, B. Liu, S.R. Leone, Appl. Phys. Lett. 80, 497
(2002)
43. G. Jin, J.L. Liu, K.L. Wang, Appl. Phys. Lett. 76, 3591 (2000)
44. E.S. Kim, N. Usami, Y. Shiraki, Appl. Phys. Lett. 72, 1617
(1998)
45. O.G. Schmidt, N.Y. Jin-Phillipp, C. Lange, U. Denker, K. Eberl,
R. Schreiner, H. Grabeldinger, H. Schweizer, Appl. Phys. Lett.
77, 4139 (2000)
46. S. Kiravittaya, H. Heidemeyer, O.G. Schmidt, Physica E 23, 253
(2004)
47. H. Heidemeyer, C. Muller, O.G. Schmidt, J. Cryst. Growth 261,
444 (2004)
48. Q.H. Xie, A. Madhukar, P. Chen, N.P. Kobayashi, Phys. Rev.
Lett. 75, 2542 (1995)
49. J. Tersoff, C. Teichert, M.G. Lagally, Phys. Rev. Lett. 76, 1675
(1996)
50. Z.Y. Zhong, A. Halilovic, M. Muhlberger, F. Schaffler, G.
Bauer, J. Appl. Phys. 93, 6258 (2003)
51. H. Heidemeyer, C. Muller, O.G. Schmidt, Physica E 23, 237
(2004)
52. D.Y. Xia, A. Biswas, D. Li, S.R.J. Brueck, Adv. Mater. 16, 1427
(2004)
53. H. Roder, E. Hahn, H. Brune, J.P. Bucher, K. Kern, Nature 366,
141 (1993)
54. P. Gambardella, M. Blanc, H. Brune, K. Kuhnke, K. Kern, Phys.
Rev. B 61, 2254 (2000)
55. T. Jung, R. Schlittler, J.K. Gimzewski, F.J. Himpsel, Appl. Phys.
A 61, 467 (1995)
56. D.Y. Petrovykh, F.J. Himpsel, T. Jung, Surf. Sci. 407, 189
(1998)
57. T. Jung, Y.W. Mo, F.J. Himpsel, Phys. Rev. Lett. 74, 1641
(1995)
58. Y.W. Mo, F.J. Himpsel, Phys. Rev. B 50, 7868 (1994)
59. M.P. Zach, K.H. Ng, R.M. Penner, Science 290, 2120 (2000)
60. F. Favier, E.C. Walter, M.P. Zach, T. Benter, R.M. Penner,
Science 293, 2227 (2001)
61. R.M. Penner, J. Phys. Chem. B 106, 3339 (2002)
62. A.M. Hung, S.I. Stupp, Nano Lett. 7, 1165 (2007)
63. J.C. Love, L.A. Estroff, J.K. Kriebel, R.G. Nuzzo, G.M.
Whitesides, Chem. Rev. 105, 1103 (2005)
64. A. Ulman, Chem. Rev. 96, 1533 (1996)
65. S. Onclin, B.J. Ravoo, D.N. Reinhoudt, Angew. Chem. Int. Ed.
44, 6282 (2005)
66. F. Schreiber, J. Phys Condens. Mater. 16, R881 (2004)
67. D.L. Allara, R.G. Nuzzo, Langmuir 1, 45 (1985)
68. D.L. Allara, R.G. Nuzzo, Langmuir 1, 52 (1985)
69. R.K. Smith, P.A. Lewis, P.S. Weiss, Prog. Surf. Sci. 75, 1 (2004)
70. X.M. Li, J. Huskens, D.N. Reinhoudt, J. Mater. Chem. 14, 2954
(2004)
71. Y.F. Gao, K. Koumoto, Crystal Growth Design 5, 1983 (2005)
72. J.J. Gooding, F. Mearns, W.R. Yang, J.Q. Liu, Electroanalysis
15, 81 (2003)
73. S. Kramer, R.R. Fuierer, C.B. Gorman, Chem. Rev. 103, 4367
(2003)
74. D.S. Ginger, H. Zhang, C.A. Mirkin, Angew. Chem. Int. Ed. 43,
30 (2004)
75. R.M. Nyffenegger, R.M. Penner, Chem. Rev. 97, 1195 (1997)
76. B.D. Gates, Q.B. Xu, M. Stewart, D. Ryan, C.G. Willson, G.M.
Whitesides, Chem. Rev. 105, 1171 (2005)
77. R. Garcia, R.V. Martinez, J. Martinez, Chem. Soc. Rev. 35,29
(2006)
78. A. Kumar, G.M. Whitesides, Appl. Phys. Lett. 63, 2002
(1993)
79. A. Kumar, H.A. Biebuyck, G.M. Whitesides, Langmuir 10, 1498
(1994)
80. R.D. Piner, J. Zhu, F. Xu, S.H. Hong, C.A. Mirkin, Science 283,
661 (1999)
81. P.E. Laibinis, J.J. Hickman, M.S. Wrighton, G.M. Whitesides,
Science 245, 845 (1989)
82. L.C. Ma, R. Subramanian, H.W. Huang, V. Ray, C.U. Kim, S.J.
Koh, Nano Lett. 7, 439 (2007)
83. M.S. Chen, C.S. Dulcey, L.A. Chrisey, W.J. Dressick, Adv.
Funct. Mater. 16, 774 (2006)
84. M.C. Howland, A.R. Sapuri-Butti, S.S. Dixit, A.M. Dattelbaum,
A.P. Shreve, A.N. Parikh, J. Am. Chem. Soc. 127, 6752 (2005)
85. Y.T. Kim, A.J. Bard, Langmuir 8, 1096 (1992)
86. C.B. Ross, L. Sun, R.M. Crooks, Langmuir 9, 632 (1993)
87. R.V. Martinez, F. Garcia, R. Garcia, E. Coronado, A. Forment-
Aliaga, F.M. Romero, S. Tatay, Adv. Mater. 19, 291 (2007)
88. S. Hoeppener, J.H.K. van Schaik, U.S. Schubert, Adv. Funct.
Mater. 16, 76 (2006)
89. J.C. Garno, Y.Y. Yang, N.A. Amro, S. Cruchon-Dupeyrat, S.W.
Chen, G.Y. Liu, Nano Lett.
3, 389 (2003)
90. R. Maoz, E. Frydman, S.R. Cohen, J. Sagiv, Adv. Mater. 12, 725
(2000)
91. S.T. Liu, R. Maoz, J. Sagiv, Nano Lett. 4, 845 (2004)
92. Z.M. Fresco, J.M.J. Frechet, J. Am. Chem. Soc. 127, 8302
(2005)
93. C.S. Dulcey, J.H. Georger, V. Krauthamer, D.A. Stenger, T.L.
Fare, J.M. Calvert, Science 252, 551 (1991)
94. S. Hoeppener, R. Maoz, S.R. Cohen, L.F. Chi, H. Fuchs, J.
Sagiv, Adv. Mater. 14, 1036 (2002)
95. S.T. Liu, R. Maoz, G. Schmid, J. Sagiv, Nano Lett. 2, 1055
(2002)
96. S.G. Rao, L. Huang, W. Setyawan, S.H. Hong, Nature 425,36
(2003)
97. J.B. Hannon, A. Afzali, C. Klinke, P. Avouris, Langmuir 21,
8569 (2005)
98. J. Tien, A. Terfort, G.M. Whitesides, Langmuir 13, 5349 (1997)
99. C.L. Feng, G.J. Vancso, H. Schonherr, Adv. Funct. Mater. 16,
1306 (2006)
100. J.M. Zhang, Y.F. Ma, S. Stachura, H.X. He, Langmuir 21, 4180
(2005)
101. J. Lahiri, E. Ostuni, G.M. Whitesides, Langmuir 15, 2055 (1999)
102. P.C. Hidber, W. Helbig, E. Kim, G.M. Whitesides, Langmuir
12, 1375 (1996)
103. L.M. Demers, D.S. Ginger, S.J. Park, Z. Li, S.W. Chung, C.A.
Mirkin, Science 296, 1836 (2002)
104. X.G. Liu, L. Fu, S.H. Hong, V.P. Dravid, C.A. Mirkin, Adv.
Mater. 14, 231 (2002)
105. L.M. Demers, C.A. Mirkin, Angew. Chem. Int. Ed. 40, 3069
(2001)
106. S.W. Lee, B.K. Oh, R.G. Sanedrin, K. Salaita, T. Fujigaya, C.A.
Mirkin, Adv. Mater. 18, 1133 (2006)
107. R.A. Vega, D. Maspoch, K. Salaita, C.A. Mirkin, Angew. Chem.
Int. Ed. 44, 6013 (2005)
108. S.L. Zou, D. Maspoch, Y.H. Wang, C.A. Mirkin, G.C. Schatz,
Nano Lett. 7, 276 (2007)
Nanoscale Res Lett (2007) 2:519–545 543
123