Báo cáo nghiên cứu nông nghiệp " QUY PHẠM THỰC HÀNH TỐT HƠN (BMP) CHO NUÔI CÁ TRA THƯƠNG PHẨM " pptx
Bạn đang xem bản rút gọn của tài liệu. Xem và tải ngay bản đầy đủ của tài liệu tại đây (5.25 MB, 31 trang )
1
QUY PHẠM THỰC HÀNH TỐT HƠN (BMP)
CHO NUÔI CÁ TRA THƯƠNG PHẨM
Năm 2009
2
Mục lục
1. Chuẩn bị ao nuôi
2. Chọn cá giống và thả giống
3. Thay nước trong quá trình nuôi
4. Quản lý ao nuôi
5. Quản lý sức khỏe cá nuôi
6. Thu hoạch
NHỮNG VẤN ĐỀ KHÁC LIÊN QUAN ĐẾN BMP
1. Trách nhiệm đối với cộng đồng
2. Bảo vệ môi trường
3. An toàn vệ sinh thực phẩm
4. Truy xuất nguồn gốc
Hình ảnh sử dụng trong tài liệu này là của Khoa Thủy sản,
Trường Đại học Cần Thơ (ngọai trừ hình bìa 1)
3
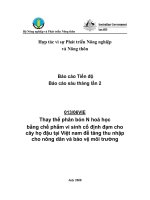
Hút bùn đáy khi ao bơm
cạn nước (trên) và ao
không bơm cạn nước
(dưới)
1. Chuẩn bị ao nuôi
1.1 Xử lý bùn đáy ao
a) Có thể hút bùn ra khỏi ao
Ao có thể bơm cạn nước
- Hút bùn đáy chuyển đến mương vườn cây ăn
trái hoặc ao chứa riêng.
- Bón vôi và phơi ao 1 tuần trước khi lấy nước
- Thả cá nuôi khoảng 2 tuần sau khi lấy nước.
Ao không thể bơm cạn nước
- Hút bùn đáy chuyển
đến mương vườn cây
ăn trái hoặc ao chứa
riêng.
- Bón vôi và rửa ao (xả
nước) 2-3 tuần trước
khi thả giống.
b) Không thể hút bùn ra
khỏi ao
Hạ nước ao đếm mức
thấp nhất rồi xử lý vôi
và muối
1.2 Gia cố ao nuôi
Sửa và gia cố bờ và cống ao đồng thời vệ sinh
sạch sẽ quanh ao nuôi.
4
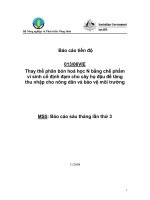
Chọn cá giống thả nuôi
Bón vôi quanh bờ ao
1.3 Bón vôi cải tạo
Ao bơm cạn được nước thì bón vôi nung (CaO)
từ 10-15 kg/100 m
2
cho cả ao và bờ.
Ao không thể bơm cạn
được nước thì bón vôi
nung (CaO) trên bờ từ
10-15 kg/100 m
2
kết
hợp bón muối 10-15
kg/100 m
2
1.4 Cấp nước vào ao
Lọc nước trước khi cấp vào ao bằng túi lưới lọc
có mắt lưới nhỏ.
2. Chọn cá giống và thả giống
2.1 Chọn cá giống
Chọn những cơ sở ương cá giống có uy tín và
cung cấp đủ số lượng thả nuôi.
Kiểm tra cá giống tại ao ương trước khi mua
đồng thời tìm hiểu lý lịch của đàn cá.
Chọn có giống có các đặc điểm sau:
- Khoẻ mạnh, màu sắc
sáng, kích cỡ đồng
đều và không có dấu
hiệu bệnh.
- Thả 30-40 cá vào
thau nước trong 3-4
phút, nếu có một số
5
Ghe đục vận chuyển cá giống và
cá thương phẩm
cá bơi không kịp đàn là đàn cá yếu không nên
chọn mua.
Cá giống phải được luyện trước khi vận chuyển
vào ao nuôi.
Kích cỡ cá giống nên từ 1,7 đến 2,2 cm chiều cao
thân tức từ 75-80 con/kg đến 30-35 con/kg.
Nếu có điều kiện thì lấy mẫu cá kiểm tra mầm
bệnh thông thường trước khi mua.
Cá giống đồng đều sẽ là một trong những yếu tố
quyết định đến tính đều cỡ của cá thu họach.
2.2 Vận chuyển cá giống
Không cho cá ăn 24 giờ trước khi vận chuyển.
Thời gian vận chuyển tốt nhất là không quá 6 giờ.
Nếu thời gian vận
chuyển hơn 6 giờ thì
cần hút cặn ở đáy
ghe và thay nước.
Khối lượng cá vận
chuyển khoảng 5%
tải trọng ghe (hay khối lượng cá vận chuyển và
khối lượng nước chứa trong ghe là 1:5).
2.3 Xử lý và thả cá giống
Xử lý muối cho cá ngay khi thả vào ao, nhúng cá
vào trong nước muối 50%o trong thời gian 0,5-1
phút (50 kg muối/m
3
nước).
6
Lấy nước vào ao nuôi qua
cống
Cho cá ăn ít trong 3-4 ngày đầu (cho ăn khoảng
30-50% lượng thức ăn thông thường).
Thả giống khi nước ao đạt khoảng 2 m và màu
nước xanh đọt chuối hay võ đậu.
2.4 Mật độ và mùa vụ thả cá giống
Mùa vụ nuôi cá quanh năm.
Không thả quá 60 con/m
2
hay 15 con/m
3
nước.
Thả cá lúc sáng sớm hoặc chiều mát.
3. Thay nước trong quá trình nuôi
3.1 Thay nước
Phối hợp lên lịch thay nước cho tất cả các trại/ao
nuôi có sử dụng chung nguồn nước của đoạn
sông khoảng 2 km.
Trao đổi thông tin về lịch thay nước (cấp và thải)
giữa các trại nuôi với
nhau qua phương pháp
truyền thông đơn giản
(như tin nhắn).
Các trại cố gắng có
ao/mương lắng nước
trước khi thải ra ngoài.
3.2 Yêu cầu về thay nước
Nước cấp vào ao nên được lọc qua túi lưới
7
Sổ ghi chép số liệu
Tháng nuôi thứ nhất thay nước 2 tuần/lần, các
tháng nuôi tiếp theo thay hàng ngày tùy vào mùa
khô hay mùa mưa như sau:
- Mùa khô thì nước thải nên đưa vào vườn cây
ăn trái hoặc ao chứa trước khi thải ra
sông/kinh rạch.
- Mùa mưa thì nước thải có thể xả trực tiếp ra
sông/kinh rạch.
Khi trong vùng nuôi có dịch bệnh thì hạn chế
hoặc ngừng thay nước.
4. Quản lý ao nuôi
4.1 Quản lý bùn đáy
Từ tháng nuôi thứ 3 thì bắt đầu hút bùn đáy ao.
Bùn cần được chuyển đến vườn cây ăn trái hoặc
ao chứa riêng.
Có thể hút bùn 2-3 lần trong thời gian nuôi tùy
vào mức độ tích lũy ở đáy ao.
4.2 Quản lý chất lượng nước và ghi chép số liệu
Kiểm tra pH và lượng khí ammonia hằng tuần.
Những vùng bị nhiễm
mặn thì nên kiểm tra
thêm độ mặn hàng tuần.
Ghi chép đầy đủ các số
liệu về chất lượng nước
và những thông tin khác
8
Cho cá ăn thức ăn viên
công nghiệp thương mại
(trên) và máy làm thức
ăn viên tại gia đình (dưới)
liên quan đến vụ nuôi vào sổ nhật ký.
4.3 Quản lý thức ăn
Chọn mua và bảo quản
thức ăn:
- Thức ăn phải có nhãn
hiệu và thành phần
dinh dưỡng rõ ràng;
và phải còn trong hạn
sử dụng.
- Bảo quả thức ăn nơi
thoáng khí, để cách
mặt đất 20 cm và trên
nền gỗ khô, tránh ánh
nắng mặt trời trực
tiếp, mưa hắt và gió.
- Kiểm tra mùi trước
khi cho cá ăn và loại
bỏ những bao thức ăn
bị ôi/thối hay ẩm mốc.
Cho cá ăn
- Bắt đầu cho cá ăn đủ khẩu phần (lượng thức
ăn) sau khi thả giống 3-4 ngày.
- Cho cá ăn thức ăn viên công nghiệp (sản xuất
thương mại hoặc sản xuất tại gia đình).
- Cho cá ăn 2 lần/ngày vào buổi sáng và chiều.
9
Cá bị bệnh gan thận mủ
- Khi cá đạt 50-80 g/con thì cho cá ăn tối đa 5%
và giảm dần khẩu phần ăn theo kích thước
tăng lên của cá, cho ăn khoảng 2-3% khối
lượng cá/ngày vào những tháng cuối.
- Quản lý thức ăn khi cá có triệu chứng “vàng
toàn thân”. Khi cá có dấu hiệu vàng toàn thân
thì giảm lượng thức và kết hợp kiểm tra cá
trong ao, mổ cá quan sát và gởi mẫu xét
nghiệm. Ngoài ra, kiểm tra lại thức ăn xem có
quá hạn hay bị ôi thối, nếu có thì thay thức ăn
mới còn hạn.
5. Quản lý sức khỏe cá nuôi
Các yếu tố có tác động xấu đến sức khỏe cá:
Thời tiết thay đổi như nhiệt độ giảm thấp, mưa
nhiều,… sẽ làm thay đổi môi trường nước ao và
có thể ảnh hưởng xấu đến sức khỏe cá.
Các dấu hiệu bất thường ở cá nuôi: cá ăn ít, bơi
lơi bất thường,
Các dấu hiệu bệnh ở cá nuôi:
- Bệnh gan thận mủ (BNP): biểu hiện bên
ngoài là cá bơi lờ đờ, cá từ đáy phóng và xoay
vong vòng, giảm ăn.
Trên gan, thận và lá
lách xuất hiện nhiềm
đóm trắng. Xử lý
bệnh bằng cách không
cho ăn và dùng thuốc
kháng sinh phù hợp.
10
Cá bị bệnh trắng gan,
mang (hình trên)
- Bệnh trắng gan,
trắng mang: biểu
hiện bên ngoài là
mang và gan có màu
trắng nhạt. Xử lý
bệnh bằng cách giảm
cho ăn kết hợp xử lý
nước.
- Bệnh xuất huyết: biểu hiện bên ngoài là hậu
môn đỏ, mỏ đỏ, mắt lồi, các kỳ/vây đỏ. Bên
trong thì gan đỏ bầm, xuất huyết các mạch
máu ở đường ruột, thành bụng bên trong bị
xuất huyết. Xử lý bằng cách cải thiện môi
trường và dùng kháng sinh phù hợp.
Phòng bệnh
- Cho cá ăn thức ăn phù hợp với nhu cầu dinh
dưỡng của cá theo giai đọan phát triển.
- Không nên thay đổi nhiều loại thức ăn trong
chu kỳ nuôi.
- Theo dõi chất lượng nước thường xuyên.
- Khi thời tiết thay đổi (nhiệt độ giảm, mưa
nhiều) nên xử lý môi trường ao bằng muối và
vôi.
Quản lý khi cá bệnh/chết
- Thường xuyên quan sát các dấu hiệu bất
thường và cách bơi lội của cá.
11
Thu họach cá (trên) và
ghe đục vận chuyển cá
(dưới)
- Ghi chép cẩn thận các dấu hiệu bệnh lý, kích
cỡ cá bị nhiễm bệnh và tiến triển của bệnh.
- Chôn cá chết với vôi ở vị trí nhất định trong
trại.
- Không nên bán cá bệnh chết để làm thức ăn
cho các loài cá nuôi khác.
- Gửi mẫu cá có dấu hiệu bệnh hay sắp chết đến
phòng thí nghiệm gần nhất để phân tích/chẩn
đoán bệnh.
- Không nên sử dụng thuốc hay hoá chất trị
bệnh khi chưa biết nguyên nhân gây bệnh. Chỉ
xử lý khi có kết quả chẩn đoán bệnh.
- Thông báo cho các hộ nuôi lân cận khi thải
nước từ ao cá bị nhiễm bệnh ra ngoài.
6. Thu hoạch
Ngưng cho cá ăn 2-3
ngày trước khi thu họach
để tránh cá chết khi vận
chuyển.
Hệ số tiêu tốn thức ăn
(FCR) thường từ 1,5-1,6
nếu dùng thức ăn viên
công nghiệp.
Tỷ lệ sống của cá đến
khi thu hoạch trung bình
trên 80% nếu thả cá
giống 2,2-2,7 cm.
12
Nên cá thu hoạch khi cá đạt kích cỡ trung bình
900 g/con và thời gian nuôi khoảng 6 tháng.
Tổng thời gian thu hoạch không nên quá 7 ngày,
tốt nhất nên thu hoạch cá trong vòng 4 ngày.
Vân chuyển cá đến nhà máy chế biến bắng ghe
đục, khối lượng cá vận chuyển không nên vượt
5% tải trọng của ghe.
13
NHỮNG VẤN ĐỀ KHÁC
LIÊN QUAN ĐẾN BMP
1. Trách nhiệm đối với cộng đồng
Quyền sở hữu tài sản và tuân thủ các qui định:
các trại nuôi phải có quyền hợp pháp về sử dụng
đất, nguồn nước, xây dựng, hoạt động và xử lý
chất thải ao nuôi.
Quan hệ với cộng đồng: tạo mối quan hệ tốt đẹp
với cộng đồng có liên quan,; không được xâm
phạm khu vực chung, đất công, ngư trường khai
thác và nguồn lợi truyền thống của cộng đồng địa
phương.
An toàn lao động cho công nhân và mối quan hệ
với người lao động: các trại nuôi cá phải tuân
theo luật lao động để đảm bảo an toàn và điều
kiện làm việc của người lao động.
2. Bảo vệ môi trường
Bảo tồn vùng đất ngập nước và bảo vệ sự đa
dạng sinh học: các trại nuôi cá không nên đặt ở
vùng đất ngập nước nhạy cảm. Hoạt động của trại
không được gây hại vùng đất ngập nước hoặc làm
giảm đa dạng sinh học của hệ sinh thái.
Quản lý chất thải: trại nuôi nên theo dõi và tìm
được cách xử lý chất thải trước khi thải ra môi
trường nước công cộng.
14
Sự bảo tồn việc sử dụng bột cá và dầu cá: trại nên
theo dõi thành phần thức ăn và hạn chế nhiều
nhất sử dụng bột cá và dầu cá làm từ nguồn cá
khai thác.
Bảo tồn đất và nước: trại phải được thiết kế và
hoạt động sao cho không làm mặn hóa đất và
nước và làm suy giảm vùng nước xung quanh khu
vực trang trại. Trang trại nên quản lý chặt chẽ
việc thải chất thải từ các ao nuôi.
Kiểm soát việc thất thoát cá nuôi và sử dụng sinh
vật biến đổi gen: trại phải hạn chế nhiều nhất việc
thất thoát cá nuôi ra môi trường và tuân theo
những qui định của Nhà nước trong việc sử dụng
những loài bản địa, ngoại lai và giống loài biến
đổi gen.
Trữ và xả bỏ chất thải trong trại: xăng dầu, nhớt,
hóa chất nông nghiệp phải được trữ và xả bỏ theo
cách an toàn và có trách nhiệm.
Chăm sóc cá nuôi: tất cả các hoạt động liên quan
đến nuôi cá phải được thiết kế và vận hành có
trách nhiệm cao. Người lao động phải được huấn
luyện để có thể chăm sóc cá nuôi phù hợp.
3. An toàn vệ sinh thực phẩm
Không nên sử dụng hoá chất cấm trong bất kỳ
giai đoạn nào trong quá trình nuôi.
Thường xuyên tham khảo thông tin từ các cấp
quản lý về danh mục các hóa chất cấm.
15
Khi sử dụng bất kỳ loại hoá chất nào cũng nên
tham khảo ý kiến chuyên môn từ những cán bộ
kỹ thuật.
Nên tìm hiểu rõ các hướng dẫn về các tiêu chuẩn
đảm bảo vệ sinh an toàn và chất lượng sản phẩm
thủy sản.
Thuốc và hóa chất: không sử dụng kháng sinh,
thuốc và các hóa chất cấm. Những thuốc và hóa
chất khác phải sử dụng theo hướng dẫn ghi trên
nhãn sản phẩm để trị bệnh hoặc quản lý, không
được dùng kháng sinh để phòng bệnh.
Sát khuẩn trại nuôi: tránh để chất thải của người
và vật nuôi trong trại làm nhiễm bẩn nước ao.
Các chất thải sinh hoạt trong trại nên được xử lý
và không làm nhiễm bẩn khu vực xung quanh.
Thu hoạch và vận chuyển: cá nên được thu hoạch
và vận chuyển đến các nhà máy chế biến hoặc
các chợ trong điều kiện ổn định nhiệt độ và giảm
thiểu việc gây sốc, xay xước và nhiễm bẩn.
4. Truy xuất nguồn gốc
Yêu cầu về việc ghi chép thông tin: để phục vụ
cho truy xuất nguồn gốc, các thông tin sau đây
nên được ghi chép cho mỗi khu nuôi và mỗi công
đoạn sản xuất:
- Mã số khu sản xuất.
- Diện tích và thể tích nước ao.
- Ngày thả giống.
16
- Số lượng và kích cỡ cá giống thả.
- Nguồn cá giống (nơi sản xuất).
- Kháng sinh và hóa chất đã sử dụng.
- Thuốc diệt cỏ, diệt tảo và thuốc trừ sâu.
- Nhà máy sản xuất thức ăn và mã số lô hàng
thức ăn sử dụng.
- Ngày thu hoạch.
- Sản lượng thu hoạch.
- Nhà máy chế biến/người mua sản phẩm.
17
Tài liệu được biên soạn dựa theo kết quả nghiên cứu của dự
án “XÂY DỰNG DỰNG QUI PHẠM THỰC HÀNH QUẢN LÝ
NUÔI TỐT HƠN (BMP) CHO NGHỀ NUÔI CÁ TRA Ở ĐỒNG
BẰNG SÔNG CỨU LONG”
Dự án do Chương trình CARD, Cơ quan phát triển quốc tế Úc
(AusAID) tài trợ được các cơ quan phối hợp thực hiện là:
- Vụ Công nghiệp Cơ sở (DPI), Bang Victoria, Úc
- Mạng lưới các Trung tâm Nuôi trồng Thủy sản Châu
Á - Thái Bình Dương (NACA)
- Viện nghiên cứu Nuôi trồng Thủy sản 2 (RIA-2)
- Trường Đại học Cần Thơ (CTU)
This article appeared in a journal published by Elsevier. The attached
copy is furnished to the author for internal non-commercial research
and education use, including for instruction at the authors institution
and sharing with colleagues.
Other uses, including reproduction and distribution, or selling or
licensing copies, or posting to personal, institutional or third party
websites are prohibited.
In most cases authors are permitted to post their version of the
article (e.g. in Word or Tex form) to their personal website or
institutional repository. Authors requiring further information
regarding Elsevier’s archiving and manuscript policies are
encouraged to visit:
/>Author's personal copy
Current status of farming practices of striped catfish, Pangasianodon hypophthalmus
in the Mekong Delta, Vietnam
Lam T. Phan
a
, Tam M. Bui
b
, Thuy T.T. Nguyen
c
, Geoff J. Gooley
d
, Brett A. Ingram
d
, Hao V. Nguyen
a
,
Phuong T. Nguyen
b
, Sena S. De Silva
c,
⁎
a
Research Institute for Aquaculture No. 2, 116 Nguyen Dinh Chieu Street, District 1, Ho Chi Minh City, Vietnam
b
College of Aquaculture and Fisheries, Can Tho University, Can Tho, Vietnam
c
Network of Aquaculture Centres in Asia-Pacific (NACA), PO Box 1040, Kasetsart Post Office, Bangkok 10903, Thailand
d
Fisheries Victoria, Department of Primary Industries, Victoria, Melbourne, Australia
abstractarticle info
Article history:
Received 24 May 2009
Received in revised form 11 August 2009
Accepted 11 August 2009
Keywords:
Striped catfish
Farming practices
Tra
Pangasianodon hypophthalmus
Vietnam
Grow-out
Aquaculture of catfish, Pangasianodon hypophthalmus (Sauvage), locally known as “ca tra”, and commonly
referred to as striped catfish, river catfish and sutchi catfish, in Vietnam, having recorded a production of
683,000 tonnes in 2007, valued at about 645 million US$ is one of the largest single species based farming
system, restricted to a small geographical area, in the world. The product is almost totally exported to over
100 countries as frozen fillets, as an acceptable alternative to white fish. Catfish is farmed mostly in earthen
ponds, up to 4 m deep, in nine provinces in the Mekong Delta in South Vietnam. The results of the grow-out
system of catfish farming in the Mekong Delta from a survey of 89 farms are presented. The farm size ranged
from 0.2 to 30 ha with a mean of 4.09 ha. The frequency distributi on of the yield in tonne/ha/crop and
tonne/ML/crop corresponded to a normal distribution curve, where 75% of the farms yielded 300 tonnes/
ha/crop or more. It was found that the yield per crop was significan tly c orrelated (p <0.05) to stocking
density, pond depth and volume but not to pond surface area. Yields per crop was significantly different
(p <0.05) between upper and lower provinces of the Mekong Delta and water source (river versus
channels), amongst others. It was evident that diseases and/or symptoms were observed to occur mostly in
accordance with the onset of rains. In this paper the history of the catfish farming in the Mekong Delta is
briefly traced, and current harvesting and marketing procedures as well as pertinent social elements of the
farming community are dealt with.
Crown Copyright © 2009 Published by Elsevier B.V. All rights reserved.
1. Introduction
The Mekong River (known in Vietnamese as the Cuu Long River),
with a mean discharge volume of 15,000 m
3
/s (the 10th highest in the
world), traverses 4,880 km through six countries, and divides into
seven major branches when it enters the Delta, approximately 170 km
from the South China Sea (van Zalinge et al., 2004). The Mekong Delta
(3.92 million ha), with a catchment of 49,367 km
2
and a population of
17.42 million (in 2004), is popularly referred to as the food basket of
Vietnam; for example, it accounted for nearly half of the national food
volume (in 2000 totalling 17.5 million tonnes), 55% of the national
fishery and fruit production and 61% of the national food export value
(Sub-Institute of Water Resources Planning, 2003).
The culture of str iped catfish, Pangasianodon hypophthalmus (Sau-
vage), also known as “ca tra” in Vietnamese, or the striped catfish and
sutchi catfish, in the Me kong Delta, Vietn am, can be c onsid ered as a
unique aquatic farming system in many ways. Production is the fastest
growth recorded i n any a quaculture sector, e ver, based o n a sing le species,
superseding the production per unit for any form of primary production
(Phuong and O anh, 2009). F urthermore, over 90% of the farmed catfish is
processed and exported to more than 100 countries globally (Nguyen,
2007; Wilkinson, 2008 ; Globefish, 2009; Phuong and Oanh, 2009).
The striped catfish from Vietnam has essentially become an
affordable ‘white fish’ substitute to the Western world, and conceiv-
ably its acceptability and popularity is growing (Intrafish, 2003;
Globefish, 2009). The term ‘white fish’ is commonly used to designate
fish with white flesh, common in Western countries, represented by
species such as cod, Gadus morhua. However, in the early growth
phases of the sector it had to overcome trade embargoes and related
restrictions that were imposed by some importing countries (Intra-
fish, 2003). Currently, such restrictions on the export of striped catfish
from Vietnam do not exist in most importing countries, apart from
conformity to food safety and food quality standards, but many issues
on its quality and the nature of farming system have been raised
(Holland, 2007; Neubacher, 2007). However, most of these negative
publicities have been mostly unfounded thus far (Mohan et al., 2008;
Orban et al., 2008; Rehbein, 2008).
Aquaculture 296 (2009) 227–236
⁎ Corresponding author. Fax: +66 2 561 1727.
E-mail address: (S.S. De Silva).
0044-8486/$ – see front matter. Crown Copyright © 2009 Published by Elsevier B.V. All rights reserved.
doi:10.1016/j.aquaculture.2009.08.017
Contents lists available at ScienceDirect
Aquaculture
journal homepage: www.elsevier.com/locate/aqua-online
Author's personal copy
The catfish farming sector in its present form is a relatively new
development in the Mekong Delta. It is thought to have become possible
when the artificial propagation of the catfish species, Pangasius bocourti
Sauvage (basa catfish) (Cacot, 1999; Cacot et al., 2002) developed and
was adopted for P. hypophthalmus. This development enabled the
traditional small scale aquaculture practices that were dependent on
wild caught seed stocks to shift to more intensified systems an d de pend
entirely on hatchery-produced seed (Trong et al., 2002). Also, over the
last decade the farming of striped catfish took precedence, and pond
farming became the dominant form because of its relatively faster
growth rate, flesh quality and appearance, therefore marketability
overseas (Phuong and Oanh, 2009; Sub-Institute for Fisheries Econom-
ics and Planning in Southern Vietnam, 2009).
The present paper attempts to describe the grow-out operations of
this aquaculture sector that is of immense socio-economic importance
to Vietnam, and globally as a provider of a much sought after cultured
food fish commodity. The work presented is associated with a re-
search conducted to develop “Better Management Practices” for
striped catfish farming in the Mekong Delta, that is considered as a key
to attaining sustainability and food safety and marketability of the
commodity, as had been demonstrated previously for example small-
scale shrimp farming in India (Umesh, 2007; Umesh et al., 2009).
2. Materials and methods
Catfish farming in the Delta occurs along two main branches, Tien
Giang (upper) and Hau Giang (lower) and the associated channels of
the Mekong River (Fig. 1). The catfish farming area falls within the
jurisdiction of nine provincial administrations of which An Giang, Can
Tho, Dong Thap and Vinh Long are the most important (Sub-Institute
Fig. 1. The location of the main striped catfish farming areas in the Mekong Delta, Vietnam, in relation to the delta as a whole.
228 L.T. Phan et al. / Aquaculture 296 (2009) 227–236
Author's personal copy
for Fisheries Economics and Planning in Southern Vietnam, 2009). The
primary data on the farming system were collected through a
structured questionnaire, farm visits and famer interviews. A total of
89 farms (An Giang, 24; Can Tho, 15; Dong Thap, 30; and Vinh Long
20) were surveyed and the details of the area covered are given in
Table 1. In each province an attempt was made to include as many
districts as possible, and the farms were randomly chosen based on a
list provided by the respective administrations.
The structured questionnaire for the grow-out farm survey was
tested randomly and appropriately revised (available on request) for the
main survey between May and July, 2008. The survey was conducted by
trained socio-economists with an aquaculture background, and in each
instance a minimum of three interviewers were involved on each farm
visit. The responses at the interviews were primarily based on the
records maintained by farmers, which in the majority ofcases went back
three to five years, and were very detailed.
The survey results were inp utted into a customised el ectronic datab ase
developed using MS Access 2007 (Microsoft Corporation, USA), then
exported to relevant statistical software packages such as MS Excel
(Microsoft Corporation, USA), SPSS (SPSS Inc., Illinois, USA) and SAS (SAS
Institute Inc., NC, USA), for performing relevant statistical analyses.
In addition relevant information on the catfish farming sector was
obtained from each of the provincial and district administration
offices of the Ministry of Agriculture and Rural Development (MARD),
and the Provincial Governments of the Government of Vietnam. Apart
from the descriptive analyses of the data, relationships between yield
(t/ha/crop) and specific parameters collected during the survey were
analysed using different statistical methods including simple linear
regression, Pearson's product moment correlation procedure and the
SAS general linear model procedure. In all instances a probability of
less than 5% (p < 0.05) was considered as significant.
3. Results and discussion
3.1. Overall status of the sector
The trend of striped catfish production in the Mekong Delta of
Vietnam has been increasing steadily over the last decade, although
there are discrepancies in the figures reported. Recent statistics show
that the production in 2007 was the highest, when it totalled
683,000 tonnes (Fig. 2), and increased to 835,000 tonnes in the first
seven months of 2008 (Sub-Institute for Fisheries Economics and
Planning in Southern Vietnam, 2009). Also, the percent contribution
of striped catfish farming to total aquaculture production in Vietnam
has increased significantly over the years, currently accounting for
approximately 30%, becoming the most important aquacu lture
practice. However, the total production and the export income from
the sector appeared to have been overestimated by some authors
(Phuong and Oanh, 2009). The quantity of processed cultured striped
catfish followed a similar trend (Fig. 3), of which over 90% is exported
throughout the world that enabled Vietnam to earn approximately
645 million US$ from this commodity in 2007 and 700 million US$ in
the first seven months of 2008 ( Sub-Institute for Fisheries Economics
and Planning in Southern Vietnam, 2009), being second only to
cultured shrimp and salmon in this respect of all cultured commod-
ities globally. It is noted that VASEP (2008) reported export value in
2007 was nearly 980 million US$. These discrepancies in production
figures could have arisen in the utilisation of unconfirmed and/or
preliminary estimations by some authors.
Over the last decade there had been a marked change in the major
striped cat
fish farming systems in the Mekong Delta. In the early
years, prior to 2001, when three farming systems operated; cage,
pond and fence (or pen), contributing almost equally to the total
striped catfish aquaculture production (Fig. 4). However, since 2003
pond culture has become predominant and currently this form domi-
nates striped catfish farming in the Delta. The reasons for this shift are
manifold and have been dealt with previously (Phuong and Oanh,
2009). The catfish farming sector supports 105,535 livelihood (full-
time equivalents), and an additional 116,000 people in the processing
sector the bulk of which is rural women (Sub-Institute for Fisheries
Economics and Planning in Southern Vietnam, 2009).
3.2. Farming practices
3.2.1. General information
A total of 89 farms were surveyed, most of these (97%) operated
one farm site, while others operated 2–4 farm sites, and consequently
some data are provided for 98 farm sites. The farm size and the water
surface area ranged from 0.2 to 30 ha (mean: 4.09 ha ±0.48 se) and
0.12 to 20 ha (mean: 2.67 ha±0.33), respectively. The number of
ponds per farm and pond size ranged from 1 to 17 (mean: 4) and 0.08
to 2.2 ha (mean of mean: 0.61± 0.03 se), respectively. No significant
differences (p> 0.05) were found in any of the above parameters
between provinces and between districts.
The frequency distributions of farm size, water surface area, and
pond size and depth are shown in Fig. 5, and it is evidenced that farm
size is highly positively skewed (skewness= 2.97), with 72% farms
being less than 5 ha, and only 9% being 10 ha or greater in size.
Therefore, catfish farm size in the Mekong Delta can be categorised as
being primarily based on relatively small holdings, farmer owned,
operated and managed, but are intensively farmed systems. This is in
accordance with most aquatic farming sectors in Asia, such as in the
case of shrimp farming in Thailand (Kongkeo, 1997) and in India
(Umesh, 2007), and generally in aquaculture in Asian countries, such
as in Thailand ( Ministry of Agriculture and Cooperatives, 2006) and
China (Ministry of Agriculture, 2007).
The cat fish farms in Vietnam, however, are rather different from
other farming sectors in Asia, in that individual pond depth ranged
from 2.0 to 6.0 m with the great majority of farms (69%) with pond
water depths of 3.5 to 4.5 m (Fig. 5). This practice is thought to have
come about through the necessity to prevent the stock from escaping
during the flood season into the main river, and therefore needing a
higher dike height than in normal circumstances (Phuong and Oanh,
2009).
Table 1
The number of operational farms in the main catfish farming provinces of the Mekong
Delta in 2008.
Province/district Grow-out Nurseries Hatcheries
An Giang 2891 farms (24) 1041 na
Chau Phu 813 (3) na na
Chau Thanh 39 (4) na na
Cho Moi 64 (7) na na
Long Xuyen 139 (6) na na
Phu Tan 720 (1) na na
Can Tho 1569 ha (15) 100 na
O Mon (3) na na
Thot Not (8) na na
Vinh Thanh (4) na na
Dong Thap 636 farms (30) 4300 83
Cao Lanh 31 (3) 6 4
Chau Thanh 151 (8) 12 2
Hong Ngu 61 (1) 51 51
Lap Vo 48 (4) 20 1
Tan Hong 38 (1) 60 2
Thanh Binh 77 (13) 0 13
Vinh Long 346 farms (20) 94 04
Binh Tan 38 (6) na na
Long Ho 53 (6) na na
Mang Thit 782 (7) na na
Vung Liem 28 (1) na na
The number of catfish farming operations surveyed in the present study is given in
parentheses (data obtained from the records of the Departments of Fisheries of the
Provincial Governments; na — unavailable; note that for Can Tho the number of farms
operating was not available but the acreage only).
229L.T. Phan et al. / Aquaculture 296 (2009) 227–236
Author's personal copy
3.2.2. Farm operations
The catfish farming operations were rarely vertically integrated,
with grow-out, nursery and hatchery sectors operating as different
entities, and even with some degree of specialisation of each of these
activities in specific provinces/districts. For example, grow-out oper-
ations occur in nine provinces, but seed production occurs mainly in
An Giang and Dong Thap provinces, where there is a concentration of
hatcheries and nurseries (see Table 1).
3.2.2.1. Water supply and pond preparation. Of the 98 farm sites
surveyed, 80% obtained water directly from the main river and the
rest from rivulets and canals. Only 6% of farms screened the inflowing
water and similarly only 3% of the farms used sedimentation ponds
prior to supplying water into the rearing ponds. Majority of the
farmers were of the view that screening was not essential and as for
sedimentation ponds the cost of land makes this option prohibitive to
most.
All farms surveyed treated pond bottoms prior to filling up with
water and stocking. The fallow period was highly variable, and ranged
from 2 to 45 days with 16, 16, 24 and 11% of the farms following a
fallow period of 7, 10, 15, and 30 days, respectively. During the fallow
period, the type of treatments adopted differed between farms. The
preferred methods of pond bottom treatment included liming (96% of
farms), sludge removal (82% of farms) and salt treatment (71% of
farms). In addition, 57% of farms applied chlorine before draining the
ponds and refilling.
When the ponds are filled, farmers adopted a varying number of
treatments prior to stocking. The most preferred treatments were
application of chlorine (29% of farms), lime (27% of farms), benzalk-
onium chloride (BKC) (15% of farms) and salt (11% of farms). The
amounts applied were also variable and did not follow a prescribed
pattern or any guidelines.
3.2.2.2. Stocking. In general, an apparent difference on seed produc-
tion and nursery rearing was evident amongst the provinces. For
example, the major seed producing provinces were An Giang and
Dong Thap (Table 1). Hatchery production of catfish occurs through-
out the year with peaks from February to September, but the data did
not suggest any relationship of seed production intensity to rain fall
pattern and/or any other climatic factor. The seedlings are reared in
specialized nursery facilities to a size of 1.0 to 8.5 cm (mean 4.5 cm) as
fry or 1.2 to 20 cm (mean 8.6 cm) as fingerlings, when these are
purchased by grow-out farmers for stocking. The furthest distance
that stocking material would be obtained is about 100 km. The stock-
ing size ranged from 1.5 to 18 cm (mean 7.8± 0.97 se) and ponds are
usually fully stocked at the one time.
Stocking densities, which varied from 18 to 125 fish/ m
2
(mean
48± 2.1 se) a nd 5 to 31 fish/m
3
(mean 12± 0. 5 se), depended on
the size and availability of seedstock and the financial capacity of
farmers to purchase seedstock. Most farms (74%) stocked ponds on
multiple occasions (staggered stocking) within a short time frame,
however. Over 90% of farms tested the seed in terms of uniformity
in size, diseases and general activity before stocking. Most farms
(76%) treat the seed before stocking, and the majority of farms
used salt (78%) and antibiotics (32%) for this purpose.
Fig. 2. The trends of change in the striped catfish farming systems in the Mekong Delta, over the last decade (based on data from Sub-Institute for Fisheries Economics and Planning in
Southern Vietnam, 2009), together with total aquaculture production (FAO, 2007), and the percentage contribution of the former to the total.
Fig. 3. Trends of in the export of frozen fillet tonnage and corresponding value (in US$).
Based on data from VASEP (2008).
Fig. 4. Trends in the common farming systems of catfish in the Mekong Delta, based on
data from the Sub-Institute for Fisheries Economics and Planning in Southern Vietnam
(2009).
230 L.T. Phan et al. / Aquaculture 296 (2009) 227–236
Author's personal copy
3.2.2.3. Feeds and feed management. Most farms (97 %) use
commercially made feed, which is purchased directly from the feed
mills or from local merchants, while, 37% of farms used farm-made
feeds, 49% of which was produced on site. It was observed that 67,
80.0 and 17% of farms surveyed in An Giang, Can Tho and Dong Thap
used farm-made feeds, respectively, yet none in Vinh Long. It should
be noted that all farm-made feeds were not necessarily made on site,
some opted to purchase from neighbours. A similar trend has also
been reported for the intensive Indian major carp farming systems in
Andhra Pradesh, India (De Silva and Hasan, 2007). Given the large fish
feed market in the Mekong Delta, many international and national
feed millers have attempted to establish in the region to obtain a share
of this market; 37 companies supplied feed to surveyed farmers.
The quality of the commercial feeds available is highly variable with
protein content ranging from 20 to 30% (mean 25.8%) (Table 2), whilst
that of farm-made feeds ranged from 17 to 26% (mean 21.6%) (authors'
observations). Detailed studies conducted on the quality of commercial
and farm-made feeds have shown that, contrary to the popular belief,
the moisture content of the two types of feeds is not significantly
different (p>0.05), varying from 8 to 10% (De Silva, unpublished data).
The main ingredients used in farm-made feeds were trash fish (marine
origin), fishmeal and in most cases powdered and or crushed dried fish
(mostly of freshwater/brackish water origin from the flood plain areas
in the Delta; see De Silva, 2008 for details), soybean meal, broken rice
and rice bran (Table 3). Vitamins, probiotics, pre-biotics and premixes
were also included in farm-made feed.
Feedingratesrangedfrom1to18%and1to10%bodyweight/dayfor
commercial feeds and farm-made feeds, respectively, were highest at the
beginning o f the p roduction c ycle when fish were small (Table 4). Feeding
rates for farm-made feeds were generally greater than for commercial
Fig. 5. Frequency distribution of (a) farm size, (b) farm water surface area, (c) mean pond size, and (d) mean pond depth, of the farms surveyed.
Table 2
The proximate composition of a random selection of commercial feeds, as specified on
the bags, used in catfish grow-out operations in the Mekong Delta.
Feed
no.
Maximum
moisture (%)
Minimum
protein (%)
Minimum total
lipid (%)
Maximum
ash (%)
Maximum
fiber (%)
01 11 30 5 na 6
02 11 22 4 10 7
03 11 26 5 10 7
04 11 28 5 10 6
05 11 22 4 10 8
06 11 26 5 10 7
07 11 26 3 14 7
08 11 28 3 14 6
09 11 26 3 12 7
10 10 26 5 na 8
11 11 20 4 na 8
12 11 30 5 na 6
The names of the producers are withheld for ethical reasons (na — not available).
231L.T. Phan et al. / Aquaculture 296 (2009) 227–236
Author's personal copy
feeds throughout the production cycle. Fish were typically fed twice per
day, but some farms fed up to six times per day (Table 3). The food
conversion ratio (FCR =amount of feed used ÷increase in biomass) for
commercial pellets and farm-made feed ranged from 1.0 to 3.0 (mean
1.69), and 1.3 to 3.0 (mean 2 .25), respectively, which differed s ignificantly
(p<0.001) from each other. The relationship between diet type and yield
was insignificant (p> 0.05), b ut pr oduction cycle if using far m-made f eed
is usually 4–8 weeks longer.
Based on a mean FCR of 1.69 for com mercial feed with a protein
content of 25%, and assuming that 30% of the nitrogen in the feed is
converted into fish flesh (De Silva and Anderson, 1995), it is estimated
(gross) that 47.3 kg nitrogen is discharged per tonne of catfish produced.
On this basis, in 2007, when 683,000 tonnes of catfish was produced i n the
whole of the Mekong Delta, approximately 3 2,306 tonnes of nitrogen was
discharged into the Mekong River. If the production was to reach 1 or
1.5 million tonnes of catfish in the ensuing years the corresponding
nitrogen discharge would approximate 47,300 and 70,950 t onnes per
year, respectively.
However, one could expect the increase in production to go hand
in hand with improvements in feed quality and management, and
these are likely to result in significant lowering of the nitrogen dis-
charges from the above levels. When compared to inputs from other
agricultural activities in the Delta, the amount of nitrogen discharged
into the main river from catfish farming is almost negligible. For
example, it has been estimated 170 to 182 kg of plant nutrients were
applied per sown ha of paddy (in 2000 paddy farming in the Delta was
7.48 million ha) (Truong, 2003). A detailed comparative study on the
nutrient loadings from different primary production sectors in the
Mekong Delta is warranted, and will facilitate a more holistic eco-
system management approach to be adopted.
3.2.2.4. Water management. As expected in this very intensive form
of catfish farming, water management plays a crucial role. Nearly 77%
of farmers monitored the water quality in fish ponds, with varying
frequency ranging from daily to once a month. The common param-
eters monitored were pH, DO and ammonia and the monitoring was
done using commercially available test kits and probes.
During the first two months following stocking, water was ex-
changed at infrequent intervals ranging from daily to once a week.
However, in latter months the frequency of exchange was gradually
increased up to twice a day, especially close to harvesting time. The
rate of exchange at any one time ranged from 30 to100% replenish-
ment. Some farms relied on daily tidal flushing of ponds.
Farms mainly discharged water directly into the main river (63%),
primary canals (19%) or onto rice fields or gardens (11%). Only 7.8% of
farms screened the water before discharging while 11.2% of farms
treated the discharge water, commonly with chlorine or lime. There
was no apparent understanding between adjacent farms with regard
to intake and discharge of water.
Aspects of water management impacts on fish production are dealt
with in Section 3.2.3.
3.2.3. Production
Catfish farm yields ranged from 70.0 to 850 tonne/ha/crop (mean
406±16 se) or, accounting for mean pond depth per farm, 1.5 to
22.7 tonne/ML/crop (mean 10.4±0.4 se). The frequency distribution of
the yield in tonne/ha/crop (Fig. 6 ) corresponded to a normal
distribution curve, where 76% of the farms yielded 300 tonne/ha/crop
or more. However, the yields at the two extremes are not the norm. Very
low yields occur in few farms due to unforseen mortalities, generally
early in the growth cycle. Conversely, yields above 550 tonne/ha/crop
are seen in farms which tend to retain the stocks until acceptable market
prices are realised. This option also involves an increase in the culture
period. The findings from the present study is consistent with those of
the Sub-Institute for Fisheries Economics and Planning in Southern
Vietnam (2009), which reports the yield of 200–400 tonne/ha/crop.
Water consumption per tonne of fish produced , which w as est imated
from fish production, farm water volume and water exchange rates for
each farm, was hig hly skewed an d ranged f rom 0.7–59.7ML/tonne (mean
6.4±0.8 se) ( Fig. 6)(0.017–1.412, mean 0.2 92tonne/ML). In comparison,
water consumption in shrimp far ming in ponds r anges from 11 t o 43ML/
Table 3
Main ingredients used in farm-made feeds.
Ingredient Percent dry
weight
g/kg feed
(when used)
Frequency of use
Broken rice 0–66 (13.4)
Rice bran 0–80 (39.4)
Fishmeal 0–50 (9.3)
Trashfish 0–50 (14.8)
Soybean cake 0–20 (1.7)
Soybean meal 0–30 (9.9)
Other
a
0–55 (12.9)
Methionine 0.05–2 (1.1) Daily to once per week
Mineral 0.5–1 (0.8) Variable
Premix 0.02–40 (3.4) Daily to twice per month
Pre-biotic (glucan) 0.01–25 (3.4) Daily to once per month
Pro-biotic 0.2–40 (2.6) Daily to twice per month
Sorbitol 0.05–3 (1.3) Variable
Vitamin C 0.05–20 (2.3) Daily to only when fish are sick
Other additives
b
1–70 (8) Daily to once per month
The range in percent dry weight of the ingredients used in farm-made feeds together
with other additives (where relevant the mean is given in parentheses).
a
Egg, cassava, catfish extract oil, marine trapfish.
b
Lysine, Vitalex, Vemedin, Vimidime, Prozyme, Pangarenol.
Table 4
Ranges in feeding rates (%/body weight/day) and frequency (mean in parentheses) in
catfish farms using commercial and farm-made feeds in the Mekong Delta.
Early: months 1–2 Middle: months 3–5 Late: months 6–7
Fish size (g) 17–150 (78) 45–1000 (337) 500–5000 (968)
Commercial feed 1–18 (5.6) 1–7 (3.2) 1–5 (2.0)
Farm-made feed 3–10 (5.7) 2–5 (3.9) 1–3 (2.3)
Feeds per day 1–4 (2.2) 1–3 (2) 1–6 (1.8)
Fig. 6. Frequency distribution of production in tonne/ha/crop (a) and tonne/ML (b) of
striped catfish farms surveyed in the Mekong Delta. The three ranges in yields I, II, III
indicate low yield arising from mortality (I), normal cycle yield (II) and unusually high
yields arising from farmers retaining stock until acceptable prices are realised (III).
232 L.T. Phan et al. / Aquaculture 296 (2009) 227–236
Author's personal copy
tonne, tank culture of salmonids — 252 M L/tonne ( Beveridge et al., 1 991).
Overall, based on the data in 2007, when 683,000 tonnes of catfish was
produced in the whole of the Mekong Delta, 4371GL of water was u sed, of
which 2754 GL was discharged back to the river. As such the amount of
water used for the production of a tonne of catfish was 4,023 m
3
,
approximately 10% higher than the estimates of Bosma et al. (2009).
The yield was positively and linearly correlated to stocking density
(fish/m
2
and fish/m
3
), pond depth and pond volume, and the relation-
ships a re depicted Fig. 7.However,yieldwasnotcorrelated(p>0.05) to
pond and farm surface area and or to fish size at stocking (length and
weight). The Sub-Institute for Fisheries Economics and Planning in
Southern Vietnam (2009) however, found a significant relatio nship be-
tween total culture area and total production (Y=e
0.01x+9115.131
;
R=0.96, p<0.05, F=118.9) and predicted that catfish production
would reach over 1 million tonne/year with a total culture area of about
6,000 ha.
The data were analysed to explore relationship of the yield to a
number of other parameters, such as location (provinces), the distance
from river mouth,source of water (directlyfrom the river versus canals),
water exchange rate calculated as the volume exchanged per week and
frequency of water exchange per week, age of the farm and feed type
used, and the results are shown in Fig. 8. Interestingly, the mean yield for
each province did not differ significantly from each other (Fig. 8a) but
when the provinces are separated into upper and lower catchments it
was significantly (p<0.05) different (Fig. 8b), where the yields in farms
in the upper catchment were higher. It is difficult to discern the reasons
for this trend and perhaps need further studies on details of the
catchment characteristics. However, it is possible that the greater tidal
range impacts in the lower region, with potential higher salinity
fluctuations influencing growth of the stock, and hence resulting in an
overall reduction in mean production.
In addition to the above, the mean yield of catfish in farms that
drew water directly from the river was significantly higher than those
farms that drew water from canals (Fig. 8c). This may have con-
tributed to the regional difference in production since 83% of farms in
the upper catchment drew water from the river compared to 78% of
farms in the lower catchment. Surprisingly, however, yields were not
correlated to water exchange frequency and or the volume exchanged
per week, and the means for each of these parameters also were not
significantly different (p > 0.05) from each other (Fig. 8d) and nor was
the yield to the distance from the sea mouth.
The feeds used in catfish farming are variable, as pointed out
previously in Section 3.2.2.3. Interestingly, the mean yield of farms
feeding farm-made feeds was higher compared to the other two,
though not significant (Fig. 8f). However, culture cycle when using
farm-made feed is often 4–6 weeks longer than using commercial
feed. The efficacy of use of farm-made feeds as opposed to commercial
feed has been a bone of contention, on the ground of resource usage,
environmental impacts, amongst othe rs, for many aquaculture
commodities (New et al., 1994; Hasan et al., 2008). However, it has
also been shown previously in respect of shrimp farming that farm-
made feeds resulted in higher efficacy than commercial feeds (Wood
et al., 1992). In the catfish farming sector, majority of farmers was of
the view that using farm-made feed not only resulted in a better
production but also was cheaper or more cost effective. For example,
from the survey results the unit production cost for farm-made feed
was 13,722±1385 VND (range: 11,500
–15,500) as opposed to 14,
372± 1374 VND (range: 11,000–17,000) for commercial feeds. How-
ever, this difference was not statistically significant (p> 0.05). Farm-
ers generally had difficulty in sourcing the required ingredients on a
regular basis and as a result resorted to using commercial feeds.
3.2.4. Disease occurrence
Levels of cumulative mortality varied from one farm to the next as
well as throughout the production cycle. Mortality of fish in the first
week following stocking ranged from 0–30% (mean 7%). The level of
Fig. 7. Relationships between yield (tonne/ha/crop) and (a) stocking density as fish m
− 2
(yield=221.2+4.03×density (adj. R
2
=0.1742, p= 0.0001), (b) stocking density as fish/
m
3
(yield=270.5+12.0×density, adj. R
2
=0.08, p = 0.008), (c) pond volume (yield = 348.5 + 2.4×volume, adj. R
2
=0.0470, p = 0.0235), and (d) pond depth (yield=149.4+
65.3×depth, adj. R
2
=0.0615, p=0.0117). Broken lines represent 95% confidence limits for mean predicted values.
233L.T. Phan et al. / Aquaculture 296 (2009) 227–236