Báo cáo hóa học: " Synthesis and Characterization of ZnO Nanorods and Nanodisks from Zinc Chloride Aqueous Solution" pptx
Bạn đang xem bản rút gọn của tài liệu. Xem và tải ngay bản đầy đủ của tài liệu tại đây (730.76 KB, 7 trang )
NANO EXPRESS
Synthesis and Characterization of ZnO Nanorods and Nanodisks
from Zinc Chloride Aqueous Solution
Tengfa Long Æ Shu Yin Æ Kouta Takabatake Æ
Peilin Zhnag Æ Tsugio Sato
Received: 12 November 2008 / Accepted: 2 December 2008 / Published online: 16 December 2008
Ó to the authors 2008
Abstract ZnO nanorods and nanodisks were synthesized
by solution process using zinc chloride as starting material.
The morphology of ZnO crystal changed greatly depending
on the concentrations of Zn
2?
ion and ethylene glycohol
(EG) additive in the solution. The effect of thermal treat-
ment on the morphology was investigated. Photocatalytic
activities of plate-like Zn
5
(OH)
8
Cl
2
Á H
2
O and rod-like
ZnO were characterized. About 18% of 1 ppm NO could
be continuously removed by ZnO particles under UV light
irradiation.
Keywords ZnO nanorod Á ZnO nanodisk Á
Photocatalytic activity Á Zinc chloride
Introduction
Zinc oxide with a hexagonal wurtzite crystal structure
possesses unique optical and electronic properties, and
wide applications on piezoelectric devices, transistors,
photodiodes, photocatalysis [1–4], etc. In recent years,
much attention has been paid to nanostructure ZnO mate-
rials, and various morphologies of ZnO such as nanowire,
nanorod, nanotube, nanobelt, nanoring, nanoneedles, and
hollow structures, etc. have been developed [5–14]. Many
methods have been employed for the morphological con-
trol of ZnO crystal, such as pulsed laser deposition(PLD)
[15], chemical vapor deposition [16], spray pyrolysis
[17, 18], thermal evaporation [19], wet-chemical route
[20, 21], etc., in which the wet chemical route has been
becoming a charming method due to the mild reaction
condition and simplicity of the synthesis process. It is
important to prepare well-crystallized and orientated ZnO
nanoparticles. In most solution processes for the synthesis
of ZnO nanoparticles, zinc acetate, and zinc nitrate are
used as starting materials [21–24], but using zinc chloride
as a starting material was seldom reported. In the present
study, ZnO with rod-like and plate-like structure were
successfully synthesized from zinc chloride aqueous solu-
tion, and their photocatalytic properties were characterized.
Experimental
ZnCl
2
, hexamethylenetetramine (HMT, C
6
H
12
N
4
), ethyl-
ene glycol (EG), commercial ZnO powder, butyl acetate,
ethyl acetate, and nitrocellulose were used as starting
materials. All these chemicals were used as delivered
without further purification. Firstly, the cleaned borosili-
cate glass substrate was coated with thin film of ZnO
nanoparticles by a spin-coater (Mikasa 1H-D7). The coat-
ing liquid was prepared by uniformly mixing 1 g
commercial ZnO nano particles (Sumitomo Osaka Cement
ZnO-350) with 2 g of industrial grade nitrocellulose, 5 g of
ethyl acetate and 5 g of butyl acetate together with 50 g
zirconia balls of 2.7 mm diameter with ball milling using a
plastic bottle for 40 h. Then, the prepared substrate was
calcined at 400 °C for 1 h. For the second step, the equi-
molar of ZnCl
2
and HMT were dissolved in water or
50 vol.% EG aqueous solution. The ZnO nanoparticles
coated glass substrates obtained in the first step were dip-
ped into 50 mL of as-prepared solution containing a
desired concentration of ZnCl
2
–HMT mixture and the
T. Long
Guangxi Normal University, Guilin, People’s Republic of China
T. Long Á S. Yin (&) Á K. Takabatake Á P. Zhnag Á T. Sato
IMRAM, Tohoku University, Sendai, Japan
e-mail:
123
Nanoscale Res Lett (2009) 4:247–253
DOI 10.1007/s11671-008-9233-2
solution was kept at 95 °C for 12 h in a sealed silicate-
glass bottle. Finally, the glass substrate was taken out and
washed with distilled water and acetone, then vacuum dried
at 80 °C for 1 h. The morphology of the crystals was
observed by SEM (Hitachi S-4800) and TEM (JOEL JEM-
2000EX). The crystalline phase of the products was
determined by X-ray diffraction analysis (XD-01,SHI-
MADZU). The specific surface area (SSA) was evaluated
by nitrogen adsorption–desorption isothermal measurement
at 77 K (NOVA-4200e). FT–IR measurements were con-
ducted using the FTS7000 series (DIGILIB). Thermal
gravimetry and differential thermal analysis (TG–DTA)
curves were traced on a Rigaku Thermoflex (TG8101D) at
a heating rate of 10 °C/min in air. The diffuse reflectance
spectra of the samples were measured using an UV–vis
spectrophotometer (Shimadzu UV-2450). The photocata-
lytic activity was evaluated by the oxidative destruction of
nitrogen monoxide under irradiation of high pressure
mercury arc of various light wavelengths using a flow type
reactor with a NO
x
analyzer (Yanaco, ECL-88A) [25].
Results and Discussion
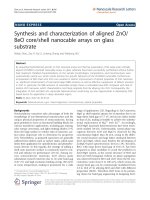
Figure 1 shows the morphologies of the samples prepared
in aqueous solutions of equimolar of ZnCl
2
–HMT mixture
with and without 50 vol.% EG additive. The initial con-
centrations of Zn
2?
were 0.01 M, 0.05 M, and 0.1 M,
respectively. The morphology of the product changed
greatly depending on EG additive and concentration of
Zn
2?
. In the absence of EG, at such low initial ZnCl
2
–
HMT concentration of 0.01 M, the product exhibited uni-
form spindle-like structure with the length of more than
20 lm (Fig. 1a). When ZnCl
2
–HMT concentration
increased to 0.05 M, hexagonal plate-like morphology
with diameter of about 50 lm was formed (Fig. 1b, c).
In contrast, with 50 vol.% EG additive in the 0.01 M
ZnCl
2
–HMT mixed aqueous solution, instead of spindle-
like structure, ellipse-like head rod structure with smaller
size (half length to that of spindle-like structure (Fig. 1a)
was formed (Fig. 1d). When the initial concentration of
ZnCl
2
–HMT reached 0.05 M, the morphology changed to a
rod-like hexagonal structure (Fig. 1e). When ZnCl
2
–HMT
concentration was 0.1 M, as shown in Fig. 1f, the product
exhibited similar hexagonal plate-like morphology to that
in the absence of EG, whereas the plate-like particle size
decreased to about half to that prepared at the same zinc
concentration in the absence of EG (Fig. 1c). These results
indicated that zinc ion concentration and EG additive acted
very important roles in the morphological control of par-
ticles during the solution synthesis process. The existence
of EG made the crystals to grow homogeneously due to its
good dispersibility and glutinosity. It was also found that in
the absence of HMT in 0.1 M ZnCl
2
solution, only small
amount of products with nonhomogeneous morphologies
consisted of spherical and rod-like structure could be
obtained, although the image was not shown here.
Figure 2 shows the XRD patterns of the samples pre-
pared in various concentrations of ZnCl
2
–HMT aqueous
solutions with and without 50 vol.% EG additive. The
spindle-like particles prepared in 0.01 M ZnCl
2
–HMT
aqueous solution and ellipse-like head rod-like particles
and rod-like particles prepared in 0.01 and 0.05 M ZnCl
2
–
HMT–50vol.% EG aqueous solution possessed typical
hexagonal wurtzite-type ZnO structure (ICSD No. 89-
1397). The relative intensity of (100) and (101) peaks
increased with increment of zinc ion concentration. On the
other hand, the samples with hexagonal plate-like mor-
phology prepared in 0.05 and 0.1 M ZnCl
2
–HMT aqueous
solution and in 0.1 M ZnCl
2
–HMT–50% EG aqueous
solution displayed quite different diffraction profiles con-
sisting of the peaks at 2h = 11.2
°
, 22.5
°
, 33.5
°
, 44.3
°
, 53.8
°
Fig. 1 SEM photographs of the
crystals prepared at 95 °C for
12 h in a 0.01 M, b 0.05 M, c
0.1 M ZnCl
2
–HMT mixed
aqueous solution and in d
0.01 M, e 0.05 M, f 0.1 M
ZnCl
2
–HMT mixed 50 vol.%
EG aqueous solution
248 Nanoscale Res Lett (2009) 4:247–253
123
and 58.3
°
, which might be ascribed to simonkolleite
structure Zn
5
(OH)
8
Cl
2
Á H
2
O (ICSD No. 77-2311). These
phenomena were quite different with previous results, in
which only wurtzite-type ZnO crystals formed using
Zn(NO
3
)
2
and Zn(CH
3
COO)
2
as Zn
2?
source. The plate-
like structure strongly related to the formation of simo-
nkolleite possessing layered structure [26]. It might be
inferred that the high concentration of zinc ion and chloride
ion preferred to form simonkolleite structure. Since the
formations of ZnO and Zn
5
(OH)
8
Cl
2
Á H
2
O shown by
Eqs. 1–3, might proceed competitively in the solution, the
formation of Zn
5
(OH)
8
Cl
2
Á H
2
O became dominant at high
chloride ion concentration.
HMT ! Zn OHðÞ
2
! ZnO + H
2
O ð1Þ
Zn
2þ
+ 2OH
À
! Zn OHðÞ
2
! ZnO + H
2
O ð2Þ
5Zn
2þ
+ 8OH
À
+ 2Cl
À
+H
2
O ! Zn
5
OHðÞ
8
Cl
2
Á H
2
O
ð3Þ
The samples with various morphologies prepared in
aqueous solution and 50% EG aqueous solution were
characterized. Figure 3 shows the FT–IR spectra of the
prepared rod-like ZnO and plate-like Zn
5
(OH)
8
Cl
2
Á H
2
O
samples. It is accepted that zincite (ZnO) only has the
bands in the 350–600 cm
-1
region corresponds to the zinc–
oxygen bond [27]. It was obvious that Fig. 3a , c showed
the similar spectra with that of ZnO crystal. On the other
hand, the samples b and d in Fig. 3 showed quite different
spectra to those of Fig. 3a, c. A strong band due to
deformation vibration of H
2
O molecules at 1,630 cm
-1
,an
absorption band centered at 3,434 cm
-1
represented the
characteristic of an O–H stretching vibration, and intensive
bands at 898 and 720 cm
-1
due to stretching vibration
modes of chloride ion [28–30] were observed. These
results indicated that simonkolleite (Zn
5
(OH)
8
Cl
2
Á H
2
O)
preferred to be formed at increased chloride ion concen-
tration. These FT–IR data agreed with the XRD patterns
shown in Fig. 2.
Figure 4 showed the TG–DTA curves of the hexagonal
plate-like simonkolleite samples. The samples prepared in
different zinc ion concentration showed similar TG–DTA
curves. The weight loss until 100–120 °C was related to the
adsorbed water molecules on the surface of the samples.
Other two obvious weight loss accompanying with endo-
thermic peak could be observed around 200 and 380 °C,
respectively. These weight loss might be ascribed to the
dehydration from OH
-
groups and release of hydrogen
chloride from the simonkolleite Zn
5
(OH)
8
Cl
2
Á H
2
Oas
shown by Eq. 4.[23]
Zn
5
OHðÞ
8
Cl
2
Á H
2
O ! 5ZnO þ 4H
2
O þ 2HCl ð4Þ
At high temperature, Zn
5
(OH)
8
Cl
2
Á H
2
O decomposed
completely to form ZnO. According to Eq. 4, the trans-
formation of simonkolleite Zn
5
(OH)
8
Cl
2
Á H
2
O to ZnO
results in the weight loss of 26.3 wt%. The weight losses
above 120 °C shown in Fig. 4 were 26–28 wt% which
agreed well to the calculated value.
To confirm the morphological change and phase
transformation behavior of the hexagonal plate-like simo-
nkolleite, the sample was heat treated in air at 300, 600,
and 1200 °C, and their XRD patterns and SEM photo-
graphs are shown in Figs. 5 and 6, respectively. As shown
in Fig. 5, diffraction peaks of simonkolleite gradually
disappeared with increment of treatment temperature. After
heat treatment at 600 °C, only the characteristic peak of
well crystallized ZnO could be observed. In additional, it
10 20 30 40 50 60 70 80
(018)
(110)
(113)
(202)
(205)
(208)
(128)
(006)
(119)
(220)
(015)
(101)
(006)
(003)
(200)
(201)
(112)
(103)
(102)
(110)
(002)
(101)
(a)
(f)
(e)
(d)
(c)
(b)
Intensity/a.u.
2 Theta(degree)
(100)
Fig. 2 XRD patterns of the products prepared at 95 °C for 12 h in a
0.01 M, b 0.05 M, c 0.1 M ZnCl
2
–HMT mixed aqueous solution and
in d 0.01 M, e 0.05 M, f 0.1 M ZnCl
2
–HMT mixed 50 vol.% EG
solution. b, c, f: simonkolleite: Zn
5
(OH)
8
Cl
2
Á H
2
O; a, d, e: wurtzite
ZnO
ZnO
ZnO
Zn
5
(OH)
8
Cl
2
.H
2
O
Zn
5
(OH)
8
Cl
2
.H
2
O
Wavenumber/cm
-1
(a)
(b)
(c)
(d)
Transmittance
Fig. 3 FT–IR spectra of samples prepared at 95 °Cina 0.01 M, b
0.05 M ZnCl
2
–HMT mixed aqueous solution; and those prepared in c
0.05 M, d 0.1 M ZnCl
2
–HMT mixed 50 vol.% EG aqueous solution
Nanoscale Res Lett (2009) 4:247–253 249
123
might be observed that the (002) peak of the sample pre-
pared by calcination showed higher intensity than those of
(100) and (101) peaks, indicating the preferred orientation
of ZnO particles, remember usually the ZnO possessed
comparatively weak (002) peak intensity (ICSD No. 89-
1397).
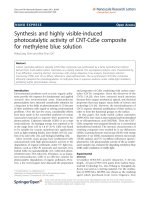
Figure 6 indicated that the morphology also changed
during the heat treatment process. After heat treatment at
300 ° C, some weak trace of porous structure on the surface
of the samples could be observed. With the increment of
treatment temperature, the porosity on the sample surface
increased. This behavior related to the decomposition of
simonkolleite structure, i.e., the increment of porosity
might be caused by the release of water and hydrogen
chloride from Zn
5
(OH)
8
Cl
2
Á H
2
O at high temperature.
Figure 7 shows the TEM photographs of the plate-like
Zn
5
(OH)
8
Cl
2
Á H
2
O and those after thermal treatment at
different temperatures. It is obvious that plate-like
Zn
5
(OH)
8
Cl
2
Á H
2
O possessed smooth surface and those
after thermal treatment possessed porous structure, and the
porosity increased with treatment temperature.
The SSA and deNO
x
photocatalytic activities of the as-
prepared samples with different morphologies were char-
acterized. For comparison, a standard titania photocatalyst
aeroxide
Ò
P25 was also characterized and the results are
summarized in Table 1. The aeroxide
Ò
\P25 titania powder
is usually used as a reference sample in photocatalytic
200
-50
-40
-30
-20
-10
0
-40
-20
0
20
40
60
80
Heat flow /%
Weight loss/%
Temperature / °C
(a)
(b)
12001000800600400
Fig. 4 TG-DTA curves of the typical simonkolleite samples prepared
in (a) 0.05 M ZnCl
2
–HMT mixed aqueous solution (b) 0.1 M ZnCl
2
–
HMT mixed 50 vol.% EG aqueous solution
10
(003)
(205)
(220)
(103)
(102)
(100)
(101)
(002)
(128)
(208)
(202)
(113)
(015)
(101)
(110)
(110)
(006)
(h)
(g)
(f)
(e)
(d)
(c)
(b)
(a)
Intensitiy
2 Theta(degree)
(003)
80706050403020
Fig. 5 XRD patterns of samples prepared in (a) 0.05 M ZnCl
2
–HMT
mixed aqueous solution followed by calcination at (b) 300 °C, (c)
600 °C, (d) 1200 °C; and in (e) 0.5 M ZnCl
2
- HMT mixed 50 vol.%
EG aqueous solution followed by calcination at (f) 300 °C,
(g) 600 °C, (h) 1200 °C
Fig. 6 SEM images of samples prepared in (a) 0.05 M ZnCl
2
–HMT mixed aqueous solution followed by calcination at (b) 300 °C, (c) 600 °C,
(d) 1200 °C; and in (e) 0.1 M ZnCl
2
–HMT mixed 50 vol.% EG aqueous solution followed by calcination at (f) 300 °C, (g) 600 °C, (h) 1200 °C
250 Nanoscale Res Lett (2009) 4:247–253
123
research, because of its high photocatalytic activity. As
shown in the Table 1, the Zn
5
(OH)
8
Cl
2
Á H
2
O with hex-
agonal plate-like structure prepared in both water or
50vol.% EG aqueous solution showed such high BET
specific surface areas as 19.4 m
2
/g and 19.7 m
2
/g, respec-
tively, while those of the as-prepared rod-like ZnO showed
low values of 3–4 m
2
/g, however, ZnO samples showed
higher deNO
x
activity than those of Zn
5
(OH)
8
Cl
2
Á H
2
O.
The high SSA of the simonkolleite might be related to its
very thin plate-like structure. Although the prepared sam-
ples showed lower photocatalytic activity compared with
commercial titania powders, it was notable that about 18%
of 1 ppm NO was continuously removed under UV light
irradiation.
Figure 8 shows the DRS spectra of the samples prepared
at 95 °C in ZnCl
2
–HMT mixed aqueous solution and
50 vol.% EG aqueous solution together with that of com-
mercial ZnO. The spindle-like ZnO showed similar DRS
Fig. 7 TEM images of samples
prepared in (a) 0.1 M ZnCl
2
–
HMT mixed 50 vol.% EG
aqueous solution followed by
calcination at (b) 300 °C, (c)
600 °C, (d) 1200 °C
Table 1 SSA and deNO
x
ability of the samples prepared under different conditions, together with those of P25 titania
Sample Synthesis condition Morphology SSA
(m
2
/g)
DeNO
x
photocatalytic
activity (%)
[410 nm [290 nm
P25 Titania AEROXIDE
Ò
Commercial – 55.9 28.3 37.5
ZnO 0.01 M ZnCl
2
–HMT mixed aqueous solution Spindle-like 4.3 4.25 18.1
Zn
5
(OH)
8
Cl
2
Á H
2
O 0.05 M ZnCl
2
–HMT mixed aqueous solution Plate-like 19.4 2.01 11.7
ZnO 0.05 M ZnCl
2
–HMT mixed 50% EG solution Hexagonal rod-like 3.2 0 17.7
Zn
5
(OH)
8
Cl
2
Á H
2
O 0.1 M ZnCl
2
–HMT mixed 50% EG solution Plate-like 19.7 0 11.2
Nanoscale Res Lett (2009) 4:247–253 251
123
spectra with that of commercial ZnO powders, while that
of plate-like simonkolleite showed quite different spectra,
indicating very low absorption ability of UV light above
290 nm. This result agreed with those in Table 1, in which
the ZnO samples showed higher photocatalytic deNO
x
ability than those of plate-like simonkolleite samples
although the SSA was smaller.
Conclusions
Based on above results, the following conclusions might be
drawn: The morphology and crystalline phase of the
product by the heat treatment of ZnCl
2
–HMT aqueous
solution with and without EG changed greatly depending
on the concentrations of Zn
2?
ion and EG additive in the
solution. Layered hexagonal plate-like Zn
5
(OH)
8
Cl
2
Á H
2
O
were formed in 0.05 M and 0.1 M ZnCl
2
–HMT mixed
aqueous solution and in 0.1 M ZnCl
2
–HMT mixed
50 vol.% EG aqueous solution. The existence of EG in the
solution promote the homogeneous crystal growth, and also
delay the formation of hexagonal plate-like structure.
Hexagonal plate-like Zn
5
(OH)
8
Cl
2
Á H
2
O have compara-
tively higher SSA than that of rod-like ZnO crystal
fabricated by the same method. Although the prepared ZnO
samples showed lower photocatalytic activity compared
with commercial titania powders, about 18% of 1 ppm NO
was continuously removed.
Acknowledgments This research was carried out as one of the
projects under the Special Education and Research Expenses on
‘‘Post-Silicon Materials and Devices Research Alliance’’ and the
JSPS Asian Core Program ‘‘Interdisciplinary Science of Nanoma-
terials’’, JSPS Core University Program (CUP), supported by
Nippon Sheet Glass Foundation for Materials Science and Engi-
neering, Research for Promoting Technological Seeds, JST, and a
Grant-in-Aid for Science Research (No.20360293).
References
1. Y.W. Zhu, H.Z. Zhang, X.C. Sun, S.Q. Feng, J. Xu, Q. Zhao, B.
Xiang, R.M. Wang, Appl. Phys. Lett. 83, 144–146 (2003). doi:
10.1063/1.1589166
2. K. Keis, C. Bauer, G. Boschloo, A. Hagfeldt, K. Westermark, H.
Rensmo, H. Siegbahn, J. Photochem. Photobiol. A Chem. 148,
57–64 (2002)
3. L. Luo, Y. Zhang, S.S. Mao, L. Lin, Sens. Actuators A Phys. 127,
201–206 (2006). doi:10.1016/j.sna.2005.06.023
4. Y. Zhang, F. Zhu, J. Zhang, L. Xia, Nanoscale Res. Lett. 3, 201–
204 (2008). doi:10.1007/s11671-008-9136-2
5. Z.L. Wang, J. Song, Science 312, 242–246 (2006). doi:10.1126/
science.1124005
6. X.M. Sun, X. Chen, Z.X. Deng, Y.D. Li, Mater. Chem. Phys. 78,
99–104 (2003). doi:10.1016/S0254-0584(02)00310-3
7. Y.X. Chen, X.Q. Zhao, B. Sha, J.H. Chen, Mater. Lett. 62, 2369–
2371 (2008). doi:10.1016/j.matlet.2007.12.004
8. Z.W. Pan, Z.R. Dai, Z.L. Wang, Science 291, 1947–1949 (2001).
doi:10.1126/science.1058120
9. X.Y. Kong, Y. Ding, R. Ying, Z.L. Wang, Science 303, 1348–
1351 (2004). doi:10.1126/science.1092356
10. T.Y. Kim, J.Y. Kim, S.H. Lee, H.W. Shim, S.H. Lee, E.K. Suh,
K.S. Nahm, Synth. Met. 144, 61–68 (2004). doi:10.1016/
j.synthmet.2004.01.010
11. L.M. Shen, N.Z. Bao, K. Yanagisawa, K. Domen, C.A. Grimes,
A. Gupta, J. Phys. Chem. C 111, 7280–7287 (2007). doi:10.1021/
jp0708603
12. C. Yan, D. Xue, Funct. Mater. Lett. 1, 37–42 (2008). doi:
10.1142/S1793604708000083
13. C. Yan, D. Xue, J. Phys. Chem. B 110, 7102–7106 (2006). doi:
10.1021/jp057382l
14. C. Yan, J. Liu, J. Wu, K. Gao, D. Xue, Nanoscale Res. Lett. 3,
473–480 (2008). doi:10.1007/s11671-008-9193-6
15. T.K. Subramanyam, B. Srinivasulu Naidu, S. Uthanna, Cryst.
Res. Technol. 35, 1193–1202 (2000). doi:10.1002/1521-4079
(200010)35:10\1193::AID-CRAT1193[3.0.CO;2-6
16. X. Zhang, S.Y. Xie, Z.Y. Jiang, X. Zhnag, Z.Q. Tian, Z.X. Xie,
R.B. Huang, L.S. Zheng, J. Phys. Chem. B 107, 10114–10118
(2003). doi:10.1021/jp034487k
17. J. Wienke, A.S. Booij, Thin Solid Films 516, 4508–4512 (2008).
doi:10.1016/j.tsf.2007.05.078
18. T. Dedova, O. Volobujeva, J. Klauson, A. Mere, M. Krunks,
Nanoscale Res. Lett. 2, 391–396 (2007). doi:10.1007/s11671-
007-9072-6
19. A. Umar, S.H. Kim, J.H. Kim, Y.B. Hahn, Mater. Lett. 62, 167–
171 (2008). doi:10.1016/j.matlet.2007.04.098
20. P. Jiang, J.J. Zhou, H.F. Fang, Mater. Lett. 60, 2516–2521 (2006).
doi:10.1016/j.matlet.2006.01.041
21. S. Yin, T. Sato, J. Mater. Chem. 15, 4584–4587 (2005). doi:
10.1039/b512239b
22. S. Yin, R. LI, T. SATO, Adv. Sci. Technol. 45, 679 (2006)
23. H. Bahadur, A.K. Srivastava, R.K. Sharma, S. Chandra, Nano-
scale Res. Lett. 2, 469–475 (2007). doi:10.1007/s11671-007-
9089-x
24. T. Long, K. Takabatake, S. Yin, T. Sato, J. Cryst. Growth,
in press (2008). doi: 10.1016/j.jcrysgro.2008.09.048
25. S. Yin, H. Hasegawa, D. Maeda, M. Ishitsuka, T. Sato,
J. Photochem. Photobiol. A Chem. 163, 1–8 (2004). doi:10.1016/
S1010-6030(03)00289-2
200
0
20
40
60
80
100
(c)
(b)
Reflectance / %
Wavelength / nm
(a)
700600
500400
300
Fig. 8 DRS spectra of samples prepared at 95 °Cin(a) 0.01 M
ZnCl
2
–HMT mixed aqueous solution (spindle-like ZnO), (b) 0.1 M
ZnCl
2
–HMT mixed 50 vol.% EG aqueous solution (plate-like simo-
nkolleite). (c) commercial ZnO
252 Nanoscale Res Lett (2009) 4:247–253
123
26. W.X. Zhang, K. Yanagisawa, Chem. Mater. 19, 2329–2334
(2007). doi:10.1021/cm0626841
27. Q. Qu, C. Yan, Y. Wan, C. Cao, Corros. Sci. 44, 2789–2803
(2002). doi:10.1016/S0010-938X(02)00076-8
28. N.V. Bhat, M.M. Nate, M.B. Kurup, V.A. Bambole, Nucl.
Instrum. Methods Phys. Res. B 262, 39–45 (2007)
29. T. Ishikawa, K. Matsumoto, K. Kandori, T. Nakayama, Colloids
Surf. A Physicochem. Eng. Asp. 293, 135–145 (2007). doi:
10.1016/j.colsurfa.2006.07.018
30. H. Tanaka, A. Fujioka, A. Futoyu, K. Kandori, T. Ishikawa,
J. Solid State Chem. 180, 2061–2066 (2007). doi:10.1016/j.jssc.
2007.05.001
Nanoscale Res Lett (2009) 4:247–253 253
123