Báo cáo hóa học: " On the Chemical Origin of the Gap Bowing in (GaAs)12xGe2x Alloys: A Combined DFT–QSGW Stud" pptx
Bạn đang xem bản rút gọn của tài liệu. Xem và tải ngay bản đầy đủ của tài liệu tại đây (518.98 KB, 9 trang )
SPECIAL ISSUE ARTICLE
On the Chemical Origin of the Gap Bowing in (GaAs)
12x
Ge
2x
Alloys: A Combined DFT–QSGW Study
Giacomo Giorgi
•
Mark Van Schilfgaarde
•
Anatoli Korkin
•
Koichi Yamashita
Received: 20 November 2009 / Accepted: 17 December 2009 / Published online: 7 January 2010
Ó The Author(s) 2010. This article is published with open access at Springerlink.com
Abstract Motivated by the research and analysis of new
materials for photovoltaics and by the possibility of tai-
loring their optical properties for improved solar energy
conversion, we have focused our attention on the
(GaAs)
12x
Ge
2x
series of alloys. We have investigated the
structural properties of some (GaAs)
12x
Ge
2x
compounds
within the local-density approximation to density-func-
tional theory, and their optical properties within the Qua-
siparticle Self-consistent GW approximation. The QSGW
results confirm the experimental evidence of asymmetric
bandgap bowing. It is explained in terms of violations of
the octet rule, as well as in terms of the order–disorder
phase transition.
Keywords Photovoltaics Á III–V IV-doped alloys Á
Bandgap bowing Á Order–disorder phase transition Á
DFT Á Quasiparticle Self-consistent GW
Introduction
The design of semiconductors with controlled bandgaps
E
G
, unit cell parameters, and low defect concentration is
the ultimate aim in several important areas of industrial
applications—electronics, photonics, light-emitting devi-
ces, and photovoltaics (PV). Efficient collection of solar
energy requires materials that absorb light from different
portions of the solar spectrum, followed by efficient con-
version into electrons and holes at p–n junctions. A natural
approach to the design of new semiconductors is to alloy
two materials with similar lattice parameters but different
bandgaps. For example, Ge (E
G
= 0.67 eV [1] at 300 K)
and GaAs (E
G
= 1.43 eV [1] at 300 K) have very similar
lattice parameters, 5.649 and 5.66 A
˚
, respectively [2, 3].
There is thus the appealing possibility that (GaAs)
12x
Ge
2x
alloys with intermediate bandgaps can be realized, in par-
ticular one characterized by a direct gap, 1 \ E
G
\ 1.4 eV
(i.e., the average between the bandgaps of Ge and GaAs),
which corresponds to the maximum efficiency solar cell for
a single bandgap material [4]. Indeed, several theoretical
[5–12] and experimental [13–18] papers have been pub-
lished on studies of metastable alloys between III–V and
IV group semiconductors, formally (III–V)
12x
(IV)
2x
compounds.
A group of such mixed single crystal metastable semi-
conductors covering a wide composition range was syn-
thesized by vapor phase deposition techniques. Noreika
et al. [17] deposited (GaAs)
12x
Si
x
on GaAs(111) by the
reactive rf sputtering technique, and they reported an
optical bandgap at room temperature of about 1.28 eV for
(GaAs)
0.45
Si
0.55
. Baker et al. [18] measured the Raman
spectra of (GaSb)
12x
Ge
x
alloys, and found both GaSb- and
Ge-like optical modes. The Ge-like mode frequency
depends on the alloy’s composition within about 40 cm
-1
,
whereas the GaSb-like mode does not.
(III–V)–IV alloys such as (GaAs)
12x
Ge
2x
, characteris-
tically display a large negative, V-shaped bowing of E
G
as
a function of the alloy composition x. A minimum value of
*0.5 eV was detected by Barnett et al. [13] at a Ge con-
centration of about 35%, corresponding to the critical value
(x
c
) for phase transition between an ordered zincblende
(ZB) and a disordered diamond structure. In the ordered
G. Giorgi (&) Á K. Yamashita
Department of Chemical System Engineering,
School of Engineering, University of Tokyo,
Tokyo 113-8656, Japan
e-mail:
M. Van Schilfgaarde Á A. Korkin
Arizona State University, Tempe, AZ 85287, USA
123
Nanoscale Res Lett (2010) 5:469–477
DOI 10.1007/s11671-009-9516-2
GaAs-rich phase, Ga and As preferentially form donor–
acceptor pairs, whereas in the Ge-rich phase, they are
randomly distributed in the alloy forming a mixture of
n-type (As in Ge) and p-type (Ga in Ge) semiconductors.
This phase transition has been put forward to explain [19]
the large bowing. Several models have been developed for
the ZB ? diamond phase transition [8, 19–26]. The sto-
chastic model by Kim and Stern [22] well reproduces this
phase transition along the \100[ direction at x
c
= 0.3.
However, it poorly describes the growth along the \111[
direction, with accumulation of Ge on alternate {111}
planes. In general, kinetic models seem to be more
appropriate descriptors of the ZB—diamond phase transi-
tion than thermodynamic ones: the latter do not take into
account the nonuniqueness of the critical composition x
c
as
a function of kinetic growth; they require as input the
critical concentration at which the transition takes place,
but no restrictions on the formation of Ga–Ga and As–As
bonds are imposed. Other models based on the percolation
method [26] lead to ZB ? diamond transition at
x
c
= 0.57; percolation theory also does not account for
different growth conditions. Rodriguez et al. [8] reported
that the growth direction and avoidance of ‘‘bad bond’’
formation (i.e., Ga–Ga and As–As bonds) (long-range
order, LRO) effects are the main factors responsible for
atomic ordering in (GaAs)
12x
Ge
2x
alloys. According to the
same model, E
G
is influenced only by nearest neighbor
(NN) atomic interactions (short-range order, SRO) effects.
In an extension of the stochastic model of growth along the
\100[direction, Holloway and Davis [23, 24] formulated
a model for alloys grown in the \100[ and \111[
directions. SRO effects are common for these two direc-
tions. In contrast, the impact of LRO is quite different: a
tendency to convert to \111[As growth is predicted [24]
as a consequence of the instability of the growth in the
\111[ Ga direction. In a previous paper [25], the same
authors note that the transition from ZB to diamond does
not affect the energy gap of (GaAs)
12x
Ge
2x
: this model
predicts a critical concentration for the order–disorder
transition with x
c
= 0.75, without any dependence on the
method of growth. SRO and LRO effects on the electronic
properties of many other IV-doped III–V alloys have also
been compared by combining the special quasirandom
structures (SQS) and the simulated-annealing (SA) meth-
ods for cells of various sizes in conjunction with an
empirical pseudopotential approach [27]. In particular, the
direct bandgaps of ideal random Al
12x
Ga
x
As, Ga
12x
In
x
P,
and Al
12x
In
x
As alloys were studied. SRO effects are
reported to increase the optical bowing of the direct
bandgap.
Surface faceting has also been detected in these systems,
reported to take place with a subsequent phase separation
between the GaAs-rich ZB and Ge-rich diamond region
during the growth on (001)-oriented GaAs substrates [15].
A direct consequence attributable to the faceting is the
bandgap narrowing of such (GaAs)
12x
Ge
2x
(0 \ x \ 0.22)
alloy layers grown by low-pressure metal–organic vapor
phase epitaxy. A similar phenomenon has been reported
only once previously, for InAs
y
Sb
12y
grown by molecular
beam epitaxy grown at low temperature (T
g
)[28]. It has
been also demonstrated that growth temperature [16]
strongly affects the nature of the alloy. (GaAs)
12x
Ge
2x
layers have been epitaxially grown on GaAs (100) sub-
strates at different temperatures. Transmission electron
microscopy analysis revealed that at T
g
= 550°C, Ge
separated from GaAs into domains of *100 A
˚
. Single-
phase alloys are detected differently at T = 430°C.
In spite of considerable recent research in novel com-
plex materials for photovoltaics, the relationship between
chemical and optical properties of III–V–IV alloys and
similar materials is still unknown, and is a matter of current
debate. In the present paper, we investigate the chemical
nature of the bowing in (GaAs)
12x
Ge
2x
alloys. In particu-
lar, we theoretically investigated the structural and optical
properties of four different intermediate structured com-
pounds that range between ‘‘pure’’ GaAs and ‘‘pure’’ Ge
(x
Ge
= 0.25, 0.50 (two samples), 0.75).
Computational Details
We performed calculations by using density-functional
theory (DFT), within both the local-density approximation
(LDA) [29, 30] and the generalized gradient approximation
(GGA) of Perdew and Wang [31–33]. We used Blo
¨
chl’s
all-electron projector-augmented wave (PAW) method [34,
35], with PAW potentials with d electrons in the semicore
for both Ga and Ge. Cutoff energies of 287 and 581 eV
were set as the expansion and augmentation charge of the
plane wave basis. The force convergence criterion for these
models was 0.01 eV/A
˚
. The initial (GaAs)
12x
Ge
2x
models
consisting of eight atoms were optimized with a 10
3
C-centered k-points sampling scheme.
All the total energy calculations were also performed
with the generalized full-potential LMTO method of Ref.
[36]. Calculated structural properties and heats of reaction
predicted by the two methods were almost identical, indi-
cating that the results are well converged.
The thermodynamic stability of these alloys was cal-
culated as the DE products–reactants of the equation:
GaAs þ2xGe ! GaAsðÞ
1Àx
Ge
2x
þ xGaAs: ð1Þ
It is expected that LDA and GGA predict reasonable heats
of reaction of the type in Eq. 1, since reactions involve
rearrangement of atoms on a fixed (zincblende) lattice, and
there is a large cancelation of errors. Optical properties are
470 Nanoscale Res Lett (2010) 5:469–477
123
much less well described. The LDA is well known to
underestimate semiconductor bandgaps, and moreover, the
dispersion in the conduction band is poor. In Ge, the LDA
gap is negative and C
1c
is lower than L
1c
in contradiction to
experiment. Also the C-X dispersion is often strongly at
variance with experiment: in GaAs X
1c2
C
1c
is about twice
the experimental value of 0.48 eV.
When considering (GaAs)
12x
Ge
2x
alloys, any of the
three points (C, X, L) may turn out to be minimum-gap
points, so all must be accurately described. Thus, the LDA
is not a suitable vehicle for predicting optical properties of
these structures.
It is widely recognized that the GW approximation of
Hedin [37] is a much better predictor of semiconductor
optical properties. The GW approximation is a perturbation
theory around some noninteracting Hamiltonian H
0
; thus
the quality of the GW result depends on the quality of H
0
.It
is also important to mention that for reliable results, care
must be taken to use an all-electron method [38]. We adopt
here a particularly reliable all-electron method, where not
only the eigenfunctions are expanded in an augmented
wave scheme, but the screened coulomb interaction W and
the self-energy R = iGW are represented in a mixed plane
wave and molecular orbital basis [39, 40]. All core states
are treated at the Hartree–Fock level.
GW calculations in the literature usually take H
0
from
the LDA; thus, we may call this the G
LDA
W
LDA
approxi-
mation. There are many limitations to G
LDA
W
LDA
; see e.g.,
Ref. [41]. In particular, the G
LDA
W
LDA
gap for GaAs is
1.33 eV. The Quasiparticle Self-consistent GW (QSGW)
approximation, recently developed by one of us [42],
overcomes most of these limitations. Semiconductor
energy band structures are well described with uniform
reliability. Discrepancies with experimental semiconductor
bandgaps are small and highly systematic (e.g., E
QSGW
g
%
E
expt
g
þ 0:25 eV for most semiconductors [41]), and the
origin of the error can be explained in terms of ladder
diagrams missing in the random phase approximation
(RPA) to the polarizability P(r,r
0
,x)[43]. While standard
QSGW would be sufficient for this work, we can do a little
better by exploiting our knowledge of the small errors
originating from the missing vertex in P. In principle
ladder diagrams can be included explicitly via the Bethe–
Salpeter equation, but it is very challenging to do. It has
never been done in the QSGW context except in a very
approximate manner [43]. On the other hand, in sp semi-
conductors, the consequences of this vertex are well
understood. The RPA results in a systematic tendency for
the dielectric constant, e
?
, to be underestimated. The error
is very systematic: to a very good approximation e
?
is too
small by a universal factor of 0.8, for a wide range of
semiconductors and insulators [44]. This fact, and the fact
that quasiparticle excitations are predominantly controlled
by the static limit of W, provides a simple and approximate
remedy to correct this error: we scale R (more precisely
R ÀV
LDA
xc
) by 0.8. While such a postprocessing procedure
is admittedly ad hoc, the basis for it is well understood and
the scaling results in a very accurate ab initio scheme for
determining energy band structures (to within *0.1 eV
when the effect of zero-point motion on bandgaps is taken
into account) and effective masses for essentially any
semiconductor. Here, we adopt this scaling procedure to
refine our results to this precision. In any case corrections
are small, and our conclusions do not depend in any way on
this scaling. Results for GaAs and Ge are shown in
Table 1.
Results
We performed preliminary calculations at the DFT level of
GaAs and Ge; Table 2 lists the main structural optimized
parameters of the two most stable polymorphs of GaAs,
zincblende (ZB, group 216, F-43m, Z = 4) and wurtzite
(WZ, group 186, P63mc, Z = 2) and of Ge in its cubic
form (group 227, Fd-3m, Z = 8).
As seen from Table 2, the LDA generates structural
properties closer to experiment than GGA in this context.
Table 1 Left, LDA calculated bandgaps (LMTO [36], Spin–Orbit
effects included) for C, X, L points for GaAs and Ge Right, QSGW
bandgaps for the same points in Ge and GaAs (eV, 0 K), compared
with measured values at 0 K. The self-energy was scaled by a factor
0.8, as described in the text. Raw (unscaled) QSGW levels are slightly
larger than experiment
LDA BANDGAP (eV) QSGW BANDGAP (eV)
C LXC LX
QS GW Exp QS GW Exp QS GW Exp
GaAs (dir.) 0.23 0.75 1.43 1.47 1.52
a
1.73 1.80
a
1.84 1.98
a
Ge (indir) -0.22 -0.04 0.55 0.94 0.90
b
0.74 0.74
b
1.06 1.09
b
a
Inferred from ellipsometry data in Ref. [45], using the QSGW C-X dispersion in the valence band (-3.37 eV)
b
Inferred from ellipsometry data in Ref. [46], using the QSGW C-X dispersion in the valence band (-3.98 eV)
Nanoscale Res Lett (2010) 5:469–477 471
123
Thus, we use LDA to study structural properties. Both
Ga–As and Ge–Ge bond lengths are 2.43 A
˚
in their most
stable polymorph.
ZB–GaAs is constituted by interpenetrating fcc sublat-
tices of cations (Ga) and anions (As). The diamond lattice
of Ge may be thought of as the ZB structure with Ge
occupying both cation and anion sites. Here, we consider
8-atom (GaAs)
12x
Ge
2x
compounds that vary the Ge com-
position, including pure GaAs (x = 0) to x=0.25 (2 Ge
atoms), x = 0.50 (4 Ge atoms), x = 0.75 (6 Ge atoms) (see
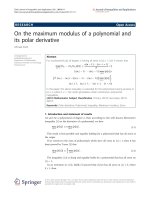
Fig. 1), and finally pure Ge (x = 1).
At first, we performed an analysis of the Ge dimer in
bulk GaAs, at site positions (1/4, 1/4,1/2) and (0,1/2,3/4).
We denote this as ‘‘alloy model I’’, the dimer in an 8-atom
GaAs cell with lattice vectors (100), (010), and (001)
before relaxation. It can be considered a highly concen-
trated molecular substitutional Ge
2
defect in GaAs, for
which we predict stability owing to the donor–acceptor
self-passivation mechanism.
1
The first layer of I consists
only of As; the second and the third layers (along [001]),
are Ge–Ga, and Ge–As, respectively. The fourth is pure
Ga. Then, the overall sequence is a repeated ‘‘sandwich-
like’’ structure, ÁÁÁ/As/Ge–Ga/Ge–As/Ga/ÁÁÁ. The bond
lengths were calculated to be 2.38 (Ga–Ge), 2.42 (Ge–Ge),
2.44 (Ga–As), and 2.47 A
˚
(Ge–As)—relatively small
variations around the calculated values in bulk Ge and
GaAs (2.43 A
˚
). This is perhaps not surprising as the elec-
tronic structure can roughly be described in terms of nearly
covalent two-center bonds [electronegativity v = 1.81,
2.01, and 2.18, for Ga, Ge, and As, respectively (http://
www.webelements.com)]. In the alloy I the number of
‘‘bad bonds’’ [7, 8], i.e., the number of III–IV and IV–V
nearest neighbors, is 12, or 37.5% of the total. According to
the Bader analysis [57–59], in the pure host, the difference
in electronegativity is responsible for charge transfer from
cation to anion. In the alloy formation process, the intro-
duction of Ge reduces the ionic character of the GaAs
bond, while increasing the ionic character of the Ge–Ge
bond. When a Ge dimer is inserted in GaAs, 0.32 electrons
are transferred away from Ge
Ga
site, while Ge
As
gains 0.21
electrons The charge deficit on Ga, is reduced from 0.6
electrons in bulk GaAs to 0.47e, while the charge excess on
As is reduced from 0.6 to 0.5e. DE for reaction Eq. (1) was
0.55 eV, and the optimized lattice parameter was
a = 5.621 A
˚
. We have also considered Ge donors (Ge
Ga
)
and acceptors (Ge
As
) in the pure 8-atom GaAs host cell,
Table 2 The energy difference (DE, per unit, eV) between ZB and WZ polymorphs of GaAs, lattice constant, a, and bulk moduli B (GPa) of
GaAs (ZB) and Ge (diamond)
GaAs (ZB) 216, F-43m, Z = 4 GaAs (WZ) 186, P63mc, Z = 2 Ge (cubic) 227, Fd-3m, Z = 8
This study, PAW/LDA
DE – ?0.06 –
B 66.14 71.8
Lattice constant (A
˚
) a = 5.605 a = 3.917, b = 3.886 c = 6.505 a = 5.612
This study, PAW/GGA
DE – ?0.03 –
B 79.01 71.0
Lattice constant (A
˚
) a = 5.739 a=4.040, c = 6.668 a = 5.747
Previous study (LDA)
DE – ?0.0120
a
B 75.7
b
, 77.1
e
73.3
c
, 79.4
c
Lattice constant (A
˚
) a = 5.654
a
, 5.53
b
5.508
e
, 5.644
k
a = 3.912, c = 6.441
a
a = 3.912, c = 6.407
b
a = 5.58
c
, 5.53
c
Previous study (GGA)
B 59.96
h
55.9
c
Lattice constant (A
˚
) a = 5.74
h
, 5.722
i
a = 3.540, c = 6.308
l
a = 5.78
c
Experimentally
DE– ?0.0117
k
B 77
f
75
d
Lattice constant (A
˚
) a = 5.649
f
, 5.65
g
a = 5.678
j
, 5.66
d
a
Ref. [47],
b
Ref. [3],
c
Ref. [48],
d
Ref. [2],
e
Ref. [49],
f
Ref. [50],
g
Ref. [51]
h
Ref. [52],
i
Ref. [53],
j
Ref. [54],
k
Ref. [55],
l
Ref. [56]
1
We preliminarily performed calculations on the stability of
substitutional Ge donor (Ge
Ga
), acceptor (Ge
As
), and Ge pairs in
GaAs. We have both compared the stability of Ge
2
molecule and 2Ge
isolated in a 64-atom supercell GaAs host. Similarly, we calculated
the stability of As
Ge
,Ga
Ge
, and GaAs
Ge2
still in a 64-atom supercell
Ge host. For sake of consistency, these calculations were performed at
the same level of theory of present calculations (PAW/LDA), with
same cutoff, reduced k-point sampling (4
3
C-centered), and force
convergence threshold which is reduced up to 0.05 eV/A
˚
.
472 Nanoscale Res Lett (2010) 5:469–477
123
separately. The formation energy has been computed
according to the Zhang–Northrup formalism [60]. In par-
ticular, we calculate DE to be 1.03 eV for Ge
Ga
and 0.84
for Ge
As
. The sum of the single contributions (1.87 eV) is
larger than the heat of formation of the dimer, structure I
(0.55 eV). Two reasons explain this difference in energy.
First, in the I model alloy, at least one correct bond III–V is
formed while in the separate Ge
Ga
(IV–V) and Ge
As
(IV–III) cases only bad bonds are formed. The isolated
Ge
Ga
is a donor; the isolated Ge
As
is an acceptor. Neither is
stable in their neutral charged state. We have tested it in a
previous analysis (see Footnote) where we calculated ?1
and -1 as the most stable charged state for Ge
Ga
and Ge
As
,
for almost the range of the electronic chemical potential,
l
e
. These two charged states are indeed formally isoelec-
tronic with the host GaAs. That the stabilization energy
1.87–0.55 = 1.33 eV is only slightly smaller than the host
GaAs bandgap establishes that the pair is stabilized by a
self-passivating donor–acceptor mechanism.
We considered two alternative structures for the
x
Ge
= 0.50 case. In the IIa structure, Ge atoms are
substituted for host atoms at (1/2, 0, 1/2), (1/2, 1/2, 0), (3/4,
3/4, 1/4), and (3/4, 1/4, 3/4); then the lattice was relaxed. It
results in a stacking ÁÁÁ/Ga–Ge/Ge–As/ÁÁÁ along\001[. The
three cubic directions are no longer symmetry-equivalent:
the optimized lattice parameters were found to be
a = 5.590 A
˚
, b = c = 5.643 A
˚
. The four intralayer bond
lengths were calculated to be Ga–Ge (2.39 A
˚
), Ge–As
(2.48 A
˚
), Ge–Ge (2.42 A
˚
), and Ga–As (2.44). Because of
the increased amount of Ge, structure IIa was less polar-
ized than I, as confirmed by the slightly more uniform bond
lengths. In IIa alloy, the number of ‘‘bad bonds’’ is 16 (i.e.,
50%) and DE rises to 0.72 eV. In the IIb structure, Ge
atoms are substituted for host atoms at (1/4, 1/4, 1/4), (1/4,
3/4, 3/4), (3/4, 3/4, 1/4), and (3/4, 1/4, 3/4). This structure
consists of a stack of pure atomic layers, ÁÁÁ/Ga/Ge/As/
GeÁÁÁ, and thus it contains only nearest neighbors of the
(Ga–Ge) and (Ge–As) type: thus all bonds are ‘‘bad bonds’’
in this IIb compound. Bond lengths were calculated to be
2.40 A
˚
and 2.49 A
˚
, respectively, and optimized lattice
parameters were a = c = 5.682, b = 5.560 A
˚
. In this
structure, DE = 1.40 eV, almost double that of IIa with
identical composition. It supports the picture [7, 8] that III–
IV and IV–V bonds are less stable than their III–V, IV–IV
counterparts.
This result confirmed findings of an analysis of the
substitutional defect Ge in GaAs (see Footnote). In that
case, we checked the stability of Ge
2
dimers (donor–
acceptor pair formation) versus isolated Ge couples (n-type
Ge ? p-type Ge) in GaAs matrix in GaAs supercells. We
calculate the energy reaction Ge
2
:GaAs ? Ge
Ga
:-
GaAs ? Ge
As
:GaAs to be positive, with DE = 0.39 eV,
and interpret this as the gain of one III–IV (Ga–Ge) and
one IV–V (Ge–As) bond and the loss of one IV–IV (Ge–
Ge) bond. (Note that the IIb structure corresponds to the
high concentration limit of isolated couples.) According to
phase transition theory, the symmetry lowering for the two
intermediate systems is the fingerprint of an ordered–dis-
ordered phase transition [61]. The calculated deviation
from the ideal cubic case (c/a = 1) is 0.94 and 2.15% for
IIa and IIb models, respectively, confirming energetic
instability for the IIb alloy.
The last model, III,[Ge]= 0.75, consists of pure Ge
except that Ga is substituted at (0, 0, 0) and As at (1/4,1/
4,1/4). The calculated bond lengths were 2.39, 2.43, 2.45,
and 2.48 A
˚
for Ga–Ge, Ge–Ge, Ga–As, and Ge–As,
respectively. Cubic symmetry is restored: the optimized
lattice parameter (a = 5.624 A
˚
) is nearly identical to
structure I. Similarly, DE is almost the same as I
(*0.54 eV). Indeed, I and III are formally the same model
with the same concentration (25%) of Ge in GaAs (I) and
GaAs in Ge (III) and the same number of bad bonds, 12.
By analogy to model I, we have also calculated the for-
mation energy of a single substituted Ge in the cell. We
have also made a preliminary calculation of the stability of
isolated Ga acceptors (Ga
Ge
) and As donors (As
Ge
) versus
that of the substitutional molecular GaAs
Ge2
in Ge pure
host (a supercell of 64 atoms see Footnote); for such
concentrations (x
GaAs
= 0.0312 = 1/32 and x
Ga(As)
=
0.0156 = 1/64), the molecular substitutional GaAs
Ge2
is
only stabilized by 0.057 eV with respect to the separate
couple acceptor–donor. This small stabilization for GaAs
Ge2
compared to isolated Ga
Ge
and As
Ge
confirms the expected
similar probability of finding a mixture of n-type and
p-type semiconductors in the ‘‘disordered’’ Ge-rich phase.
For reference states needed to balance a reaction, we used
Fig. 1 Four (GaAs)
1-x
Ge
2x
models investigated. [Ga, small gray; As,
large white; Ge, large black]
Nanoscale Res Lett (2010) 5:469–477 473
123
the most stable polymorph, of the elemental compounds
i.e., orthorhombic Ga and rhombohedral As [62]. Ga-rich
and As-rich conditions have been considered, correspond-
ing to l
Ga(As)
= l
Ga(As)
bulk
, respectively. In the case of the 8-
atom cells, the formation energy for Ga
Ge
and As
Ge
are
0.26 eV and 0.58 eV, respectively. Thus, the model III
alloy stabilizes the isolated III and V substitutionals by
0.30 eV (DE(Ga
Ge
) ? DE(As
Ge
)-DE
III
). This energy is
0.4 eV less than the host bandgap, indicating that the sta-
bilization energy is a little more complicated than a simple
self-passivating donor–acceptor mechanism, as we found
for the Ge molecule in GaAs.
Collecting DE for the different systems containing equal
numbers of Ge cations and anions, we find an almost
exactly linear relationship between DE and the number of
bad bonds, as Fig. 2 shows. This striking result confirms
that the electronic structure of these compounds is largely
described in terms of independent two-center bonds. For
stoichiometric compounds, it suggests an elementary
model Hamiltonian for the energetics of any alloy with
equal numbers of Ge cations and anions: DE = 0.54, 0.72,
1.40 eV for N = 12, 16, 32, respectively, where N is the
number of bad bonds.
Even if small variations are expected in the lattice
parameter of the alloys, the Vegard’s law:
a
GaAsðÞ1ÀxGe2x
¼xa
Ge
þ 1ÀxðÞa
GaAs
ð2Þ
where a
(GaAs)12xGe2x
, a
Ge
, a
GaAs
are the lattice parameters
of the final alloy and its components, respectively, repre-
sents a useful tool for predicting a trend in terms of lattice
parameter variation for our alloy models. We have thus
tested the predicted versus calculated values for the lattice
parameter. In particular, for models I and III, we have used
the calculated lattice parameters, a (LDA). On the other
hand, since for the reduced-symmetry models IIa and IIb
is a = b = c and a = c = b, respectively, we have
approximated the lattice parameter as the cubic root of the
volume of each of the x
Ge
= 0.5 cell models. Table 3
reports the experimental, theoretically predicted, and cal-
culated (LDA) lattice parameters, based on Vegard’s Law.
These values showed the almost perfect matching between
GaAs and Ge lattice parameter and at the same time the
marked deviation of model IIb from the trend, thus con-
firming the main contribution of ‘‘bad bonds’’ to the final
instability of the alloy.
We have performed QSGW calculations on the opti-
mized structures (I, IIa, IIb, and III) and also for the pure
GaAs and Ge 8-atom cells. Table 4 shows the QSGW
bandgaps for the C and R points. In Fig. 3, we report the
electronic structure for all the models considered (pure
GaAs, Ge, and the intermediate alloy models). In the
simple cubic supercell, R corresponds to L of the original
ZB lattice; C has both X and C points folded in. It is evident
that there is a pronounced bowing at both C and L, as also
shown in Fig. 4, where we report the QSGW bandgap as
function of Ge concentration.
Figure 5 summarizes the relationship between DFT (a,
lattice constant) and QSGW (E
G
, bandgap). From left to
right, we report the bandgap for Ge, III, IIb, IIa, I, and
pure GaAs. Once more we note the marked discontinuity
for IIb from the general trend.
We finally remark on the lack of definitive analysis of
the state of the alloy. In particular, the validity of two
viewpoints, a probabilistic growth model based on a layer-
by-layer deposition that rejects high-energy bond
Table 3 Lattice parameters: a
exp
obtained by Eq. (2) using experi-
mental lattice parameters; a
theor
calculated from Eq. (2), but with
optimized lattice parameters at the PAW/LDA level for Ge and GaAs;
a
calc
the PAW/LDA optimized lattice parameters for models I, IIa,
IIb, and III.(Italic is for values extrapolated as
3
HV.)
a
exp
a
theor
a
calc (PAW/LDA)
GaAs 5.649
a
5.605
I 5.651 5.607 5.621
IIa
5.653 5.609
5.625
IIb 5.641
III 5.655 5.610 5.624
Ge 5.660
b
5.610
a
From Ref. [51],
b
From Ref. [2]
Fig. 2 Heat of formation (DE) of the alloy models versus the number
of ‘‘bad bonds’’
Table 4 QSGW bandgaps for C and R in ordered (GaAs)
12x
Ge
2x
alloys
U R
GaAs 1.66 1.80
I(x = 0.25) 0.61 0.20
IIa (x = 0.5) 0.16
2
0.41
IIb \0 \0
III (x = 0.75) 0.23
2
0.18
Ge 1.04 0.74
474 Nanoscale Res Lett (2010) 5:469–477
123
formation (As–As, Ga–Ga) [22] and a thermodynamic
equilibrium based on an effective Hamiltonian (but which
is able to describe electronic states [63]) needs to be
assessed. In thermodynamic models [19], the Boltzmann
weight can always be realized regardless of the measure-
ment time; in probabilistic models [21, 22] further equili-
bration after the atomic deposition is not possible. It is
apparent from the results of Figs 4 and 5 that our theo-
retical alloy models, and optical properties in particular,
depend sensitively on the arrangement of atoms in the
alloy.
Conclusions
We have focused on the class of (III–V)
12x
IV
2x
alloys, as
candidate new materials with applications relevant to
photovoltaics. Previous experiments reported an asym-
metric (nonparabolic) bowing of the bandgap as a function
of the concentration of the III–V and IV constituents in the
alloy.
We have built and optimized 8-atom (GaAs)
12x
Ge
2x
ordered compounds, with x ranging from 0 to 1, as ele-
mentary models of alloys. For these systems, we have thus
employed DFT to determine structural properties and
reaction energies, and QSGW to study optical properties.
For the more diluted and more concentrated Ge models, I
and III, we have predicted stabilizing clustering effects
accompanied by a lowering of the products–reactants
excess energy. These two systems are symmetric and
additionally characterized by an almost identical lattice
parameter. In other words, the calculated excess energy of
the two intermediate models (IIa and IIb, x
Ge
= 0.5),
Fig. 3 Electronic structure for
the considered systems, GaAs
(first, left up), Ge (last, right
bottom), and the four
intermediate alloys I, IIa,
IIb, III
Fig. 4 QSGW calculated bowing of the bandgap at C and R versus
different concentration of Ge atoms
Fig. 5 From left to right: Ge ? alloys ? GaAs bandgaps calculated
at the QSGW level versus lattice constant calculated at the PAW/LDA
level (a
calc
, from Table 3)
Nanoscale Res Lett (2010) 5:469–477 475
123
clearly showed that the octet rule violation has lead to the
final instability of the alloys. In particular, the larger the
number of III–IV and IV–V bonds, the larger the instability
of the model. We detected a linear relationship between
formation energy and number of bad bonds in the alloys.
The relevance of this result stems by the fact that for
stoichiometric compounds an elementary model Hamilto-
nian for the energetics of any alloy with equal numbers of
Ge cations and anions as function of the number of bad
bonds can be developed.
Our QSGW calculations confirm the bowing of the alloy
both at the C and L points. We also detected direct rela-
tionships between optical and mechanical properties: a
diminished cohesion for the intermediate alloys (IIb is
even almost metallic), with a sensitive reduction in the
bandgap was clearly coupled with an increase in lattice
parameter and with a reduced symmetry of these two
structures. The reduction in symmetry for the intermediate
alloys is also considered the fingerprint of an ordered–
disordered phase transition for our alloy models.
Acknowledgments This research was supported by a Grant from
KAKENHI (#21245004) and the Global COE Program [Chemical
Innovation] from the Ministry of Education, Culture, Sports, Science,
and Technology of Japan.
Open Access This article is distributed under the terms of the
Creative Commons Attribution Noncommercial License which per-
mits any noncommercial use, distribution, and reproduction in any
medium, provided the original author(s) and source are credited.
References
1. C. Kittel, Introduction to Solid State Physics (Wiley, New York,
2005)
2. M. Levinstein, Handbook Series on Semiconductor Parameters
vol 1, 2 (World Scientific, London, 1999)
3. S.Q. Wang, H.Q. Ye, J. Phys.: Condens. Matter 14, 9579 (2002)
4. B.G. Streetman, S. Banerjee, Solid State electronic Devices
(Prentice Hall, New Jersey, 2000)
5. H. Holloway, Phys. Rev. B 66, 075131 (2002)
6. K.E. Newman, J.D. Dow, B. Bunker, L.L. Abels, P.M. Raccah,
S. Ugur, D.Z. Xue, A. Kobayashi, Phys. Rev. B 39, 657 (1989)
7. R. Osorio, S. Froyen, Phys. Rev. B 47, 1889 (1993)
8. A.G. Rodriguez, H. Navarro-Contreras, M.A. Vidal, Phys. Rev. B
63, 115328 (2001)
9. T. Ito, T. Ohno, Surf. Sci. 267, 87 (1992)
10. T. Ito, T. Ohno, Phys. Rev. B 47, 16336 (1993)
11. K.E. Newman, D.W. Jenkins, Superlattices and Microstruct 1,
275 (1985)
12. M.A. Bowen, A.C. Redfield, D.V. Froelich, K.E. Newman, R.E.
Allen, J.D. Dow, J. Vac. Sci. Technol. B 1(3), 747 (1983)
13. S.A. Barnett, M.A. Ray, A. Lastras, B. Kramer, J.E. Greene, P.M.
Raccah, L.L. Abels, Electron. Lett. 18, 891 (1982)
14. Zh.I. Alferov, M.Z. Zhingarev, S.G. Konnikov, I.I. Mokan, V.P.
Ulin, V.E. Umanskii, B.S. Yavich, Sov. Phys. Semicond. 16, 532
(1982)
15. A.G. Norman, J.M. Olson, J.F. Geisz, H.R. Moutinho, A. Mason,
M.M. Al-Jassim, M. Vernon, Appl. Phys. Lett. 74, 1382 (1999)
16. I. Banerjee, D.W. Chung, H. Kroemer, Appl. Phys. Lett. 46, 494
(1985)
17. A.J. Noreika, M.H. Francombe, J. Appl. Phys. 45, 3690 (1974)
18. S.H. Baker, S.C. Bayliss, S.J. Gurman, N. Elgun, J.S. Bates, E.A.
Davis, J. Phys.: Condens. Matter 5, 519 (1993)
19. K.E. Newman, J.D. Dow, Phys. Rev. B 27, 7495 (1983)
20. A.G. Rodriguez, H. Navarro-Contreras, M.A. Vidal, Appl. Phys.
Lett. 77, 2497 (2000)
21. E.A. Stern, F. Ellis, K. Kim, L. Romano, S.I. Shah, J.E. Greene,
Phys. Rev. Lett. 54, 905 (1985)
22. K. Kim, E.A. Stern, Phys. Rev. B 32, 1019 (1985)
23. L.C. Davis, H. Holloway, Phys. Rev. B 35, 2767 (1987)
24. H. Holloway, L.C. Davis, Phys. Rev. B 35, 3823 (1987)
25. H. Holloway, L.C. Davis, Phys. Rev. Lett. 53, 830 (1984)
26. M.I. D’yakonov, M.E. Raikh, Fiz. Tekh. Poluprovodn. 16, 890
(1982). Sov. Phys. Semicond. 16, 570 (1982)
27. K. Mader, A. Zunger, Phys. Rev. B 51, 10462 (1995)
28. Y. Seong, A.G. Norman, I.T. Ferguson, G.R. Booker, J. Appl.
Phys. 73, 8227 (1993)
29. J.P. Perdew, A. Zunger, Phys. Rev. B 23
, 5048 (1981)
30. D.M. Ceperley, B.I. Alder, Phys. Rev. Lett. 45, 566 (1980)
31. K. Burke, J.P. Perdew, Y. Wang (Electronic Density Functional
Theory: Recent Progress and New Directions, Plenum Press, New
York, 1998)
32. J.P. Perdew, Electronic Structure of Solids 91 (Akademie Verlag,
Berlin, 1991)
33. J.P. Perdew, J.A. Chevary, S.H. Vosko, K.A. Jackson, M.R.
Pederson, D.J. Singh, C. Fiolhais, Phys. Rev. B 46, 6671 (1992)
34. P.E. Blo
¨
chl, Phys. Rev. B 50, 17953 (1994)
35. G. Kresse, D. Joubert, Phys. Rev. B 59, 1758 (1999)
36. M. Methfessel, M. van Schilfgaarde, R. A. Casali, Electronic
Structure and Physical Properties of Solids: The Uses of the
LMTO Method, Lecture Notes in Physics 535, 114.(Springer-
Verlag Berlin 2000)
37. L. Hedin, Phys. Rev. 139, A796 (1965)
38. R. Gomez-Abal, X. Li, M. Scheffler, C. Ambrosch-Draxl, Phys.
Rev. Lett. 101, 106404 (2008)
39. T. Kotani, M. van Schilfgaarde, Solid State Commun. 121, 461 (2002)
40. T. Kotani, M. van Schilfgaarde, S.V. Faleev, Phys. Rev. B 76,
165106 (2007)
41. M. van Schilfgaarde, T. Kotani, S.V. Faleev, Phys. Rev. B 74,
245125 (2006)
42. M. van Schilfgaarde, T. Kotani, S.V. Faleev, Phys. Rev. Lett. 96,
226402 (2006)
43. M. Shishkin, M. Marsman, G. Kresse, Phys. Rev. Lett. 99,
246403 (2007)
44. A.N. Chantis, M. van Schilfgaarde, T. Kotani, Phys. Rev. Lett.
96, 086405 (2006)
45. L. Vin
˜
a, S. Logothetidis, M. Cardona, Phys. Rev. B 30, 1979 (1984)
46. P. Lautenschlager, M. Garriga, S. Logothetidis, M. Cardona,
Phys. Rev. B 35, 9174 (1987)
47. C.Y. Yeh, Z.W. Lu, S. Froyen, A. Zunger, Phys. Rev. B 46,
10086 (1992)
48. S.Q. Wang, H.Q. Ye, J. Phys.: Condens. Matter 15, L197 (2003)
49. S. Kalvoda, B. Paulus, P. Fulde, Phys. Rev. B 55, 4027 (1997)
50. K.H. Hellwege, O. Madelung, Landolt–Bo
¨
rnstein New Series
Group III (Springer, Berlin, 1982)
51. J. Singh, Physics of Semiconductors and their Heterostructures
(McGraw & Hill, New York, 1993)
52. H. Arabi, A. Pourghazi, F. Ahmadian, Z. Nourbakhsh, Phys B:
Condens Matter 373, 16 (2006)
53. A. Wronka, Mater Sci-Pol 24, 726 (2006)
54. CRC Handbook of Chemistry & Physics, (1997-1998)
55. M. Murayama, T. Nakayama, Phys. Rev. B 49, 4710 (1994)
56. A. Bautista-Hernandez, L. Perez-Arrieta, U. Pal, J. F. Rivas Silva,
Rev. Mex. Fis. 49, 9 (2003)
476 Nanoscale Res Lett (2010) 5:469–477
123
57. G. Henkelman, A. Arnaldsson, H. Jo
´
nsson, Comput. Mater. Sci.
36, 354 (2006)
58. E. Sanville, S.D. Kenny, R. Smith, G. Henkelman, J. Comp.
Chem. 28, 899 (2007)
59. W. Tang, E. Sanville, G. Henkelman, J. Phys.: Condens. Matter
21, 084204 (2009)
60. S. Zhang, J. Northrup, Phys. Rev. Lett. 67, 2339 (1991)
61. L. Landau, Zh. Eksp. Teor. Fiz. 7, 19 (1937)
62. T. Mattila, R.M. Nieminen, Phys. Rev. B 54, 16676 (1996)
63. Y. Bar-Yam, D. Kandel, E. Domany, Phys. Rev. B 41, 12869
(1990)
Nanoscale Res Lett (2010) 5:469–477 477
123