báo cáo hóa học:" Research Article Augmented Reality for Art, Design and Cultural Heritage—System Design and Evaluation" doc
Bạn đang xem bản rút gọn của tài liệu. Xem và tải ngay bản đầy đủ của tài liệu tại đây (6.21 MB, 16 trang )
Hindawi Publishing Corporation
EURASIP Journal on Image and Video Processing
Volume 2009, Article ID 716160, 16 pages
doi:10.1155/2009/716160
Research Article
Augmented Reality for Art, Design and Cultural
Heritage—System Design and Evaluation
Jurjen Caarls,
1
Pieter Jonker,
1, 2
Yolande Kolstee,
3
Joachim Rotteveel,
2
and Wim van Eck
3
1
Dynamics and Control, Department of Mechanical Engineering, Eindhoven University of Technology, P.O. Box 513,
5600 MB Eindhoven, The Netherlands
2
Bio-Robotics Lab, Faculty 3ME, Delft University of Technology, Mekelweg 2, 2628 CD Delft, The Netherlands
3
AR+RFID Lab, Royal Academy of Art, The Hague, Prinsessegracht 4, 2514 AN Den Haag, The Netherlands
Correspondence should be addressed to Jurjen Caarls,
Received 31 January 2009; Revised 24 July 2009; Accepted 16 November 2009
Recommended by Vincent Charvillat
This paper describes the design of an optical see-through head-mounted display (HMD) system for Augmented Reality (AR). Our
goals were to make virtual objects “perfectly” indistinguishable from real objects, wherever the user roams, and to find out to
which extent imperfections are hindering applications in art and design. For AR, fast and accurate measuring of head motions is
crucial. We made a head-pose tracker for the HMD that uses error-state Kalman filters to fuse data from an inertia tracker with
data from a camera that tracks visual markers. This makes on-line head-pose based rendering of dynamic virtual content possible.
We measured our system, and found that with an A4-sized marker viewed from > 20
◦
at 5 m distance with an SXGA camera (FOV
108
◦
), the RMS error in the tracker angle was < 0.5
◦
when moving the head slowly. Our Kalman filters suppressed the pose error
due to camera delay, which is proportional to the angular and linear velocities, and the dynamic misalignment was comparable to
the static misalignment. Applications of artists and designers lead to observations on the profitable use of our AR system. Their
exhibitions at world-class museums showed that AR is a powerful tool for disclosing cultural heritage.
Copyright © 2009 Jurjen Caarls et al. This is an open access article distributed under the Creative Commons Attribution License,
which permits unrestricted use, distribution, and reproduction in any medium, provided the original work is properly cited.
1. Introduction
This paper describes the design of an optical see-through
head-mounted system for Augmented Reality (AR) and its
quantitative and qualitative performance. Augmented Reality
is a technique that can be placed in the so-called mixed
reality continuum [1], with at one far end the real world
that dominates the perception (Reality) and the other end
the virtual world that dominates the perception (Virtual
Reality); see Figure 1.
In contrast with Virtual Reality (VR), where a complete
virtual world must be created, in AR usually only virtual
objects or avatars are added to the real world as the rest of
the world is the real world. In this paper we focus on mobile
immersive AR, which implies that a headset is worn in which
the real world view is augmented with virtual objects.
Since in VR only the virtual world is shown, walking with
a headset in this world is difficult because the user has little
clue in which direction he walks. In Video-See-Through AR
the user perceives the real and virtual world by looking at
displays in front of his eyes, whereas the merging of both
worlds is performed by the digital mixing of video data from
the virtual content and the real world. The real world is
perceived by two video cameras placed directly before the
displays in front of the user’s eyes. A problem in this setup
is that the real world looks pixilated, that the entire field of
view of a person must be covered by the displays, and that
the displaying of the real world usually has a delay of one or
more hundreds of milliseconds, which might cause motion
sickness when walking (for some people), since there is a
mismatch between visual information, the information from
the inner ear and the information from the muscles [2–4].
In Optical-See-Through AR the real world information
and the virtual world information is merged through optical
mixing using half-translucent prisms. The benefit of this
setup is that headsets can be made that are open, as we did
in our project. As with normal glasses that people wear, one
can also look underneath and left and right of the glasses,
2 EURASIP Journal on Image and Video Processing
Mixed
reality (MR)
Real
environment
Augmented
reality (AR)
Augmented
virtuality (AV)
Virtual
environment
Virtuality continuum (VC)
Figure 1: Mixed reality continuum.
relaxing the “scuba-diving” feeling. Since the real world is
not delayed at all and one can also look below the displays,
walking is in general no problem.
In contrast with Video-See-Through, the real world can
only be suppressed by increasing the illumination level of
the virtual objects, which is of course limited. Creating dark
virtual objects in a bright real world is hence cumbersome.
The biggest problem in AR is to exactly overlay the real
and virtual world. This problem has some analogy with color
printing, where the various inks must be exactly in overlay to
obtain full color prints. However, in AR this is a 3D problem
rather than a 2D problem and, worse, the human head can
move rapidly with respect to the real world. A first solution
was worked out in 1999 [5] after which we refined this in
later phases [6, 7]. We used one or more visual markers,
with known size, position, and distances to each other, which
can be found and tracked by a measurement camera on the
headset. In order to cope with fast head movements that the
camera cannot follow, the head pose data from the camera
was merged with data from an inertia tracker. This setup
is in analogy with the visual system-inner ear combination
of humans. In 2004 HITLab published the AR-Toolkit [8]
that used the same type of markers as well as a WebCam in
which AR on the computer screen can be displayed. Recently
it has been made fit for web-based and iPhone-3GS-based
applications.
The ultimate goal of our research, which started in 1998,
was to design an immersive, wearable light-weight AR system
that is able to provide stereoscopic views of virtual objects
exactly in overlay with the real world: a visual walkman,
equivalent to the audio walkman. Note, however, that with an
audio walkman the virtual music source (e.g., an orchestra)
turns with the user when the user turns his head. Using visual
anchor points like markers, both virtual visual and virtual
audio data can be fixed to a specific location in the real world.
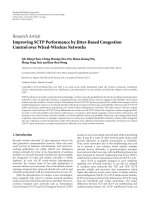
Figure 2 shows our current system that evolved during
the past decade and that we evaluated during the last three
years in real applications.
We measured its accuracy and performance in our
laboratory using an industrial robot and in order to get a
feeling how the system performs in real life, we tested it
with artists and designers in various art, design, and cultural
heritage projects in museums and at exhibitions.
The possibilities of immersive AR for applications are
plentiful. It can be fruitfully used in area development,
architecture, interior design, product design, as it may
diminish the number of mock-ups and design changes in
too late stage of the process. It can be used for maintenance
of complex machines, and possibly in future for medical
interventions. A main benefit of AR is that new designs or
Figure 2: Wearable Augmented Reality System.
repair procedures can be shown in an existing environment.
Its future possibilities in online gaming and tele-presence are
exiting. Our initial application idea was to provide a tool for
guided tours and a narrative interface for museums. Hence,
with the AR system, one must be able to easily roam through
indoor environments with a head-tracking system that is
largely independent of the environment.
Similar AR systems exist already, such as LifePLUS [9]
and Tinmith [10] but they use video-see-through methods
which makes registration easier but at the cost of loss of detail
of the world. Other projects like BARS [11] and MARS [12]
use optical-see-through methods but do not care for precise
pose tracking or do not use a camera for tracking.
In the remainder of this paper we describe the technical
setup of our system (Section 2) and its application in art,
design, and cultural heritage projects (Section 3).
2. AR System Design
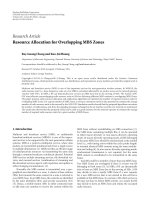
2.1. Main System Setup. Figure 3 shows the components
of the system. It consists of an optical-see-through AR
headset Visette 45SXGA from Cybermind [13], a Prosilica
CV 1280 camera [14], and an MTx inertia tracker from
XSens [15]. A backpack contains the control box for the
headset, LiPo batteries [16], and a Dell Inspiron 9400 laptop
[17] with video outputs for the left and right images, running
Ubuntu [18]. This hardware was selected to make the system
wearable and at the same time powerful enough for many
different applications. The Visette45 is the most affordable
high resolution (1280
× 1024) stereo OST HMD with an
opening angle of 36
◦
×27
◦
.
The Prosilica firewire camera was chosen for its high
resolution and the MTx is one of the most used inertia
trackers available. We chose the Dell Inspiron laptop as it
had enough processing and graphics power for our system
and has usable dual external display capabilities, which is not
common.
EURASIP Journal on Image and Video Processing 3
Laptop
Optical marker
Inertia tracker
Camera
Optical see-
through glasses
Data-glove
Virtual 3D model
Figure 3: Main components of the AR system.
Note that Figure 2 shows a prototype AR headset that,
in our project, was designed by Niels Mulder, student of the
Postgraduate Course Industrial Design of the Royal Academy
of Art with as basis the Visette 45SXGA.
Off-line virtual content is made using Cinema-4D [19];
its Open-GL output is online rendered on the laptop to
generate the left and right-eye images for the stereo headset.
The current user’s viewpoint for the rendering is taken from a
pose prediction algorithm, also online running on the laptop,
which is based on the fusion of data from the inertia tracker
and the camera, looking at one or more markers in the image.
In case more markers are used, their absolute positions in
the world are known. Note that also markers with no fixed
relation to the real world can be used. They can be used to
representmoveablevirtualobjectssuchasfurniture.
For interaction with virtual objects a 5DT data glove [20]
is used. A data-glove with RFID reader (not shown here)
was made to make it possible to change/manipulate virtual
objects when a tagged real object is touched.
2.2. Head Pose Tracking. The Xsens MTx inertia tracker
[15] contains three solid state accelerometers to measure
acceleration in three orthogonal directions, three solid
state gyroscopes to measure the angular velocity in three
orthogonal directions, and three magnetic field sensors
(magnetometers) that sense the earth’s magnetic field in
three orthogonal directions. The combination of magne-
tometers and accelerometers can be used to determine the
absolute 3D orientation with respect to the earth. The inertia
tracker makes it possible to follow changes in position and
orientation with an update rate of 100 Hz. However, due
to inaccuracies in the sensors, as we integrate the angular
velocities to obtain angle changes and double integrate
accelerations to obtain position changes, they can only track
reliably for a short period. The error will grow above 10 to
100 meter within a minute. This largest error is due to errors
in the orientation that leads to an incorrect correction for
124 816
32 64 128 256 512
1024 2048 4096 8192 16384
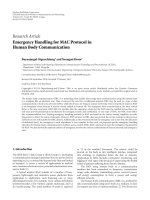
Figure 4: A marker; ID=4+1024+16384=17412.
the earth’s gravitational pull. This should be corrected by
the partial, absolute measurements of the magnetometers, as
over short distances the earth’s magnetic field is continuous;
but this field is very weak and can be distorted by metallic
objects nearby. Therefore, although the magnetic field can
be used to help “anchoring” the orientation to the real
world, the systematic error can be large depending on the
environment. We measured deviations of 50
◦
near office
tables. Hence, in addition to the magnetometers, other
positioning systems with lower drift are necessary to correct
the accumulating errors of the inertia tracker.
A useful technique for this is to use visual information
acquired by video cameras. Visual markers are cheap to
construct and easily mounted (and relocated) on walls,
doors, and other objects. A marker has a set of easy detectable
features such as corners or edges that enable recognition
of the marker and provide positional information. Many
different marker types exist, circular [21]orbarcodelike
[22]. We chose a marker with a rectangular border to be
able to easily detect and localize the marker and chose a 2D
barcode as its identity is detectable even when the marker is
very small (Figure 4).
If the marker is unique, then the detection of the marker
itself restricts the possible camera positions already. From
four coplanar points, the full 6D pose can be calculated with
respect to the marker with an accuracy that depends on
the distance to the marker and on the distance between the
points. In case more markers are seen at the same time, and
their geometric relation is known, our pose estimation will
use all available detected points in a more precise estimation.
In a demo situation with multiple markers, the marker
positions are usually measured by hand.
Tracking is not restricted to markers, also pictures,
doorposts, lamps, or all that is visible could be used.
However, finding and tracking natural features, for example,
using SIFT [23, 24], GLOH [25], or SURF [26]comesata
cost of high process times (up to seconds as we use images
of 1280
× 1024), which is undesirable in AR due to the
possibility of a human to turn his head very quickly. To give
an impression: in case of a visual event in the peripheral area
of the human retina, after a reaction time of about 130 ms in
which the eye makes a saccade to that periphery, the head
starts to rotate accelerating with 3000
◦
/s
2
to a rotational
speed of 150
◦
/s to get the object of interest in the fovea. When
the eye is tracking a slow moving object (smooth pursuit) the
head rotates with about 30
◦
/s[27, 28].
4 EURASIP Journal on Image and Video Processing
Moreover, sets of natural features have to be found that
later enable recognition from various positions and under
various lighting conditions to provide position information.
The biggest issue with natural features is that their 3D posi-
tion is not known in advance and should be estimated using,
for instance, known markers or odometry (Simultaneous
Localization And Mapping [29, 30]). Hence, we think that
accurate marker localization will remain crucial for a while
in mobile immersive AR.
2.3. Required Pose Accuracy. The question rises what should
be the accuracy of a tracking system if we want to have
adequate alignment of virtual and real objects. For an eye
with a visual acuity of about 0.01
◦
, looking through a head-
mounted display at 10 cm distance with an opening angle of
36
◦
×27
◦
, we actually need a resolution of about 3000×2000
pixels. As our HMD has 1280
× 1024 pixels the maximum
accuracy we can obtain is one pixel of our display, which
translates to roughly 0.03
◦
or 0.5 mm at 1 meter distance
of the eye. Hence, currently an AR user at rest will always
perceive static misalignment due to the limitations of the
HMD. Dynamically, we can present virtual objects on our
HMD at a rate of 60 Hz. Assuming instantaneous head
pose information from the pose measuring system, and
assuming head movements in smooth pursuit we obtain a
misalignment lag of 1/60
∗ 30
◦
/s = 0.5
◦
. If we assume
head motions as reaction on attention drawing, we obtain
a temporary misalignment lag due to head movements of
1/60
∗150
◦
/s = 2.5
◦
. Consequently, with the current headset
technology the user will inevitably notice both static and
dynamic misalignment due to head motion. Reasoning the
other way around, the extra dynamic misalignment due to
the current headset cannot be noticed (less than the static
misalignment) if we rotate our head with less than 0.03
∗
60 = 1.8
◦
/s. Concluding, the target accuracies for our pose
measurement system are based on the accuracies for the pose
of virtual objects that can be realized by the current HMD
and we can distinguish three scenarios.
(i) A static misalignment of <0.03
◦
, that is, a position
misalignment of <0.05 cm of a virtual object at 1 m.
(ii) A dynamic misalignment of <0.5
◦
when smoothly
pursuing an object, that is, a temporal position error
of < 0.9cmofavirtualobjectat1m.
(iii) A dynamic misalignment of <2.5
◦
when another
event in the image draws the attention and the head
rotates quickly, that is, a position error of <4.3 cm of
virtual object at 1m.
These are theoretical values. Given the flexible and versatile
human vision system users might not find these errors
disturbing. We address this in Section 3.
2.4. Camera-Only Tracking. Below we describe our methods
to calculate the pose of a camera from an image of a known
marker. Our aim was to use as few markers as possible,
ultimately a single marker seen from quite a distance. Hence,
we also use a lens with a very large opening angle of 108
◦
.
We investigated the influence of image noise and parameters
such as line thickness and marker size on the accuracy of
the estimated pose. We used a rectangular pattern with a big
black border on a white field with inside a 2D barcode to
identify the individual markers [7, 8] (see Figure 4). Figure 5
shows the real-time image processing steps that we use to
track the pose of the camera with respect to a marker.
To minimize latency we need fast methods. Therefore, we
first detect candidate markers (single closed contours) using
a Canny edge detector, with a fixed threshold on the gradient
to suppress noise from the imaging system. While following
the edges in the Canny algorithm we keep track of connected
edge points and count the number of points that are not part
of a line (end-points, T crossings, etc.). Only contours with
no special points (single closed contour) are interesting.
Then we search for corners only along these contours and
keep contours with four corners. The corners are found by
using a modified Haralick-Shapiro corner detector [31, 32].
As the gradients are high on the edge, we only need a
threshold on their circularity measure and search for local
maxima of that measure along the edge. After splitting the
contour in the four segments, we find the accurate location
of the edge points, correct for lens distortions, and fit a
line through each segment. The intersections of the lines
give an unbiased location of the four corners needed for
pose estimation. Other corner detectors as [31–33] did not
perform well as they need either a large patch around the
corner (impairs speed and makes them less robust against
nearby other edges) or have a bias in their estimate. To reach
our unbiased estimate we had to correct the location of the
edge points for lens distortion prior to fitting the lines.
Accurate edge-point locations are crucial to find accurate
corner points; hence, we must eliminate systematic errors
and noise as well as possible [34, 35]. Using the step-edge
model (Gaussian blurred edge)
I
x, y
=
b + a ·
1
2
+
1
2
erf
x −x
edge
√
2σ
edge
(1)
we can calculate the edge location accurately from three
pixels centered on and perpendicular to the edge. To
increase processing speed we evaluate three pixels along the
horizontal or vertical direction, depending on which one is
most perpendicular to the edge.
Where usually the gradient magnitudes are used to find
the location as the top of a parabola, we use the logarithm
of the gradients. This makes sure that the parabolic profile
assumption is valid for sharp images as well, and an unbiased
estimate for the edge location of our model edge is obtained.
In an experiment with a linearly moving edge the bias in
location was measured to be up to 0.03 px without the
logarithm, and 0.01 px with the logarithm.
We first investigated the influence of the thickness of the
black border on our step-edge locator. We found that when
the black border is thicker than 8 pixels in the image, the
edge points on the outer contour of the border can be located
with practically zero bias and an RMS error <0.01 pixel using
integer Gaussian derivative operators with a scale of 1.0 px.
We use integer approximations of the Gaussians because of
EURASIP Journal on Image and Video Processing 5
Grab an image Detect edges
Select closed
contours
Detect corners
Keep contours
with 4 corners
Split contour in
4segments
Locate edges
correct distortions
Fit a line through
each segment
Intersect 4 lines
for corners
Calculate pose
of marker
Determine the
ID
Calculate pose
of camera
Figure 5: Image processing of the markers.
their fast implementations using SIMD instructions. Using
simpler derivatives, this bias will stay low even at a thickness
of 3–5 pixels; however, this error is then symmetrically
dependent on the subpixel location of the edge. If a large
number of points are used for fitting a line through the edge-
points—usually 12–30 points are used—the bias error can be
regarded as a zero mean noise source, but for short edges the
fit will have an offset. We tried several edge detectors/locators
and in the presence of noise, the most accurate and robust
detector was using an integer Gaussian derivative filter with
the three gradient magnitude values to calculate the edge
position not from neighboring pixels but from pixels at a
distance of two pixels, provided that the line thickness was
big enough.
We used this detector but with three neighboring pixels
as we expect line thicknesses of near five pixels (markers at a
few meters distance). The detector to use in other situations
should be chosen on basis of the expected line thickness and
noise, for example, marker distance, marker viewing angle,
and illumination (indoor/outdoor) circumstances.
We then determined the size of the marker pattern that is
needed when it should be detected at 5 m distance under an
angle of 45
◦
. With a 5-pixel line thickness and leaving 2 × 2
pixels for the black and white blocks, the minimum size of
amarkeris18.2
× 25 cm, fitting on A4. The bias per edge
location will then be between 0.01 and 0.04 pixels, depending
on the scale of the edge. When the camera is not moving,
the scale is 0.8 pixels corresponding to a bias of 0.01 pixels.
Because the edge location has only a small bias, the error of
our algorithm is noise limited, and in the absence of noise, it
is model limited.
We then verified our step-edge model and found that it
fits well to experimental data. We still found a bias of around
0.004 pixel and an RMS error around 0.004 pixel as well. This
bias we attribute to the small error we still make in assuming
a Gaussian point spread function of the imaging system.
When the Contrast to Noise Ratio—CNR
= 2a/σ
noise
—is
around 26 dB, the standard deviation of the edge location is
0.1 pixel. This is also the residual error of the saddle points
after a lens calibration.
When the CNR is higher, the biggest source of error in
our experimental setup seems to be the (model of the) lens.
In order to be able to use a pinhole camera model, we tried
to calibrate all distortions away, but even with an elaborate
lens distortion model we obtained a residual calibration error
of 0.37 pixel maximum (standard deviation 0.1 pixel). We
found an increased blurring at the borders of the image,
suggesting lens artifacts. In photography, these artifacts are
minimized using more elaborate lens systems. More research
is needed to investigate how to further reduce this systematic
error, with a better lens (model) as a starting point. Our lens
distortion model is given by
−→
p
D
=
1
1+k
1
r
u
2
+ k
2
r
u
4
+ k
3
r
u
6
−→
p
U
= c ·
−→
p
U
,(2)
with r
u
=
−→
p
U
; D and U denote distorted/undistorted
metric sensor plane coordinates. This model performs better
in our case than the other models we tried [36–39]. The
parameters were estimated using the Zhang calibration
method [38].
We found that we can detect the contours of a marker
robustly down to a CNR of 20 dB and now we only need to
worry about the detection of the four corners along these
contours. The Haralick-Shapiro corner detector [31, 32]is
the least sensitive to noise while it performs well along the
Canny edge, and we found it can be used with CNR ratios
higher than 20 dB. Along the edge we can reliably detect
corners with an angle of less than 120
◦
. When the CNR is
25 dB, corners can be detected up to 150
◦
. Corner angles of
120
◦
and 150
◦
relate to marker pitch angles of 35
◦
and 65
◦
,
respectively. To realize our target of detecting the marker up
to pitch angles of 60
◦
, we need the CNR to be around 25 dB.
For online estimation of the pose from four corners
we used a variation of the Zhang calibration algorithm;
only the external parameters need to be estimated. Using
static measurements to determine the accuracy of our pose
estimation algorithm we determined that the position of
a marker in camera coordinates is very accurate when the
marker is on the optical axis at 5 m, that is, less than 0.5 mm
in x and y, and less than 1 cm along the optical axis. The
marker orientation accuracy, however, highly depends on
that orientation. The angular error is less than 5.2
◦
(1.5
◦
due to noise) when the marker pitch is less than 20
◦
at 5 m.
When we convert the marker pose in camera coordinates
to the camera pose in marker coordinates, the stochastic
orientation error results in an error in position of 2.7 cm/m.
With a pitch larger than 20
◦
, the orientation accuracy is
much better, that is, less than 1.4
◦
(0.5
◦
due to noise),
resulting in a stochastic positional error of the camera of
less than 0.9 cm/m. Hence, markers can best be viewed not
frontally but under a camera pitch of at least 20
◦
.
6 EURASIP Journal on Image and Video Processing
Inertia
measurements
Camera
measurements
Fusion steps
Rendering
1
2
Figure 6: Fusion of data from camera and inertia tracker.
Finally, with this data, we can determine the range where
virtual objects should be projected around a marker to
achieve the required precision for our AR system. We found
that with one marker of size 13
× 16.5cm (at 1.5m–6m
from the camera), a virtual object should not be projected
at more than 60 cm from that marker in the depth direction,
or within 1 m from that marker in the lateral direction to
achieve the target accuracy of 0.5
◦
error in the perceived
virtual object position.
2.5. Camera Data Fused with Inertia Data. We need fast
inertia data to keep up with fast head movements. However,
cheap solid-state inertia trackers build up severe pose errors
within a second. Consequently, these pose measurements
should be corrected using the much slower but more stable
camera pose data that is acquired by locking onto features
of markers in the real world. We used an inertia tracker
fixed onto a camera. Our sensor fusing Kalman filter [40, 41]
combines the absolute pose estimate from the camera with
acceleration sensors, angular velocity sensors and magnetic
sensors to get a better estimate of the HMD pose. The
Kalman filter is also necessary to interpolate the pose in-
between the slow pose estimates from the camera. Figure 6
shows the problem we encounter when we fuse pose data
from the camera with pose data from the inertia tracker. The
inertia pose data has a frequency of 100 Hz. The camera with
image processing has an update rate of about 15 Hz. Note
that the online viewpoint-based rendering costs also time.
The Kalman filter with inertia tracker data can be used to
predict the head pose at the precise moment we display the
virtual objects precisely aligned on the headset.
From now on, we refer to the pose of the camera with
respect to a marker at a certain point in time as its state. This
state does not only include the position and orientation of
the camera at that point in time, but also its velocity and
angular velocity, and where necessary their derivatives. The
error state is the estimation of the error that we make with
respect to the true state of the camera.
Our fusion method takes latencies explicitly into account
to obtain the most accurate estimate; other work assumes
synchronized sensors [42, 43] or incorporates measurements
only when they arrive [44] ignoring the ordering according
to the time of measurement.
Our filter is event based, which means that we incor-
porate measurements when they arrive, but measurements
might be incorporated multiple times as explained next.
We synchronize the camera data with the filter by rolling
back the state updates to the point in time at which the
camera has acquired its image. We then perform the state
update using the camera pose data and use stored subsequent
inertia data again to obtain a better estimate of the head pose
for the current point in time, and to predict a point of time in
the near future, as we need to predict the pose of the moving
head at the moment in time that the image of the virtual
objects are projected onto the LCD displays of the headset.
In this way, we not only get a better estimate for the current
time, but also for all estimates after the time of measurement;
this was crucial in our case as camera pose calculations could
have a delay of up to 80 ms, which translates to 8 inertia
measurements.
A Kalman filter can only contribute to a limited extend
to the total accuracy of the pose estimates. The estimate
can only be made more accurate when the filter model
is accurate enough; that is, that the acceleration/angular
speed is predictable, and that the inertia sensors are accurate
enough. A bias in the sensors—for instance caused by a
systematic estimation error or an unknown delay in the
time of measurement—will prevent the filter from giving a
more accurate result than the camera alone. We minimized
the errors introduced by the Kalman filter by using robust
methods to represent the orientation and time update of
the orientation, and decreased the nonlinearity be using a
nonadditive error state Kalman filter in which the error state
is combined with the real state using a nonlinear function
(see the transfer of the orientation error in Figure 8). We used
Quaternions [45] for a stable differentiable representation.
To make the orientation model more linear, we used an
indirect Kalman filter setup where the error states are
estimated instead of the actual state. Due to this choice the
error-state update is independent of the real state. Effectively
we created an extended kalman Filter for the error state. If
the error state is kept at zero rotation by transferring the
error-state estimate to the real state estimate immediately
after each measurement update, the linearization process for
the Extended Kalman Filter [46] becomes very simple and
accurate. In addition, we convert all orientation measure-
ments to error-quaternions:
q
e,k
= q
−1
k
|k−1
⊗ q
m,k
.Thismakes
the measurement model linear (the state is also an error-
quaternion) and stable in case of large errors, at the expense
of a nonlinear calculation of the measurement and its noise.
In simulations we found that the position sensor accu-
racy has the largest influence on the total filter accuracy in
absence of orientation errors. Changing the sampling rates
or using more accurate acceleration measurements had less
influence. We can argue that when the process noise in
acceleration (or angular velocity for that matter) due to the
user’s motion is high compared to the measurement noise of
the inertia sensors, it is of little use to filter the inertia sensor
measurements, meaning that a computationally cheaper
model can be used in which the inertia sensors are treated
as an input during the time update.
Figure 7 shows the process models of the two Kalman fil-
ters as we implemented them. The orientation-error Kalman
filter at the top estimates errors in orientation and errors
in gyroscope bias. The position-error filter estimates errors
in position, speed, and accelerometer bias. When gyroscope
and accelerometer data is received—they are transmitted
simultaneously by the inertia tracker—all real states are
EURASIP Journal on Image and Video Processing 7
x = (dp, dv, db)
T
Application
σ
da
x
k+1
= 0 P
k+1
= ΦP
k
Φ
T
+ Γσ
2
z,a
Γ
T
+ Q
db
+ Q
da
x
k−1
, P
k−1
Q
da
=
⎛
⎜
⎜
⎜
⎜
⎜
⎝
1
3
I
3×3
Δt
3
1
2
I
3×3
Δt
2
0
1
2
IΔt
2
IΔt 0
0
3×3
00
⎞
⎟
⎟
⎟
⎟
⎟
⎠
σ
2
da
Q
db
=
⎛
⎜
⎜
⎜
⎜
⎜
⎜
⎝
1
20
I
3×3
Δt
5
1
8
IΔt
4
1
6
IΔt
3
1
8
IΔt
4
1
3
IΔt
3
1
2
IΔt
2
1
6
IΔt
3
1
2
IΔt
2
IΔt
⎞
⎟
⎟
⎟
⎟
⎟
⎟
⎠
σ
2
db,a
x
−
k
, P
−
k
σ
db,a
σ
z,a
Φ =
⎛
⎜
⎜
⎝
II.Δt
1
2
R
k
·Δt
2
0I R
k
·Δt
00 I
⎞
⎟
⎟
⎠
Γ =
⎛
⎜
⎜
⎝
1
2
R
k
·Δt
2
R
k
·Δt
0
⎞
⎟
⎟
⎠
Process model x ≡ 0
z
a
b
a,k−1
p
k−1
, v
k−1
+
−
a
x
= (dq db)
T
Application
−→
p
k
=
−→
p
k−1
+
1
2
(
−→
v
k−1
+
−→
v
k
)Δt
−→
v
k
=
−→
v
k−1
+(R
k
−→
a
k
−
−→
g )Δt
−→
b
a,k
=
−→
b
a,k−1
p
k
, v
k
, b
a,k
q
k−1
b
g,k−1
z
ω
+
−
ω
q
k
= q
k−1
⊗q
ω
b
g,k
= b
g,k−1
q
k
, b
g,k
R
R
k
x
k+1
= 0 P
k+1
= ΦP
k
Φ
T
+ Γσ
2
z,ω
Γ
T
+ Q
dω
+ Q
db
σ
db,ω
σ
z,ω
x
k−1
, P
k−1
Q
dw
=
⎛
⎜
⎜
⎝
σ
2
q0
Δt 00
0
1
4
σ
2
dw
I
3×3
Δt 0
000
⎞
⎟
⎟
⎠
Q
db
=
⎛
⎜
⎜
⎜
⎜
⎜
⎝
00 0
0
1
12
I
3×3
Δt
3
1
4
I
3×3
Δt
2
0
1
4
I
3×3
Δt
2
I
3×3
Δt
⎞
⎟
⎟
⎟
⎟
⎟
⎠
σ
2
db,ω
Φ =
⎛
⎜
⎝
∂f
∂dq
∂f
∂db
0
4×3
I
3×3
⎞
⎟
⎠
Γ =
⎛
⎝
∂f
∂dv
0
3×3
⎞
⎠
ω = ω
g
−
b
g
q
y
=
cos
1
2
yΔt
sin
1
2
yΔt
y
y
T
f (dq, ω, db, v) = q
∗
ω
⊗dq ⊗q
ω+db+v
x ≡ 0
x
−
k
, P
−
k
Process model
Accelerometers
σ
q0
, σ
dω
Gyroscopes
Figure 7: The prediction steps of the two implemented error-state Kalman filters and separately maintained position and orientation states
when gyroscope and accelerometer data is processed.
updated. In addition, both filters perform a prediction step
using their respective process models. In our current setup,
we immediately transfer predicted errors to the real states, so
the error states will always be zero—or more precisely, they
indicate zero error. With zero error input, the output of the
prediction step will also be zero. However, the uncertainty
of this zero error will increase due the noisy measurements
and the expected change in the acceleration and angular
velocity. These expected changes should be provided by
the application. In our demos we did not make special
assumptions for the motions and used the same process noise
values for all axes. For the position-error filter we could
find a full solution for the process noise due to acceleration
change and bias change. We could also find a full solution
for the orientation-error filter’s process noise. The resulting
equation, however, was not practical for implementation.
We further assumed the angular velocity to be zero and
used the result presented in the figure. The process noise
values can be increased a bit to account for the error in this
extra assumption, but in practice these values are determined
experimentally already.
Figure 8 shows how position and orientation measure-
ments are incorporated in the observation update steps. The
camera measurements have a delay and in order to calculate
8 EURASIP Journal on Image and Video Processing
Camera
position
Camera
/MTx
orientation
θ
t
, σ
θ
q
t
, σ
q
p
t
, σ
p
Quat
Order
measurement
in time
Roll back
all to
closest t
n
<t
Reuse all
measurements
t
i
= [t
n
, t
k
]
Process model
advance to i +1Gyro/accel.
i: position: p
t
, σ
p
i:orientation:q
t
, σ
q
Position
observation
x
= (dp,dv, db)
T
x = (dp, db)
T
z = p
t
− p
−
i
+ N(0, σ
p
)
x
+
= x
−
+ K(z − x
−
dp
)
x
−
≡ 0
x
++
≡ 0
x
−
≡ 0
x
++
≡ 0
x
+
i
x
+
i
x
++
i
, P
+
i
x
−
i
, P
−
i
x
++
i
, P
+
i
Transfer error
+
p
−
i
, v
−
i
, b
−
a,i
p
+
i
, v
+
i
, b
+
a,i
q
+
i
, b
+
g,i
q
−
i
, b
−
g,i
b
+
g,i
= b
−
g,i
+ db
+
i
q
+
i
= q
−
i
⊗dq
+
i
x
−
i
, P
−
i
Orientation
observation
z
= q
t
⊗
q
i
+ N(0, σ
q
)
−1
x
+
= x
−
+ K(z − x
−
dq
)
Figure 8: The measurement update step of the two implemented error-state Kalman filters. Received measurements are ordered in time, both
filters and states are rolled back to the time of measurement t, and all measurements since then are reprocessed. Position and orientation
measurements are used to estimate the current error states. The error states are immediately transferred to the real states.
the best estimate, we reorder all measurements by their
measurement time. Therefore, when a camera measurement
is received, both error-state filters and the states themselves
are rolled back synchronously to the closest state n to the
time t, the capture time of the image for the camera pose
measurement. All measurements taken after time t
n
will now
be processed again, ordered in time. This reprocessing starts
at state i
= n. Gyroscope and accelerometer measurements
are again processed using the process models, and they
will advance the state i
→ i + 1. Position and orientation
measurements will be used to update the a priori estimates
at state i to a posteriori estimates in the observation update
steps of the Kalman filters. First, these measurements need
to be transformed into error observations. We do this using
the nonlinear transformations, and thereby circumvent the
linearization step of the measurement model for better
accuracy. Then, these error measurements are incorporated
using the standard Kalman observation update equations.
The resulting estimates of the errors are transferred to the
separately maintained states of position, orientation, bias
and so forth. Hence, all pose estimates up to the present time
will benefit from this update.
2.6. AR System Accuracies. Finally, we measured our com-
plete tracking system: camera, inertia tracker and Kalman
filter, using an industrial robot as controllable motion source
and a marker at 3.2 m. The robot motions are shown in
Figure 9. The positional accuracy of the system is shown
in Figure 10. The values along the x-axis were the most
inaccurate. Without the filter to correct for the slow and
delayed camera measurements, the positional error would
be up to 20 cm depending on the speed of the robot
(Figure 10(a)). With the filter, the accuracy is generally just
as good as the accuracy of the camera measurements.
The camera pose shows a position dependent systematic
error of up to 3 cm (Figure 10(b)). This proved to be due
to a systematic error in the calculated orientation from the
camera. When we correct for the orientation error, the posi-
tional error becomes less than 1 cm (Figure 10(c)). However,
in normal situations the ground truth orientation will not
be available. Using the orientation from the inertia tracker
did not help in our experiments; the high accelerations are
misinterpreted as orientation offsets, which introduces a
systematic error in its output.
From our experiments we conclude that our data fusion
does its task of interpolating the position in between camera
measurements very well.
The tracking system has an update rate of 100 Hz.
However, the pose estimates—albeit at 100 Hz—were less
accurate than the estimates from the camera because of the
high process noise (unknown jerk and angular acceleration
from user movements).
We measured that the required orientation accuracy
of <0.5
◦
when moving slowly can be met only when the
encountered systematic error in camera pose estimation is
ignored: 1 cm at 3 m translates to 0.2
◦
. Since the camera is
the only absolute position sensor, the encountered error of
up to 4 cm (0.9
◦
) cannot be corrected by inertia tracker data.
Ways to diminish this static error are the following.
(i) View markers under an angle >20
◦
. Viewing a marker
straight on can introduce static pose errors in the
range of 1
◦
. Markers should be placed such that
the camera observes them mostly under an angle of
greater than 20
◦
.
EURASIP Journal on Image and Video Processing 9
−550 0 550
x (mm)
0
550
y (mm)
Start/stop; 0 cm/s
7 half-circles back and forth
radius 55 cm
32–224 cm/s, accel. time 0.5s
(a)
−200 −100 0 100 200
x (mm)
300
400
500
y (mm)
Return; 40 cm/s
20 cm/s Start
Acceleration/deceleration time: 0.5s
Two ellipses
linear velocity 20 cm/s
x range 23.6cm
y range 20.2cm
z range 12.3cm
(b)
Figure 9: Motions of the SCARA robot in experiments 3 (a) and 4 (b). The pattern is located at x = 0.2m, y = 3.2m
100 120 140 160
180
Time (s)
−15
−10
−5
0
5
10
15
20
p
x,err
(cm)
Uncorrected camera measurements
(all markers)
no filter
34
(a)
100 120 140 160 180
Time (s)
−4
−2
0
2
4
6
p
x,err
(cm)
Uncorrected position measurements
(one marker)
σ
z,p
= 5 σ
z,a
= 2 σ
da
= 0.5 σ
db,a
= 0.2
(b)
100 120 140 160 180
Time (s)
−1.2
−0.8
−0.4
0
0.4
0.8
p
x,err
(cm)
Corrected position measurements
(one marker)
σ
z,p
= 0.8 σ
z,a
= 2 σ
da
= 0.5 σ
db,a
= 0.2
To 5 c m
(c)
Figure 10: Accuracies of the tracking system. (a): No filter, first order hold on pose estimate from the camera pose algorithm. (b), (c): The
plusses show the camera poses and the dots show the Kalman output. (c): error when the ground truth orientation is used within the camera
pose algorithm.
(ii) Use multiple markers, spread out over the image; this
will average the pose errors.
(iii) Find ways to calibrate the lens better, especially at the
corners.
(iv) Use a better lens with less distortion.
A systematic static angular error leads to the fact that an
acceleration measured by the inertia tracker is wrongly
corrected. This is also visible in static situations due to the
acceleration due to gravity. For example with a 1
◦
error, the
Kalman filter will first output an acceleration of sin(1
◦
) ∗
9.81 = 17 cm/s
2
, which is slowly adjusted by the filter since
the camera indicates that there is no acceleration. When the
camera faces the marker again with a zero error, the wrongly
estimated accelerometer bias now generates the same error
but then in the other direction and hence this forms jitter
on the pose of the virtual object. We found that the bias
of the accelerometer itself is very stable. When the process
noise for this bias is set very small, the bias will not suffer
much from this systematic error. To counter a systematic
orientation error it seems more appropriate to estimate a
bias in the orientation. However, when the user rotates, other
markers will come into view at another location in the image,
with another bias. The real effective solution is to minimize
camera orientation errors. However, knowing that systematic
errors occur we can adapt our demos such that these errors
are not disturbing, by letting virtual objects fly for instance.
Of all errors, jitter is the most worrying. This jitter is due
to noise in the camera image in bad illumination conditions
and due to the wrong correction of the earth gravitational
field. Note that the first jitter also occurs in, for example,
ARToolkit. Jitter in virtual objects makes that it draws the
attention of the user, as the human eye cannot suppress
saccades to moving objects.
10 EURASIP Journal on Image and Video Processing
Figure 11: Forming sentences of dancing letters.
Finally, to make a working optical-see-through AR sys-
tem, many extra calibrations are needed, such as the poses of
the sensors, displays, and the user’s eyes, all of them crucial
for accurate results. Most of these calibrations were done by
hand, verifying a correct overlay of the virtual world with the
real world.
3. Application in Art, Design, and
Cultural Heritage
In order to obtain insight in how the AR system performs
also in qualitative sense, we tested it with artists and designers
in various art, design, and cultural heritage projects. The
application of artists and designers and curators is of course
in no way a replacement for a full user study, but it did
lead to some useful observations for the profitable use of
the system. For this, within the context of the projects
Visualization techniques for Art and Design (2006-2007) and
Interactive Visualization techniques for Art and Design (2007–
2009) the Royal Academy of Art (KABK), the Delft University
of Technology (TUD), and various SME founded an AR lab
[47] in which two prototype AR systems had been developed
and tested. The aim of the first project was to research
the applicability of AR technique in art and design and to
disseminate the technology to the creative industry. The aim
of the second project was to combine AR with interaction
tools and disseminate the technology to public institutes like
museums. The basic idea behind this cooperative projects
was that AR technology is new; hence designing with it has
no precedent and most probably needs a new approach. Like
the first iron bridge (1781); being the first of its kind and
therefore its design was based on carpentry, for example,
using dovetails [48].
A number of projects have been realized within the
context of the ARlab, some of which are recalled below.
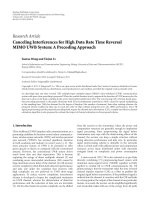
30/1/2007 Augmented Letter Soup. The 325th anniversary
of the typography design institute of the KABK leads to a
project where AR was used to combine typography with
interior and interaction design. Wearing the AR headset,
users can experience a virtual, typographic interior placed
in a real, physical environment and write text in augmented
space using 3D, animated letters attached to tangible optical
markers; see Figure 11.
By juxtaposing the markers, representing letters of the
alphabet, the visitors could write their own name or a short
Figure 12: Interaction using a data-glove.
sentence of tumbling and jumping letters in 3D space. The
rest of the audience, not wearing any AR device, could
follow the augmented view of the headset users beamed on
a projection screen. The following are the Lessons learned:
(i) positioning virtual objects in the air covers up for
static misalignment;
(ii) motion of the virtual objects covers up for jitter; the
human attention is already drawn and the jitter is less
noticed.Thesameistrueifthehumanmoves;
(iii) virtual objects are not bound to the floor, ceiling,
walls, or tables; they only need to be within some
distance to their nearest marker(s). This means that
also information display and interaction does not
necessarily have to take place on a wall or table, but
might also take place in the air;
(iv) the image of the tracker camera can also be used to
beam the augmented view of the user on a screen, by
which a broad audience can see (almost) through the
user’s eye.
10–15/4/2007. Augmented Reality Theater. It was an interac-
tive installation at the unDEAF/DEAF festival with virtual 3D
animated puppets in AR, data gloves, and physical objects
tagged with RFID. Using a data-glove the user could control
the position and face expression of an animated virtual
puppet. In various physical objects an RFID tag was hidden,
which was used to trigger changes in the behavior and
looks of the puppet, Figure 12. The following are the Lessons
learned:
(i) using design packages such as Cinema 4D enlarges
the possibilities of the interaction designers; making
interaction with animated figures possible;
(ii) for real 3D animated films with large plots, game
engines must be used;
(iii) manipulation of real objects that influence (through
RFID) the virtual world is “magic” for many people;
(iv) more image processing on the tracker camera is
useful, for example, to segment the user’s hand and
fingers making unhandy data gloves superfluous.
21-22/9/2007. Out of the Blue. It was an audio-visual AR
environment made of ellipsoid shapes coming out of and
moving into the walls and float in 3D through the exhibition
EURASIP Journal on Image and Video Processing 11
Figure 13: Inverted AR experience.
Figure 14: Queuing for the AR experience.
space. One sees and hears the objects flying through the
3D space. As the walls, floor, and ceiling had virtually been
painted blue, the user seemed submerged, see Figures 13 and
14. The following are the Lessons learned:
(i) the sounds that the ellipsoids made were coupled
to their 3D position, which added to their pose
recognition by the user and made it possible to draw
his attention;
(ii) by applying VR design techniques (i.e., normally in
AR only objects are drawn; the walls and floors are
taken from the real world) the virtual objects seem
real and the real objects, that is, humans walking
around, appear virtual or ghosts;
(iii) the graphics rendering done on the laptop to generate
the stereoscopic view does not show entirely geomet-
ric correct rendered images. Research is needed into
rendering for AR headsets, taking the deformation of
the presented images by the prisms into account;
(iv) using image processing on the tracker, the camera
can be used to segment walking persons, thus
enabling virtual objects (e.g., birds) to encircle them
realistically.
16–21/4/2008: At the Dutcheese exhibition at the Salone
Internazionale del Mobile 2008 in Milan, apart from real
furniture and textiles designs, a large space was augmented
with animated furniture and interactive textile (RFID
tagged). Two AR systems were simultaneously used, making
it possible for the bearers to discuss the designs each from a
Figure 15: Touching the RFID tagged textiles at the pole changes
the texture of the virtual curtains in the room.
Figure 16: Different viewpoints.
Figure 17: Virtual furniture designs; some are animated to show
the assembly process.
different viewpoint; see Figures 15, 16,and17. The following
is the Lesson learned:
(i) Design discussions are more vividly using head-
mounted AR in comparison with screen-based AR as
each user can now individually select his viewpoint
unhindered by the viewpoint selection of the other.
9–12/6/2008: In the Escher Museum an installation was made
using mobile AR and a Nintendo Wii. It was related to the
work of M. C. Escher and based on visual illusions and
distortions in the perception of physical space. The user
could use the Wii to throw a hole in the wall and have a
look at the visitors climbing up the central staircase of the
12 EURASIP Journal on Image and Video Processing
Figure 18: Using a Wii to throw a hole in the wall to see real visitors
climb up a real staircase elsewhere in the building.
Figure 19: Late medieval earthenware in the CT scanner of the
Erasmus Medical Centre.
Figure 20: AR visualization of cultural heritage using a rapid
prototyped earthenware piece with marker.
museum that was actually out of sight. See Figure 18.The
following are the Lessons learned:
(i) using a standard laptop is on the one hand rather
heavy to wear but does enable fast connection of new
interaction devices such as the Wii, but also webcams;
(ii) webcams can be used to generate life video streams
inside the virtual world.
25/10/2008–4/1/2009: Sgraffito in 3D. The Boijmans van
Beuningen Museum exhibited its collection of Sgraffito
Figure 21: The rapid prototypes can be touched.
Figure 22: Putting virtual plates on a real table.
Figure 23: Screen-based AR as low cost solution.
objects from the period 1450–1550. Sgraffito is an ancient
decorative technique in which patterns are scratched into the
wet clay. This archaeological collection was made accessible
for a broad public using 3D visualization and reconstruction
techniques. The original objects were scanned in a CT system
and after processing the data, the handmade plates, bowls
and pots and their relief decorations were both rendered in
virtual representations and rapid prototyped to provide 3D
copies of the originals. In the exhibition, video projections
show the actual CT scans; whereas the virtual renderings
enable visitors to view the objects from all angles. The
printed clones competed with the hundred original Sgraffito
objects in the exhibition. In screen-based AR setups, the
visitors could manipulate objects by manipulating special
rapid prototyped pieces of the earthenware with markers or
by browsing through a book of markers; at each page one
object was visualized and explained in text and accompanied
by music from the era of the pottery. Headset-based AR was
used in a setup in which virtual plates and bowls could be
arranged on a large table inviting for dinner, see Figures 19,
20, 21, 22, 23,and24.
EURASIP Journal on Image and Video Processing 13
Figure 24: Cultural heritage in 3D over the web.
Figure 25: Indoor/outdoor AR with an HMD.
The following are the Lessons learned:
(i) augmented reality can be fruitfully used to attract
a broad public to displays of cultural heritage. Its
narrative power is huge;
(ii) screen-based AR is a low cost replacement of HMD
based AR and can be fruitfully used to introduce the
topic at hand and the AR technology itself;
(iii) HMD-based AR is at its best when a full immersive
experience is required and people can walk around
larger objects.
11/7/2009: Zwoele Zomeravond. In the Kr
¨
oller M
¨
uller muse-
umbothoutdoorscreen-basedARaswellasindoorhead
mounted AR was shown to a broad public see Figures 25, 26,
and 27. The following is the Lesson learned:
(i) for outdoor AR it is necessary that the ambient light
intensity and the intensity of the LCD displays on the
HMD are in balance. Hence also the real world light
intensity needs to be controlled, for example, using
self-coloring sunglass technology.
4. Conclusions
In this paper we described the design of an optical-see-
through head-mounted system for indoor and outdoor
roaming Augmented Reality (AR) and its quantitative and
qualitative evaluation. Our ultimate goal was that virtual
world objects are indistinguishable from real world objects.
Hence, for optical see-through AR, measuring the head
movements with respect to the physical world is mandatory.
Figure 26: View of the user in the HMD.
Figure 27: Augmenting the Kr
¨
oller M
¨
uller sculpture park.
For the human head three motion classes can be distin-
guished: Stand-still—concentrating on an object. Smooth
pursuit—following moving objects (
≈ 30
◦
/s). Attention
drawing—making jump moves with the head (
≈ 150
◦
/s).
As it makes no sense to have the alignment better than the
resolution of the current headset displays, this forms the
theoretical limiting factor for the head-pose tracking system:
a static misalignment of <0.03
◦
, a dynamic misalignment,
when smoothly pursuing an object of <0.5
◦
and a dynamic
misalignment of <2.5
◦
when an event in the image draws
the attention. Based on these requirements we developed a
head-mounted AR system, of which the hardest problem was
to develop an accurate tracking system. We implemented
a combination of camera and inertia tracking, alike the
human visual/vestibular system. Although our ambition
was to use natural features, we had to focus on a marker
tracking camera system, as for now the processing of natural
features is still too slow for this application. After realizing
two prototypes, one of which incorporated a redesign of
the head-mounted displays, making it more lightweight
and open, we measured our system by mounting it on an
industrial robot to verify if our requirements were met.
To obtain qualitative conclusions, an ARlab was founded
with the Royal Academy of Art (KABK), the Delft University
of Technology (TUD), and various SME as partners, and
we tested the system with artists, designers, and curators in
art, design, and cultural heritage projects. This collaboration
provided us with very useful observations for profitable use
of the system.
14 EURASIP Journal on Image and Video Processing
4.1. Quantitative Conclusions. We can conclude that our
tracker based on the fusion of data from the camera and the
inertia tracker works well at 100 Hz, albeit that the required
orientation accuracy of 0.5
◦
when moving the head slowly
(smoothpursuit)isjustmetwithone13
× 16.5cmmarker
at 5 m distance when the camera’s systematic orientation
error can be calibrated away. Because the camera is the only
absolute position sensor to “anchor” to the real world, these
errors cannot be corrected by the inertia sensors. In addition,
to obtain this error one has to view the markers under an
angle of more than 20
◦
, which restricts the user’s movements
a bit. However, the real improvement should come from
a more accurate lens calibration or better lens, and/or
higher resolution cameras and/or putting more markers,
with known geometric relations, in the field of view of the
camera and/or using natural features in combination with
markers. The current systematic error, that is dependent on
the location of the marker in the image, is compensated
by the Kalman filter using the bias states, leading to over
and undershoots upon user movements. This leads to visible
jitter of the virtual objects on top of jitter from noisy
camera measurements when the marker is far away or the
illumination conditions are not within range.
Although, the jitter is visible for the user, it is not as bad
as it seems as the human eye seems to cope with it; the fovea
tracks the virtual objects especially when they move.
4.2. Qualitative Conclusions. Lessons learned from exper-
iments with audience on various events and exhibitions
showed the following.
(i) The augmented view can be peeked from the tracker
camera and used to let the public see through the
user’s eye.
(ii) Information display and interaction do not necessar-
ily have to take place on a wall or table, but might also
take place in the air.
(iii) Positioning virtual objects in the air covers up for
static misalignment.
(iv) Motion of the virtual objects covers up for misalign-
ment and jitter; the human visual attention is already
drawn by the motion of the object. The same is true
when the user moves.
(v) Design packages such as Cinema 4D make design
with animated figures possible. For real 3D animated
films with large plots, game engines must be incorpo-
rated.
(vi) Manipulation of real objects can influence (through
RFID) the virtual world. This is “magic” for many
people.
(vii) More image processing on the tracker camera is
useful, for example, to segment the user’s hand and
fingers making unhandy data gloves superfluous.
Segmenting walking people enables virtual objects to
encircle them.
(viii) The sound that virtual objects make adds to their
pose recognition and attention drawing.
(ix) By applying VR design techniques, virtual objects
appear real and real objects virtual.
(x) More research is needed into the rendering of
stereoscopic images for AR headsets, taking the
deformation of the presented images by the prisms
into account.
(xi) Design discussions are more vividly using HMD
based AR as each user can now individually select his
(the best) viewpoint.
(xii) Standard laptops are heavy to wear but enable easy
connections to new interaction devices such as the
Wii.
(xiii) Life video streams inside the virtual world give a tele-
presence awareness.
(xiv) Screen-based AR is a low cost replacement of HMD
based AR and can be fruitfully used to introduce the
topic at hand and the AR technology itself.
(xv) Headset-based AR is at its best when a full immersive
experience is required and people can walk around
larger objects.
(xvi) For outdoor AR it is necessary that the ambient light
intensity and the intensity of the LCD displays on the
HMD are in balance.
(xvii) Augmented reality can be fruitfully used to attract
a broad public to displays of cultural heritage as a
three-month exhibition in museum Boijmans van
Beuningen in Rotterdam showed. Its narrative power
is huge.
The collaboration between researchers in the area of image
processing with artists, designers, and curators appeared to
be very fruitful and has led to many amazing productions
and exhibitions.
Acknowledgments
This work was made possible by the SIA-RAAK projects
Visualization Techniques for Art and Design (2006-2007)
and Interactive Visualization Techniques for Art and Design
(2007–2009). The authors thank all artists, designers, and
curators for their contributions: Wim van Eck, Pawel Poku-
tycki, Niels Mulder, Joachim Rotteveel, Melissa Coleman, Jan
Willem Brandenburg, Jacob de Baan, Mark de Jong, Marina
de Haas, Alwin de Rooij, Barbara Vos, Dirk van Oosterbosch,
Micky Piller, Ferenc Molnar, Mit Koevoets, Jing Foon Yu,
Marcel Kerkmans, Alrik Stelling, Martin Sjardijn, and many
staff, students, and volunteers.
References
[1] P. Milgram, H. Takemura, A. Utsumi, and F. Kishino, “Aug-
mented reality: a class of displays on the reality-virtuality con-
tinuum,” in Conference on Telemanipulator and Telepresence
Technologies, vol. 2351 of Proceedings of SPIE, pp. 282–292,
Boston, Mass, USA, 1994.
[2] R. Pausch, T. Crea, and M. Conway, “A literature survey for
virtual environments: military flight simulator visual systems
EURASIP Journal on Image and Video Processing 15
and simulator sickness,” Presence: Teleoperators and Virtual
Environments, vol. 1, no. 3, pp. 344–363, 1992.
[3] L.J.Hettinger,K.S.Berbaum,R.S.Kennedy,W.P.Dunlap,
and M. D. Nolan, “Vection and simulator sickness,” Military
Psychology, vol. 2, no. 3, pp. 171–181, 1990.
[4] K. M. Stanney, R. R. Mourant, and R. S. Kennedy, “Human
factors issues in virtual environments: a review of the litera-
ture,” Presence: Teleoperators and Virtual Environments, vol. 7,
no. 4, pp. 327–351, 1998.
[5] S. Persa and P. Jonker, “On positioning for augmented reality
systems,” in Handheld and Ubiquitous Computing, H W.
Gellersen, Ed., vol. 1707 of Lecture Notes in Computer Science,
pp. 327–329, Springer, Berlin, Germany, 1999.
[6] P. Jonker, S. Persa, J. Caarls, F. de Jong, and R. L. Lagendijk,
“Philosophies and technologies for ambient aware devices in
wearable computing grids,” Computer Communications, vol.
26, no. 11, pp. 1145–1158, 2003.
[7] J.Caarls,P.Jonker,andS.Persa,“Sensorfusionforaugmented
reality,” in Proceedings of the 1st European Symposium on
Ambient Intelligence (EUSAI ’03), vol. 2875, pp. 160–176,
Veldhoven, The Netherlands, November 2003.
[8] K. Hirokazu and M. Billinghurst, “Augmented reality toolkit,”
January 2009, />[9] The Lifeplus (Ist-2001-34545) Project, MIRAlab, Geneva,
Switzerland; FORTH, Heraklion, Greece, 2002–2004, http://
lifeplus.miralab.unige.ch/HTML/results
visuals.htm.
[10] W. Piekarski, Interactive 3D modeling in outdoor augmented
reality worlds, Ph.D. thesis, Wearable Computer Lab at the
University of South Australia, 2004.
[11] S. J. Yohan, S. Julier, Y. Baillot, et al., “BARS: Battlefield
Augmented Reality System,” in Proceedings of the NATO
Symposium on Information Processing Techniques for Military
Systems, pp. 9–11, 2000.
[12] “Mars project,” />rs/mars.html, July 2009.
[13] January 2009.
[14] January 2009.
[15] January 2009.
[16] January 2009.
[17] www.dell.com, January 2009.
[18] January 2009.
[19] />e.html, January 2009.
[20] />2009.
[21] L. Naimark and E. Foxlin, “Circular data matrix fiducial
system and robust image processing for a wearable vision-
inertial self-tracker,” in Proceedings of the 1st International
Symposium on Mixed and Augmented Reality (ISMAR ’02),pp.
27–36, Darmstadt, Germany, September-October 2002.
[22] July 2009.
[23] D. G. Lowe, “Object recognition from local scale-invariant
features,” in Proceedings of the Seventh IEEE International
Conference on Computer Vision (ICCV ’99), vol. 2, pp. 1150–
1157, Kerkyra, Greece, 1999.
[24] D. G. Lowe, “Distinctive image features from scale-invariant
keypoints,” International Journal of Computer Vision, vol. 60,
no. 2, pp. 91–110, 2004.
[25] K. Mikolajczyk and C. Schmid, “A performance evaluation of
local descriptors,” IEEE Transactions on Pattern Analysis and
Machine Intelligence, vol. 27, no. 10, pp. 1615–1630, 2005.
[26] H. Bay, A. Ess, T. Tuytelaars, and L. Van Gool, “Speeded-
Up Robust Features (SURF),” Computer Vision and Image
Understanding, vol. 110, no. 3, pp. 346–359, 2008.
[27] G. M. Gauthier, J L. Vercher, and J. Blouin, “Integrating
reflexes and voluntary behaviours: coordination and adap-
tation controls in man,” in Human and Machine Perception:
Information Fusion, V. Cantoni, V. D. Gesu, A. Setti, and D.
Tegolo, Eds., pp. 189–206, Plenum Press, New York, NY, USA,
1997.
[28] J. E. Cutting and P. M. Vishton, “Perceiving layout and
knowing distances,” in Perception of Space and Motion,W.
Epstein and S. Rogers, Eds., Handbook of Perception and
Cognition, pp. 70–118, Academic Press, New York, NY, USA,
2nd edition, 1995.
[29] A. J. Davison, “Real-time simultaneous localisation and
mapping with a single camera,” in Proceedings of the 9th IEEE
International Conference on Computer Vision (ICCV ’03), vol.
2, pp. 1403–1410, Nice, France, 2003.
[30] M. Montemerlo and S. Thrun, FastSLAM: A Scalable Method
for the Simultaneous Localisation and Mapping Problem in
Robotics, vol. 27, Springer, Berlin, Germany, 2007.
[31] R.M.HaralickandL.G.Shapiro,Computer and Robot Vision,
vol. 1, Addison-Wesley, Reading, Mass, USA, 1992.
[32] R.M.HaralickandL.G.Shapiro,Computer and Robot Vision,
vol. 2, Addison-Wesley, Reading, Mass, USA, 1993.
[33] C. G. Harris and M. J. Stevens, “A combined corner and edge
detector,” in Proceedings of the 4th Alvey Vision Conference, vol.
15, pp. 147–151, University of Manchester, Manchester, UK,
August-September 1988.
[34] D. Ziou and S. Tabbone, “Edge detection techniques—an
overview,” International Journal of Pattern Recognition and
Image Analysis, vol. 8, pp. 537–559, 1998.
[35] V. Torre and T. A. Poggio, “On edge detection,” IEEE
Transactions on Pattern Analysis and Machine Intelligence, vol.
8, no. 2, pp. 147–163, 1986.
[36] G. Vass and T. Perlaki, “Applying and removing lens distortion
in post production,” in Proceedings of the 2nd Hungarian
Conference on Computer Graphics and Geometry, pp. 9–16,
Budapest, Hungary, 2003.
[37] J. Weng, P. Cohen, and M. Herniou, “Camera calibration with
distortion models and accuracy evaluation,” IEEE Transactions
on Pattern Analysis and Machine Intelligence, vol. 14, no. 10, pp.
965–980, 1992.
[38] Z. Zhang, “A flexible new technique for camera calibration,”
IEEE Transactions on Pattern Analysis and Machine Intelligence,
vol. 22, no. 11, pp. 1330–1334, 2000.
[39] M. T. El-Melegy and A. A. Farag, “Nonmetric lens distortion
calibration: closed-form solutions, robust estimation and
model selection,” in Proceedings of the 9th IEEE International
Conference on Computer Vision, vol. 1, pp. 554–559, Nice,
France, October 2003.
[40] R. E. Kalman, “A new approach to linear filtering and
predicting problems,” Journal of Basic Engineering, vol. 82, pp.
35–45, 1960.
[41] S. J. Julier and J. K. Uhlmann, “New extension of the Kalman
filter to nonlinear systems,” in The 6th Signal Processing,
Sensor Fusion, and Target Recognition Conference, vol. 3068 of
Proceedings of SPIE, pp. 182–193, Orlando, Fla, USA, April
1997.
[42] J. D. Hol, T. B. Sch
¨
on, H. Luinge, P. J. Slycke, and F. Gustafsson,
“Robust real-time tracking by fusing measurements from
inertial and vision sensors,” Journal of Real-Time Image
Processing, vol. 2, no. 2-3, pp. 149–160, 2007.
[43] G. S. W. Klein and T. W. Drummond, “Tightly integrated
sensor fusion for robust visual tracking,” Image and Vision
Computing, vol. 22, no. 10, pp. 769–776, 2004.
16 EURASIP Journal on Image and Video Processing
[44] L. Armesto, J. Tornero, and M. Vincze, “Fast ego-motion
estimation with multi-rate fusion of inertial and vision,”
International Journal of Robotics Research, vol. 26, no. 6, pp.
577–589, 2007.
[45] B. P. Ickes, “A new method for performing digital control sys-
tem attitude computations using quaternions,” AIAA Journal
of Guidance, Control and Dynamics, vol. 8, no. 1, pp. 13–17,
1970.
[46] J. J. LaViola Jr., “A comparison of unscented and extended
Kalman filtering for estimating quaternion motion,” in Pro-
ceedings of the American Control Conference, vol. 3, pp. 2435–
2440, Denver, Colo, USA, June 2003.
[47] January 2009.
[48] />Iron Bridge, July 2009.