Supply Chain 2012 Part 9 ppt
Bạn đang xem bản rút gọn của tài liệu. Xem và tải ngay bản đầy đủ của tài liệu tại đây (239.91 KB, 30 trang )
13
Optimization of Multi-Tiered Supply Chain
Networks with Equilibrium Flows
Suh-Wen Chiou
National Dong Hwa University
Taiwan
1. Introduction
Consider a multi-tiered supply chain network which contains manufacturers, distributors
and consumers. A manufacturer located at the top tier of this supply chain is supposed to be
concerned with the production of products and shipments to the distributors for profit
maximization. In turn, a distributor located in the middle tier of the supply chain is faced
with handling and managing the products obtained from manufacturers as well as
conducting transactions with consumers at demand markets. The consumer, who is the
ultimate user for the product in the supply chain, located at the bottom tier of the supply
chain agrees to the prices charged by distributors for the product if the associated business
deal is done. The underlying behaviour of manufacturers, distributors and consumers is
supposed to compete in a non-cooperative manner. Each decision maker individually
wishes to find optimal shipments given the ones of other competitors. The problem of
deciding optimal shipments in a supply chain equilibrium network was firstly noted by
Nagurney et al. (2002). Dong et al. (2004) developed a supply chain network model where a
finite-dimensional variational inequality was formulated for the behaviour of various
decision makers. Zhang (2006), in turn, proposed a supply chain model that comprises
heterogeneous supply chains involving multiple products and competing for multiple
markets.
In this chapter we develop an optimal solution scheme for a multi-tiered supply chain
network which contains manufacturers, distributors and consumers. In the multi-tiered
supply chain network, there are two kinds of decision-making levels investigated: the
management level and the operations level. For the management level, the decision maker
wishes to find a set of optimal policies which aim to minimize total cost incurred by the
whole supply chain network. For the operations level, assuming the underlying behaviour
of the multi-tiered decision makers compete in a non-cooperative manner, each decision
maker individually wishes to find optimal shipments given the ones of other competitors.
Therefore a problem of deciding equilibrium productions and shipments in a multi-tiered
supply chain network can be established. Nagurney et al. (2002) were the first ones to
recognize the supply chain equilibrium behaviour, in this chapter, we enhance the
modelling of supply chain equilibrium network by taking account of policy interventions at
Supply Chain: Theory and Applications
232
management level, which takes the responses of the decision makers at operations level to
the changes made at management level for which a minimal cost of the supply chain can be
achieved. A new solution scheme is also developed for optimizing a multi-tiered supply
chain network with equilibrium flows.
Optimization for a multi-tiered supply chain network with equilibrium flows can be
formulated as a mathematical program with equilibrium constraints (MPEC) where a two-
level decision making process is considered. A MPEC program for a general network design
problem is widely known as non-convex and non-differentiable. In this chapter, a non-
smooth analysis is employed to optimize the policy interventions determined at the
management level. The first order sensitivity analysis is carried out for supply chain
equilibrium network flow which is determined at the operations level. The directional
derivatives and associated generalized gradient of equilibrium product flows (shipments)
with respect to the changes of policy interventions made at management level can be
therefore obtained. Because the objective function of the multi-tiered supply chain network
is non-smooth, a subgradient projection solution scheme (SPSS) is proposed to solve the
multi-tiered supply chain network problem with global convergence. Numerical
calculations are conducted using a medium-scale supply chain network. Computational
results successfully demonstrate the potential of the SPSS approach in solving a multi-tiered
supply chain equilibrium network problem with reasonable computational efforts.
The organization of this chapter is as follows. In next section, a MPEC formulation is
addressed for a multi-tiered supply chain network with equilibrium flows where a two-level
decision making process is considered. The first-order sensitivity analysis for equilibrium
flows at operations level is carried out by solving an affine variational inequality. A
subgradient projection solution scheme (SPSS), in Section 3, is proposed to globally solve the
multi-tiered supply chain network problem with equilibrium flows. In Section 4 numerical
calculations and comparisons with earlier methods in solving the supply chain network
problem are conducted using a medium-scale network. Good results with far less
computational efforts by the SPSS approach are also reported. Conclusions and further work
associated are summarized in Section 5.
2. Problem formulation
In this section, a MPEC program is firstly given for a three-tiered supply chain network
containing manufacturers, distributors and consumers where a two-level decision making
process: the management level and the operations level, is considered. A first-order
sensitivity analysis is conducted for which the generalized gradient and directional
derivatives of variable of interests at operations level can be obtained. At the management
level, suppose strong regularity condition (Robinson, 1980) holds at the variable of interests
with respect to the policy interventions which are determined at management level, a one
level MPEC program can be established. The directional derivatives for the three-tiered
supply chain network can be also therefore found via the corresponding sugbradients.
Optimization of Multi-Tiered Supply Chain Networks with Equilibrium Flows
233
2.1 Notation
M
: a set of manufacturers located at the top tier of the multi-tiered supply chain network.
R
: a set of distributors located in the middle tier of the multi-tiered supply chain network.
U : a set of demand markets located at the bottom tier of the multi-tiered supply chain
network.
E
: a set of policy settings determined at management level in the multi-tiered supply chain
network.
ij
x
: the product flow/shipment between agents at distinct tiers of the multi-tiered supply
chain network.
)(
i
p : the production cost function for a manufacturer i , Mi
.
)(
j
h
: the handling cost function for a distributor j , Rj .
)(
1
ij
t
: the transaction cost function on link ),( ji between manufacturer i and distributor
j , Mi and Rj .
)(
2
jk
t
: the transaction cost function on link ),( kj between distributor j and consumers at
demand market k ;
Rj
and Uk .
k
d : the consumptions at the demand market k , Uk
.
ij1
O
: the market price charged for distributor j by manufacturer i , Mi and Rj .
jk2
O
: the market price charged for demand market k by distributor j , Rj and
Uk .
j
J
: the market clear price for distributor
j
,
Rj
.
k
P
: the price at demand market k , Uk .
2.2 Equilibrium conditions for a three-tiered supply chain network
According to Nagurney (1999), optimal production and shipments for manufacturers in a
three-tiered supply chain network can be found by solving the following variational
inequality formulation. Find the values
1
Kx
ij
, RjMi , such that
0)()(
11
t
¦¦
MiRj
ijijijii
xzxtXp
O
(1)
for all
},,{
1
RjMixKz
ij
where
¦
Rj
iji
xX .
Akin to inequality (1), the optimal inbound shipments for distributor
j , say
ij
x , from the
manufacturer
i , and the outbound shipments, say
jk
x
, to the consumers at demand market
Supply Chain: Theory and Applications
234
k , coincide with the solutions of the following variational inequality. Find values
1
Kx
ij
and
2
Kx
jk
,
RjMi ,
and Uk as well as the market clear price
j
J
such that
¦¦¦¦
RjUk
jkijjjk
MiRj
ijjjjij
xzxtxwXh
221
)()(
OJJO
0t
¸
¸
¹
·
¨
¨
©
§
¦¦¦
Rj
j
Uk
jk
Mi
ij
xx
JJ
(2)
for all
},,{
1
RjMixKw
ij
, },,{
2
UkRjxKz
jk
and
¦
Uk
jkj
xX
. The
market clear price
j
J
in a three-tiered supply chain network is associated with the product
flow conservation which holds for each distributor
j , Rj as follows.
¦¦
t
Uk
jk
Mi
ij
xx (3)
Assuming the underlying behavior of the consumers at demand market
k , Uk
competing non-cooperatively with other consumers for the product provided by
distributors, in the third tier supply chain network the governing equilibrium condition for
the consumptions at demand market k can be, in a similar way to (1) and (2), coincide with
the solutions of the following variational inequality in the following manner. Determine the
consumptions
k
d such that
0
2
t
¦¦
RjUk
jkkjk
xz
PO
(4)
for all },,{
2
UkRjxKz
jk
and
¦
Rj
jkk
xd .
2.3 A three-tiered supply chain network equilibrium model
Consider the optimality conditions given in (1-2) and (4) respectively for manufacturers,
distributors and consumers, a three-tiered supply chain network equilibrium model can be
established in the following way.
Definition 1. A three-tiered supply chain network equilibrium: The equilibrium state of the
supply chain network is one where the product flows between the distinct tiers of the agents
coincide and the product flows and prices satisfy the sum of the optimality conditions (1),
(2) and (4). Ō
Optimization of Multi-Tiered Supply Chain Networks with Equilibrium Flows
235
Theorem 2. A variational inequality for the three-tiered supply chain network model: The
equilibrium conditions governing the supply chain network model with competitions are
equivalent to the solution of the following variational inequality. Find
),(),(
21
KKxx
jkij
such that
¦¦¦¦
RjUk
jkkjjk
MiRj
ijjijjjii
xvxtxuxtXhXp
PJJ
)()()()(
21
0t
¸
¸
¹
·
¨
¨
©
§
¦¦¦
Rj
j
Uk
jk
Mi
ij
xx
JJ
(5)
for all
),(),(
21
KKvu , and
j
J
is the market clear price for distributor j , Rj .
Proof. Following the Definition 1, the equilibrium conditions for a three-tiered supply chain
network in determining optimal productions for manufacturers, optimal inbound and
outbound shipments for distributors and optimal consumptions for consumers can be
expressed as the following aggregated form of summing up the (1), (2) and (4). Find
),(),(
21
KKxx
jkij
such that
¦¦¦¦
RjUk
jkkjjk
MiRj
ijjijjjii
xvxtxuxtXhXp
PJJ
)()()()(
21
0t
¸
¸
¹
·
¨
¨
©
§
¦¦¦
Rj
j
Uk
jk
Mi
ij
xx
JJ
for all ),(),(
21
KKvu , and
j
J
is the market clear price for distributor j , Rj
.Ō
2.4 A generalized variational inequality
In the supply chain network equilibrium model (5), suppose
)(),(),(
1
ijji
thp
and )(
2
jk
t ,
RjMi , and Uk are continuous and convex. Let
°
¿
°
¾
½
°
¯
°
®
t
¦¦
RjxxxxKKK
Uk
jk
Mi
ijjkij
,:),(
21
(6)
And
UkRjMijkijji
tthpF
,,21
),,,()(
(7)
a standard variational inequality for (5) can be expressed as follows. Determine
K
X
such that
Supply Chain: Theory and Applications
236
0))(( t XZXF
t
(8)
K
Z
where the superscript
t
denotes matrix transpose operation.
2.5 A link-based variational inequality
Regarding the inequality (8), a link-based variational inequality formulation for a three-
tiered supply chain network equilibrium model can be expressed in the following way. Let
s
and d respectively denote total productions and demands for the supply chain. Let q
denote the equilibrium link flow in the supply chain network,
x
denote the path flow
between distinct tiers,
/
and * respectively denote the link-path and origin/destination-
path incidence matrices. The set
K
in (6) can be re-expressed in the corresponding manner.
}0,,,:{ t
*/ xdsdxxqqK (9)
Let
f denote the corresponding cost for link flow q . A link-based variational inequality
formulation for (8) can be expressed as follows. Determine values Kq such that
0))(( t qzqf
t
(10)
for all
K
z
.
2.6 A MPEC programme
Optimal policy settings for a three-tiered supply chain equilibrium network (5) can be
formulated as the following MEPC program.
),(
0
,
q
Min
q
E
E
4 (11)
subject to
:
E
, )(
E
Sq
where : denotes the domain set of the decision variables of the policy settings which are
determined at management level, and )(S denotes the solution set of equilibrium flows
which is determined at operations level in a three-tiered supply chain network, which can
be solved as follows.
0))(,( t qzqf
t
E
(12)
for all
K
z
.
2.7 Sensitivity analysis by directional derivatives at operations level
Following the technique employed (Qiu & Magnanti, 1989), the sensitivity analysis of (12) at
operations level in a three-tiered supply chain network can be established in the following
way. Let the changes in link or path flows with respect to the changes in the policy settings
Optimization of Multi-Tiered Supply Chain Networks with Equilibrium Flows
237
made at management level be denoted by
q
c
or
x
c
, the corresponding change in path flow
cost be denoted by
F
c
, and let the demand market price be denoted by
P
. Introduce
^`
0
,0,: KxandxxqthatsuchxqK
c
c
*
c
/
cc
c
c
(13)
where
°
°
¿
°
°
¾
½
°
°
¯
°
°
®
d
c
!
c
!
!
!
c
c
c
c
c
00,
00,
0
,0).(
,0).(
,0).(
,).(
:
0
FwithxandFif
FwithxandFif
Fif
xif
xiv
xiii
xii
freexi
xK
P
P
P
(14)
Therefore the directional derivatives of (12) can be obtained by solving the following affine
variational inequality. Find
Kq
c
c
,
0)(),(),( t
c
c
c
qzqqfqf
t
q
EEE
E
(15)
for all
K
z
c
where f
E
and
f
q
are gradients evaluated at
q,
E
when the changes in
the policy settings made at management level are specified. According to Rademacher’s
theorem (Clarke, 1980) in (11) the solution set
)(S is differentiable almost everywhere.
Thus, the generalized gradient for
)(S can be denoted as follows.
^
`
existsqqqconvS
kkk
k
)(,:)(lim)()(
EEEEEE
o
c
w
fo
(16)
where conv denotes the convex hull.
2.8 A one level mathematical program
At the management level, suppose strong regularity condition (Robinson, 1980) holds at the
variable of interests with respect to the policy interventions, due to inequality (15) a one
level MPEC program can be established in the following way. Suppose the solution set )(S
is locally Lipschitz, a one level optimization problem of (11) is to
)(
E
E
4
Min
(17)
subject to
:
E
In problem (17), as it seen obviously from literature (Dempe, 2002; Luo et al., 1996), )(4
function is a non-smooth and non-convex function with respect to the policy settings
determined at management level in a three-tiered supply chain network because the
solution set of equilibrium flow )(S at operations level may not be explicitly expressed as a
closed form.
Supply Chain: Theory and Applications
238
3. A non-smooth optimization model
Due to non-differentiability of the solution set )(S in (17), in this section, we propose an
optimal solution scheme using a non-smooth approach for the three-tiered supply chain
network problem (17). In the following we suppose that the objective function )(4 is semi-
smooth and locally Lipschitz. Therefore the directional derivatives of
)(4 can be
characterized by the generalized gradient, which are also specified as follows.
Definition 3 <Semi-smoothness, adapted from Mifflin (1977)> We say that
)(4 is
semismooth on set
:
if )(4 is locally Lipschitz and the limit
^`
hv
thhhtv
lim
0,),( po4w
E
(18)
exists for all
h . ႒
Theorem 4 <Directional derivatives for semismooth functions, adapted from Qi & Sun
(1993)> Suppose that
)(4 is a locally Lipschitzian function and the directional derivative
);( h
E
4
c
exists for any direction h at
E
. Then
(1).
);( h4
c
is Lipscitizian;
(2). For any
h , there exists a )(
E
4wv such that
vhh 4
c
);(
E
(19)
႒
The generalized gradient of )(4 can be expressed as follows.
^
`
existsconv
kkk
k
)(,:)(lim)(
EEEEE
4o4 4w
fo
(20)
According to Clarke (1980), the generalized gradient is a convex hull of all points of the form
)(lim
k
E
4 where the subsequence
^
`
k
E
converges to the limit value
E
. And the
gradients in (20) evaluated at
kk
q,
E
can be expressed as follows.
)(),(),()(
00
kkk
q
kkk
qqq
EEEE
E
c
44 4
(21)
where the directional derivatives
)(
k
q
E
c
can be obtained from (15).
3.1 A subgradient projection solution scheme (SPSS)
Consider the non-smooth problem (17), a general solution by an iterative subgradient
method can be expressed in the following manner. Let
:
:
)(Pr
E
denote the projection of
E
on set : such that
Optimization of Multi-Tiered Supply Chain Networks with Equilibrium Flows
239
yxxx
y
:
:
inf)(Pr (22)
thus we have
)(),(Pr
1 kkk
vtv
EEE
4w
:
(23)
and
0,20),(,
)()(
2
!dd4w
44
bbav
v
t
k
k
OE
EE
O
(24)
where the local minimum point
E
is supposed to be known and
k
1
O
. Since the
subgradient method is a non-descent method with slow convergence as commented and
modified from literature, in this chapter, we are not going to investigate the details of these
progress. On the other hand, a new globally convergent solution scheme for problem (17) is
proposed via introducing a matrix in projecting the subgradient of the objective function
onto a null space of active constraints in order to efficiently search for feasible points. In this
proposed solution scheme, consecutive projections of the subgradient of the objective
function help us dilate the direction provided by the negative of the subgradient which
greatly improves the local solutions obtained. In the following, Rosen’s gradient projection
matrix is introduced first.
Definition 5. <Projection matrix> A
nn* matrix G is called a projection matrix if
t
GG
and GGG . ႒
Thus the proposed Subgradient Projection Solution Scheme (SPSS) for the non-smooth
problem (17) can be presented in the following way.
Theorem 6. <Subgradient Projection Solution Scheme> In problem (17), suppose
)(4 is
lower semi-continuous on the domain set
:
. Given a
1
E
such that
DE
4 )(
1
, the level
set
^`
DEEE
D
d4: : )(,:)(S
is bounded and 4 is locally Lipschitzian and semi-smooth
on the convex hull of
D
S . A sequence of iterates
^
`
k
E
can be generated in accordance with
)(),(Pr
1 kkk
k
kk
vvtG
EEE
4w
:
(25)
where
t
is the step length which minimize
k
4 and the projection matrix
k
G is of the
following form.
k
t
kk
t
kk
MMMMIG
1
)(
(26)
Supply Chain: Theory and Applications
240
In (26)
k
M is the gradient of active constraints in (17) at
k
E
, where the active constraint
gradients are linearly independent and thus
k
M has full rank. The search direction
k
h can
be determined in the following form.
k
k
k
vGh (27)
Then the sequence of points
^
`
k
E
generated by the SPSS approach is bounded whenever
0)( z4
k
k
G
E
.
Proof. For any
x
and y in the set : , by definition of the projection, we have
yxyx d
::
)(Pr)(Pr (28)
thus for
1k
E
we have
22
1
)(Pr
:
EEEE
kkk
th (29)
2
d
EE
kk
th
ktkkk
htht )(2
2
2
2
EEEE
let
2
2
)(2
kktk
hthtC
EE
(30)
then (29) can be rewritten as
C
kk
d
22
1
EEEE
Since 4 is locally Lipschitzian and semi-smooth on the convex hull of
D
S , by convexity we
have
)()()()(
44t4
EEEEE
kktk
for any
1
H
and
2
H
]2,0[
there exists
O
such that
21
20
H
O
H
ddd , let
2
)(
)()(
k
k
k
G
t
E
EE
O
4
44
(31)
In (30), it can be rewritten as
Optimization of Multi-Tiered Supply Chain Networks with Equilibrium Flows
241
2
2
2
2
2
)(
)(
)()(
)()(
)(
)()(
2
k
k
k
k
k
k
k
tk
k
k
k
G
G
G
G
C
E
E
EE
OEEE
E
EE
O
4
¸
¸
¸
¹
·
¨
¨
¨
©
§
4
44
4
4
44
2
2
2
2
2
)(
)()(
)(
)()(
2
k
k
k
k
E
EE
O
E
EE
O
4
44
4
44
t
(due to convexity)
0)2(
)(
)()(
2
2
t
¸
¸
¹
·
¨
¨
©
§
4
44
OO
E
EE
k
k
thus we have
22
1
d
EEEE
kk
for 3,2,1 k It implies
EE
k
is
monotonically decreasing and
d
EEEE
1k
. ႒
Theorem 7. Following Theorem 6, when
0)( 4
k
k
G
E
, if all the Lagrange multipliers
corresponding to the active constraint gradients in (17) are positive or zeros, it implies the
current point is a Karush-Kuhn-Tucker (KKT) point. Otherwise choose one negative
Lagrange multiplier, say
j
K
, and construct a new
k
M
ˆ
of the active constraint gradients by
deleting the jth row of
k
M
ˆ
, which corresponds to the negative component
j
K
, and make
the projection matrix of the following form
k
t
kk
t
kk
MMMMIG
ˆ
)
ˆˆ
(
ˆ
ˆ
1
(32)
The search direction then can be determined by (27) and the results of Theorem 6 hold.႒
Theorem 8 <Convergence of SPSS> In problem (17) assuming that
)(4 is lower semi-
continuous on the domain set
: , given a
1
E
such that
DE
4 )(
1
, the level set
^`
DEEE
D
d4: : )(,:)(S
is bounded and 4 is locally Lipschitzian and semi-smooth on
the convex hull of
D
S . Let
^
`
k
E
be the sequence of points generated by the SPSS approach
as described above. Then every accumulation point
E
satisfies
)(0
4w
E
(33)
Proof. We proof this theorem by contradiction. Supposing
)(0
4w
E
, by definition there
is no subgradient
0)( 4
k
E
in the convex hull of
D
S , whose accumulation point is
E
.
Then there is a
0!
t minimizing )(
4 th
E
and a 0!
G
such that
Supply Chain: Theory and Applications
242
GEE
4 4
)()( ht and
ht
E
is an interior point of
D
S . By the mean value
theorem, for any
k
E
we have
)()()()(
44 4 hhththt
kktkkk
EE[EE
(34)
where
)(
kkk
hhtht
EEHE[
for some 10
H
. Following the Bozano-
Weierstrass theorem that there is a subsequence
^
`
kn
E
of
^
`
k
E
that converges to
E
, then
^`
)(
kn
[
4 converges to )(
4 ht
E
and
^`
)(
hht
knkn
EE
converges to zero.
For sufficiently large
kn , the vector
kn
[
belongs to the convex hull of
D
S and
2
)(
2
)()(
G
E
G
EE
4 4d4
htht
knkn
(35)
Let
kn
t be the minimizing point of )(
kn
kn
kn
ht4
E
. Since
^
`
)(
kn
E
4 is monotone decreasing
and converges to
)(
4
E
, we have
2
)()()()(
G
EEEE
4d4d44
knknkn
kn
kn
htht (36)
a contradiction. Therefore every accumulation point
E
satisfies )(0
4w
E
. ႒
Corollary 9 <Stopping condition> If
k
E
is a KKT point for problem (17) satisfying
Theorem 8 then the search process may stop; otherwise a new search direction at
k
E
can be
generated according to Theorem 6. ႒
3.2 Implementation Steps
In this subsection, ways in solving the non-smooth problem (17) for a three-tiered supply
chain network involving the management level and the operations level are conducted by
steps in the following manner.
Step 1. At the management level, start with the initial policy setting
k
E
, and set index
1 k .
Step 2. At the operations level, solve a three-tiered supply chain equilibrium problem by
means of (5) when the decision variables of policy
k
E
are specified at management level.
Find the subgradients for equilibrium products and shipments by means of (15), and obtain
the generalized gradient for the objective function of the supply chain network via (21).
Step 3. Use the SPSS approach to determine a search direction.
Step 4. If
0)( z4
k
k
G
E
, find a new
1k
E
by means of (25) and let 1m kk . Go to Step 2.
If
0)( 4
k
k
G
E
and all the Lagrange multipliers corresponding to the active constraint
Optimization of Multi-Tiered Supply Chain Networks with Equilibrium Flows
243
gradients are positive or zeros,
k
E
is a KKT point and stop. Otherwise, follow the results of
Theorem 6 and find a new projection matrix and go to Step 3.
4. Numerical calculations
In this section, we used a 9-node network from literature (Bergendorff et al., 1997) as an
illustration for a three-tiered supply chain network problem with equilibrium flows. In Fig.
1, a three-tiered supply chain is considered in which there are two pairs of manufacturers
and consumers, and 4 product-mix pairs: [1,3], [1,4], [2,3] and [2,4], can be accordingly
specified. In Fig. 1, manufacturers are denoted by nodes 1 and 2, distributors are denoted by
nodes 7 and 8, and the consumers are denoted by nodes 3 and 4. The corresponding demand
functions can be determined in the following manner:
3,13,1
5.010
P
d ,
4,14,1
5.020
P
d ,
3,23,2
5.030
P
d and
4,24,2
5.040
P
d . In this numerical illustration
a new set of link tolls at the management level is to be determined optimally such that traffic
congestion on the connected links between various distinct tiers can be consistently reduced.
In Fig. 1 let
a
A and
a
k be given parameters and specified as a pair ),(
aa
kA near each link.
The transaction costs on links are assumed in the following way.
))(15.01()(
4
a
a
aaa
k
q
Aqt
(37)
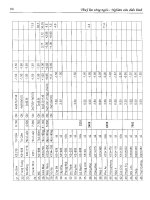
Computational results are summarized in Table 1 for a comparative analysis at two distinct
initial tolls. Three earlier well-known methods in solving the network design problem are
also considered: the sensitivity analysis method (SAB) proposed by Yang & Yagar (1995),
the Genetic Algorithm (GA) proposed by Ceylan & Bell (2004), and recently proposed
Generalized Projected Subgradient (GPS) method by Chiou (2007). As it seen in Table 1, the
SPSS approach improved the minimal toll revenue at two distinct initial tolls nearly by 18%
and 16% while the SAB method only did by 8% and 6%. The SPSS approach successfully
outperformed the GA method and newly proposed GPS method by 4% and 2% on average
in reduction of minimal toll revenue. For two sets of initial tolls the relative difference of the
minimal toll revenue did the SPSS is within 0.07 % while that did the SAB method is within
nearly 0.3%. Regarding the efficiency of the SPSS approach in solving the three-tiered
supply chain network with equilibrium flows when the toll settings are considered at
management level, the SPSS approach required the least CPU time in all cases. Furthermore,
as it obviously seen in Table 1, various sets of resulting tolls can be found due to the non-
convexity of the MPEC problem. Computational efforts on all methods mentioned in this
chapter were conducted on SUN SPARC SUNW, 900 MHZ processor with 4Gb RAM under
operating system Unix SunOS 5.8 using C++ compiler gnu g++ 2.8.1.
Supply Chain: Theory and Applications
244
Figure 1. 9-node supply chain network
5. Conclusions and discussions
This chapter addresses a new solution scheme for a three-tiered supply chain equilibrium
network problem involving two-level kinds of decision makers. A MPEC program for the
three-tiered supply chain network problem was established. In this chapter, from a non-
smooth approach, firstly, we proposed a globally convergent SPSS approach to optimally
solve the MPEC program. The first order sensitivity analysis for the three-tiered supply
chain equilibrium network was conducted. Numerical computations using a 9-node supply
chain network from literature were performed. Computational comparative analysis was
also carried out at two sets of distinct initial data in comparison with earlier and recent
proposed methods in solving the multi-tiered supply chain network problem. As it shown,
the proposed SPSS approach consistently made significant improvements over other
alternatives with far less computational efforts. Regarding near future work associated, a
multi-tiered supply chain network optimization problem with multi-level decision makers is
being investigated as well as implementations on large-scale supply chain networks.
6. Acknowledgements
Special thanks to Taiwan National Science Council for financial support via grant NSC 96-
2416-H-259-010-MY2
Optimization of Multi-Tiered Supply Chain Networks with Equilibrium Flows
245
1
st
set initials 2
nd
set initials
SAB GA GPS SPSS SAB GA GPS SPSS
Initial
toll (in
$)
2.0 2.0 2.0 2.0 5.5 5.5 5.5 5.5
Initial
revenue
(in $)
1223 1223 1223 1223 1198 1198 1198 1198
)5,1(
E
0.5 2.9 0 0 2.5 3.2 0 0
)6,1(
E
0.3 1.2 0.5 1.2 3.2 3.0 0.4 2.1
)5,2(
E
1.2 0 1.6 1.2 1.2 1.2 1.8 1.5
)6,2(
E
0.4 0 1.4 0.4 0 0 1.5 0.9
)6,5(
E
0 2.5 0 2.1 0 0 0.4 1.8
)7,5(
E
8.6 7.6 5.6 7.8 6.3 1.6 5.2 7.5
)9,5(
E
0.7 1.4 3.7 0.7 2.7 0.3 3.5 0.5
)5,6(
E
0 2.8 0 0 0 0 0.2 0
)8,6(
E
1.3 0 3.2 1.3 0 0 3.1 1.1
)9,6(
E
0 0 0 0 1.5 2.2 0.9 0.5
)3,7(
E
0.6 1.7 0.6 0.6 1.2 1.2 0 0
)4,7(
E
0.4 1.8 0.2 0.4 0.4 3.4 0 0
)8,7(
E
0 0 1.2 0 1.2 1.1 1.1 0.8
)3,8(
E
0 0 1.1 0 1.1 0 1.1 0.7
)4,8(
E
0.6 1.2 0.6 1.8 0.6 0.6 0 1.8
)7,8(
E
0 0 2.2 0.6 0.8 0 2.2 0.6
)7,9(
E
0.9 1.5 0 1.9 0.9 2.7 1.2 2.4
)8,9(
E
0 0 3.2 0 1.3 1.8 3.5 0.8
Revenu
e (in $)
1120.5 1048.9 1026.7 1005.5 1123.5 1050.7 1027.1 1004.8
cpu
time (in
sec)
132 258 84 7 154 263 85 6
Table 1. Computational results for 9-node supply chain network
Supply Chain: Theory and Applications
246
7. References
Bergendorff, P.; Hearn, D. W. & Ramana, M.V. (1997). Congestion toll pricing of traffic
networks, In: Network Optimization, Pardalos, Hearn, P.M. & Hager, W.W. (Eds.),
PP. 51-71, Springer-Verlag, ISBN 3-540-62541-0, Berlin.
Ceylan, H. & Bell, M.G.H. (2004). Reserve capacity for a road network under optimized
fixed time traffic signal control. Journal of Intelligent Transportation System, 8, 87ದ99,
ISSN 1547-2450.
Chiou, S-W. (2007). A non-smooth optimization model for a two-tiered supply chain
network. Information Sciences, 177, 5754-5762, ISSN 0020-0255.
Clarke, F. F. (1983). Optimization and Nonsmooth Analysis. John Wiley & Sons, ISBN 0-471-
87504-X, New York.
Dempe, S. (2002). Foundations of bilevel programming. Kluwer Academic Publishers, ISBN 1-
4020-0631-4, Dordrecht.
Dong, J.; Zhang, D. & Nagurney, A. (2004). A supply chain network equilibrium model
with random demands. European Journal of Operational Research, 156, 194ದ212, ISSN
0377-1277.
Luo, Z Q.; Pang, J-S. & Ralph, D. (1996). Mathematical Program with Equilibrium Constraints.
Cambridge University Press, ISBN 0-521-57290-8, New York.
Mifflin, R. (1977). Semismooth and semiconvex functions in constrained optimisation. SIAM
on Control and Optimization, 15, 959-972, ISSN 0363-0129.
Nagurney, A. (1999). Network Economics: A Variational Inequality Approach. Kluwer Academic
Publishers, ISBN 0-7923-8350-8, Boston.
Nagurney, A.; Dong, J & Zhang, D. (2002). A supply chain network equilibrium model.
Transportation Research Part E, 38, 281-303, ISSN 1366-5545
Outrata, J.V.; Kocvara, M & Zowe, J. (1998). Nonsmooth Approach to Optimization Problems
with Equilibrium Constraints. Kluwer Academic Publishers, ISBN 0-7923-5170-3,
Dordrecht.
Qi, L. & Sun, J. (1993). A nonsmooth version of Newton’s method. Mathematical
Programming, 58, 353-368, ISSN 0025-5610.
Qiu, Y. & Magnanti, T. L. (1989). Sensitivity analysis for variational inequalities defined on
polyhedral sets. Mathematics of Operations Research, 14, 410-432, ISSN 0364-765X.
Robinson, S. M. (1980). Strong regular generalized equations. Mathematics of Operations
Research, 5, 43-62, ISSN 0364-765X.
Yang, H. & Yagar, S. (1995). Traffic assignment and signal control in saturated road
networks, Transportation Research Part A, 29 (2) 125ದ139, ISSN 0965-8564.
Zhang, D. (2006). A network economic model for supply chain versus supply chain
competition. Omega, 34, 283 – 295, ISSN 0305-0483.
14
Parameterization of MRP for Supply Planning
Under Lead Time Uncertainties
A. Dolgui
1
, F. Hnaien
1
, A. Louly
2
and H. Marian
1
1
Centre for Industrial Engineering and Computer Science
2
King Saud University
College of Engineering - Industrial Engineering Department
1
France
2
Kingdom of Saudi Arabia
1. Introduction
Efficient replenishment planning is a very important problem in Supply chain management.
A poor inventory control policy leads to overstocking or stockout situations. In the former,
the generated inventories are expensive and in the later there are shortages and penalties
due to unsatisfied customer demands.
Material Requirements Planning (MRP) is a commonly accepted approach for replenishment
planning in major companies (Axsäter, 2006). The MRP software tools are accepted readily,
the majority of industrial decision makers are familiar with them through all the existing
production control system software. MRP software has a well developed information
system and has been proven over time.
However, MRP is based on the supposition that the demand and lead times are known. This
premise of deterministic environment seems somewhat off base since most production
occurs stochastically. Component and semi-finished product lead times and finished
product demands are rarely forecasted reliably. This is because there are some random
factors such as machine breakdowns, transport delays, customer demand variations, etc.
Therefore, in real life, the deterministic assumptions embedded in MRP are often too
limited.
Fortunately, the MRP approach can be adapted for replenishment planning under
uncertainties by searching optimal values for its parameters. This problem is called MRP
parameterization under uncertainties.
The planned lead times are parameters of MRP. For the case of random lead times, the
planned lead times are calculated as the sum of the forecasted and safety lead times. These
safety times are obtained as a trade-off between overstocking and stockout while
minimizing the total cost. The search for optimal values of safety lead times, and,
consequently, for planned lead times, is a crucial and challenging issue in Supply chain
management with MRP approach.
In this chapter, we present a methodology for optimal calculation of planned lead times in
the MRP approach. This methodology was developed in our previous works (Dolgui et al.,
1995; Dolgui, 2001; Dolgui & Louly, 2002; Louly & Dolgui, 2002; Louly & Dolgui, 2004,
Supply Chain: Theory and Applications
248
Louly et al., 2007) for supply chains with random lead times where holding and backlogging
costs are not negligible.
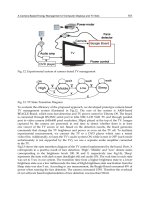
2. Inventory control in supply chains
Supply chain management is a collection of functional activities that are repeated many
times throughout the process through which raw materials are transformed into finished
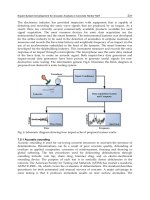
products (Ballou, 1999). An illustration of a Supply chain is given in Fig. 1.
Demand
Suppliers Production Assembl
y
Customers
Supplier
lead time
Production
lead time
Assembl
y
lead time
Figure 1. Supply chain
As reported in number of papers, various sources of lead time uncertainties may exist along
this chain. To avoid these uncertainties, the companies use safety stocks (safety lead times),
which are rather expensive. Therefore, it is desirable to develop special methods of supply
planning which focus on the stochastic properties of lead times (Maloni & Benton, 1997).
Supply management in industrial applications is mainly based on Material Requirements
Planning (MRP), which provides a framework for inventory control. In the MRP approach,
an important distinction is drawn between demand for the end product, i.e. independent
demand, and demand for one of its items, i.e. dependent demand (Baker, 1993). The
independent demands are known or forecasted by the methods which are developed in the
framework of "sales forecasting". The dependent demands can be calculated from the
independent ones by using Bill of Material and planned lead times.
Under MRP logic, time is viewed in discrete intervals called time buckets. The lead time is
equal to the elapsed time buckets from the order release date to the delivery (procurement,
production, etc.) of the corresponding item. The lot size is the quantity of items to be
ordered.
The MRP method is based on the deterministic calculation: all the orders of items are
released at the latest possible moment, so total cost will automatically be minimal. But, if
random factors exist, the meaning of "at the latest possible moment" is uncertain. In this
case, for each specific value of MRP parameters (concretely: planned lead times) we can
have a backlog or overstock probability. The larger the probability of backlog is, the bigger
the average backlogging cost over time. The same is true for overstock, the larger the
probability of overstock is, the greater the holding cost. Therefore, a challenging problem is
MRP parameterization, in particular, the choice of optimal values for planned lead times.
Parameterization of MRP for Supply Planning Under Lead Time Uncertainties
249
3. Related works
Yeung et al. (1998) propose a review on parameters having an impact on the effectiveness of
MRP systems under stochastic environments. Yücesan & De Groote (2000) did a survey on
supply planning under uncertainties, but they focused on the impact of the production
management under uncertainty on the lead times by observing the service level. Process
uncertainties are considered in (Koh et al., 2002; Koh & Saad, 2003).
The problem of MRP parameterization under lead time uncertainties has been often studied
via simulation. For example the study of Whybark & Williams (1976) suggests that a safety
lead time’s mechanism may perform better than that of a safety stock in a multi-level
production-inventory system when the production and replenishment times are stochastic.
Nevertheless, Grasso & Taylor (1984) reached another conclusion and prefer safety stocks
for both quantity and lead-time uncertainties. Weeks (1981) developed a single-stage model
with tardiness and holding costs in which the processing time is stochastic and demand is
deterministic. The author proves that this is equivalent to the standard “Newsboy” problem.
Gupta & Brennan (1995) show that lead time uncertainty has a large influence on the total
inventory management cost. Ho & Ireland (1998) illustrate that lead time uncertainty affects
stability of a MRP system no matter what lot-sizing method used or demand forecast error
obtained. The statistics from simulations by Bragg et al. (1999) demonstrate that the lead
times influence the inventories substantially. Molinder (1997) study the problem of planned
lead times (safety lead time/safety stock) calculation via simulation and proposes a
simulated annealing algorithm to find appropriate safety stocks and/or safety lead times.
The simulations show that the overestimated planned lead times is conducive to excessive
inventory, and underestimated planned lead times introduce shortages and delays.
(Grubbström, & Tang, 1999) study optimal safety stocks in single and multi-level MRP
systems, assuming the time interval of end item demand to be stochastic.
For serial multilevel production systems, i.e. where the previous level supplies the next and
only one supplier is at each level, Yano (1987a,b) suggests an approach to determine optimal
planned lead times for MRP. In this study, the lead times are stochastic, and finished
product demand is fixed. The author presents a general procedure for two stage systems
based on a single-period continuous inventory control model. The objective was to
minimize the sum of inventory holding costs, rescheduling costs arising from tardiness at
intermediate stages, and backlogging cost for the finished product. One of the main
obstacles for this approach consists in the difficulties to express the objective function in a
closed form for more than two stages.
In assembly systems there are several suppliers at each stage, and so, there is dependence
among the different component inventories at the same stage. Yano (1987c) considers a
particular problem for two-level assembly systems with only two types of components at
stage 2 and one type of components at stage 1. The delivery times for the three components
are stochastic continuous variables. The problem is to find the planned lead times for MRP
minimizing the sum of holding and tardiness costs. A single period model and an
optimization algorithm were developed. Tang & Grubbström (2003) consider a two
component assembly system with stochastic lead times for components and fixed finished
product demand. This study is similar to (Yano, 1987c). However, here, the process time at
level 1 is also assumed to be stochastic, the due date is known and the optimal planned lead
times are smaller than the due date. The objective is to minimize the total stockout and
inventory holding costs. The Laplace transform procedure is used to capture the stochastic
Supply Chain: Theory and Applications
250
properties of lead times. The optimal safety lead times, which are the difference between
planned and expected lead times are derived.
Another interesting single period model was proposed in (Chu et al., 1993) which deals with
a punctual fixed demand for a single finished product. The model gives optimal values of
the component planned lead times for such a one-level assembly system with random
component procurement times.
Wilhelm & Som (1998) studied a two-component assembly system using queuening models
and showed that a renewal process can be used to describe the end-item inventory level
evolution. The optimization of several component stocks is replaced by the optimization of
finished product stock. To perform this replacement, a simplified supply policy for
component ordering was introduced. Another multi-period model is proposed in (Gurnani
et al., 1996) for assembly systems with two types of components and the lead time
probability distributions are limited to two periods. In (Dolgui & Louly, 2002; Louly &
Dolgui, 2004), a similar one-level planning problem with random lead times and fixed
demand is studied, but for a dynamic multi-period case. The authors give a novel
mathematical formulation and propose a generalized Newsboy model which gives the
optimal solution under the assumption that the lead times of the different types of
components follows the same distribution probability, and the unit holding costs are
identical. In Louly et al. (2007) the authors generalize their studies of 2002 and 2004. They
present a more universal case, when the unit holding costs aren’t the same for all
components and the component lead times are not i.i.d. random variables.
4. MRP approach
4.1 The basic principles of MRP systems
The goal of MRP is to determine a replenishment schedule for a given time horizon. For
example, let’s consider the following bill of materials - BOM (see Fig. 2) for a finished
product. The needs for the finished product are given by the Master Production Schedule –
MPS (Fig. 3), and those for the components are deduced from BOM explosion (Dolgui et al.,
2005).
Let’s introduce the following notation:
)(iI inventory for the period i ,
)(iN net needs for the period i ,
)(iG gross needs for the period
i
,
)(iQ released orders for the period i ,
W
' planned lead time.
The available inventory
)1(I for the period 1 is given. For each subsequent need, the value
is calculated from the net needs of the previous period:
})1(,0{max)(
iNiI , (1)
net needs of the period
i are obtained as follows:
)()()( iIiGiN , (2)
The released order quantity:
Parameterization of MRP for Supply Planning Under Lead Time Uncertainties
251
)}(,0{max)(
W
' iNiQ . (3)
Finished good
Lead-time = 2
Component 3
Lead-time = 2
1
1
2
Component 2
Lead-time = 2
Component 1
Lead-time = 3
Quantity of
components
Figure 2. Bill of materials
Period 1 2 3 4 5 6 7 8 9 10
Gross need (MPS) 0 0 0 50 10 40 20 30 50 60
Available inventory 20 20 20 20 0 0 0 0 0 0
Net need -20
-20
-20 30 10 40 20 30 50 60
Level 0
Finished good
Lead time = 2
Manufacturing/order
0 30 10 40 20 30 50 60 0 0
Period 1 2 3 4 5 6 7 8
Gross need (MPS) 0 30 10 40 20 30 50 60
Available inventory 100 100 70 60 20 0 0 0
Net need -100 -70
-60
-20 0 30 50 60
Level 1
Component 1
Lead time = 3
Manufacturing/order
0 0 30 50 60 0 0 0
Period 1 2 3 4 5 6 7 8
Gross need (MPS) 0 60 20 80 40 60 100 120
Available inventory 140 140 80 60 0 0 0 0
Net need -140 -80 -60 20 40 60 100 120
Level 1
Component 2
Lead time = 2
Manufacturing/order 0 20 40 60 100 120 0 0
Quantity = 1
Quantity = 2
Quantity = 1
Figure 3. Master Production Schedule (MPS)
4.2 MRP under uncertainties
The main problem which often arises with MRP systems is derived from the uncertainties
(Nahmias, 1997; Vollmann et al., 1997) especially demand and lead time uncertainty (see Fig.
4).
Supply Chain: Theory and Applications
252
Period 1 2 3 4
5
Gross need
(MPS)
0 0 20 15 0
Available inventory 20 20 20 0 0
Net needs -20 -20 0 15 0
Level 0
Finished Good
Lead time = 2 +/- 1
Manufacturing/order 15
Lead-time
uncertaint
y
Demand
uncertainty
Figure 4. Input data uncertainties
The demand uncertainty means that the demand isn’t exactly known in advance and, so the
planned quantities for a period may be different from the actual demand. The lead time
uncertainty means that the actual lead time may be different from planned lead time, so an
order planned for a period may not arrive at the appropriate date.
As aforementioned, in literature, the majority of publications are devoted to the MRP
parameterization under customer demand uncertainties. As to random lead times, the
number of publications is modest in spite of their significant importance. The motivation of
this chapter is to contribute to the development of new efficient methods for MRP
parameterization under lead time uncertainties (see Fig. 5).
MRP parameters:
planned lead
times
Input
Data base:
- Characteristics of lead times
(distribution probabilities).
- Penalties (holding costs,
backlogging cost, etc.).
- Objective service level.
MRP software
tool
A mathematical model for the
calculation of optimal planned
lead times.
Figure 5. Proposed approach for MRP parameterization
Parameterization of MRP for Supply Planning Under Lead Time Uncertainties
253
The core of this approach is the calculation of planned (safety) lead times. When we increase
these parameters, the stocks increase also. However, stocks are expensive. In contrast, if the
planned lead times are underestimated, the risk of stockout and consequently the
backlogging cost increases along with decreasing the service level. The goal is to find the
planned lead time values which provide a trade-off between holding and backlogging costs
while minimizing the total cost under random actual lead times. In the next section, we
suggest a mathematical model for this optimization.
5. MRP parameterization
5.1 Mathematical model description
In the MRP approach, replenishment order dates, i.e. release dates, for each component are
calculated for a series of discrete time intervals (time buckets) based on the demand and
taking into account a fixed planned lead time: the release date is equal to the due date minus
the planned lead time. For the case of random actual lead times, in industry, a supply
reliability coefficient (t 1) is assigned to each supplier. The planned lead times for MRP are
calculated by multiplying the contractual lead time by the corresponding supplier reliability
coefficient. The choice of these coefficients (which give safety lead times) is based on past
experience. However, this approach is subjective and can be non optimal if we need to
minimize the total cost for an MRP system. The supplier reliability coefficients (safety lead
times and so planned lead times) can be calculated more precisely taking into account
inventory holding and backlogging costs, with a inventory control model. Such an inventory
control model must be simple (to be solvable), but representative, integrating all major
factors influencing the planned lead time calculation.
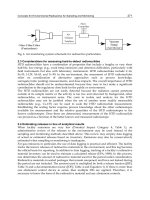
For component planned lead time calculation for assembly systems with several types of
components and random component lead times, we have introduced (Dolgui & Louly, 2002)
the following model and assumptions. This model will help us to solve the considered
problem of MRP parameterization, i.e. to find optimal planned lead times for components
when the actual lead times are random variables. Fig. 6 gives an illustration of the suggested
abstract model.
L
n
L
2
L
1
Component n
Com
p
onent 2
Component 1
b
Finished product
Assembl
y
Infinite capacit
y
h
1
h
2
h
n
Figure 6. Inventory control model for component planned lead time calculation
Supply Chain: Theory and Applications
254
For this model, we assume that the finished product demand per period is known and
constant as well as the assembly capacity is infinite. Several types of components are needed
to assembly one finished product. The unit holding cost per period for each type of
component
i
h and the unit backlogging cost
b
for the finished product are known. The
lead times
i
L
for orders made at different periods for the same type of component i are
independent and identically distributed discrete random variables. The distribution of
probabilities for the different types of components can be not identical. These distributions
are known, and their upper values are finite.
The finished products are delivered at the end of each period and unsatisfied demands are
backordered and have to be treated later (when sufficient numbers of components of each
type are in stock). The supply policy for components is Lot for Lot: one lot of each type of
component is ordered at the beginning of each period.
Because the supply policy is the Lot for Lot and the demand is considered as constant, the
same quantities of components are ordered at the beginning of each period. Thus, only
planned lead times are unknown parameters for this model. Hence, they are the decision
variables in our optimisation approach. The model considers random component lead times
and also the dependence among inventories of the different components suitable for
assembly systems (when there is a stockout of only one component, consequently, there is
no possibility to assemble the finished product).
To simplify the equations, without lost of generality, we assume that the finished product
demand is equal to one unit per period, and that one finished product is assembled from
one unit of each type of component.
Let’s use the following model notations:
f
1 function equal to 1 if f is true, and 0 otherwise,
n number of types of components used for the assembly of one product,
[.]E
mathematical expectation operator,
i
h unit holding cost for the component
i
per period,
b unit backlogging cost for the finished product per period,
k
reference of a period (period index),
i
L lead time of the components
i
(discrete random variable),
k
i
L lead time of the components i ordered at period k (discrete random variable),
i
u upper value of the lead time for components i (
ii
uL dd1 ; ni , ,2,1 );
i
ni
uu
,,1
max
,
k
i
N
number of orders for the component i that have not yet arrived at the end of the
period k ,
i
N steady state number of orders for the component
i
that have not yet arrived at the
end of a period,
X
vector of the decision variables ) ,,(
1 n
xx ,
Z
function equal to the maximum of
Z
and 0: )0,max(Z .
Parameterization of MRP for Supply Planning Under Lead Time Uncertainties
255
Note that:
i. Considering that the component ordered quantities are the same for all periods, the
planned lead time multiplied by the ordered quantity, which is equal to the finished
product demand, gives also the initial inventory for the corresponding component.
ii. The optimal planned lead times do not depend on the finished product demand (the
same values of optimal planned lead times will be obtained for different demand
amounts, if the demand is constant and other characteristics of the problem are fixed).
iii. Given the fact that the order quantities are constant, i.e. the same for all periods, the
crossing of orders does not complicate the problem.
iv. Taking into consideration the objective of this study – to calculate optimal planned lead
times for MRP controlled assembly systems under lead time uncertainties - the
assumptions on the fixed demand and infinite assembly capacity are necessary and
natural simplifications.
v. Taking into account the assumptions on the constant demand and infinite capacity of
the assembly system, we are in a Just in Time (JIT) environment, i.e. there is no stocking
of finished products.
vi. Considering that the component lead times cannot exceed
i
u ), ,2,1( ni
, the random
variables
k
i
N and
i
N can have only the following values: 0, 1, 2, …, 1
i
u .
vii. The orders are given at the beginning of each period and delivered components are
used at the ends of periods (so an order made at period k can be used at the end of the
same period k, if the actual lead time is equal to 1).
Let’s introduce the following additional notations:
)Pr()( jNjF
iN
i
d ,
n
xxxX , ,,
21
are decision variables, the value 0
i
x signifies that the component i is
ordered at the beginning of the target period (i.e. when assembly must be made),
¦
n
i
i
hbH
1
.
As shown in (Louly et al., 2007), the objective function and constraints for this multi-period
model for the optimization of planned lead –times can be formulated as follows:
),( NXC =
¦
n
i
iii
NExh
1
)( )(
¦
t
0
1
)( )(1
j
n
i
iN
jxFH
i
, (4)
subject to:
10 dd
ii
uxni ,,2,1, . (5)
The maximal value of component
i lead time is equal to
i
u , so only the previous
i
u -1
orders may not yet be received. Earlier orders have already arrived, therefore:
10 dd
ii
uN .
∑
1
1
1
!
u
j
jL
i
ju
i
N
, ni ,,1 , (6)