Sensors, Focus on Tactile, Force and Stress Sensors 2011 Part 14 pot
Bạn đang xem bản rút gọn của tài liệu. Xem và tải ngay bản đầy đủ của tài liệu tại đây (6.41 MB, 30 trang )
Compliant Tactile Sensors for High-Aspect-Ratio Form Metrology
381
microscopy (AFM) tips. Furthermore, in contrast to AFM probes we located the tip at
the bottom side of the cantilever. So, robust tips of heights ranging from 10 to 200 µm
could be realized while leaving the upper chip surface for a planar integration of the
strain gauge.
- The cantilever deflection was measured using a balanced Wheatstone bridge located
close to the cantilever clamping. Cantilever dimensions and bridge layout are displayed
in Fig. 3. The large contact pads were provided for die testing and calibration. During
the back-end processing of the probe head this area was used for the deposition of glue
for the fixing of the sensor to the steel finger. Electrical connection was realized via wire
bonds from the small pads on the sensor chip to a flexible circuit board glued onto the
steel finger.
Fig. 3. Schematic of probe head based on a tactile cantilever sensor with enlarged
representations of the probing tip and the Wheatstone bridge as well as the circuit diagram
of the bridge and a temperature sensing device.
Slender cantilevers of low stiffness as required for probing inside narrow and deep micro
holes generate only small strain values upon tip deflection. Therefore, a high gauge factor
and an optimum location of the gauge on the cantilever were necessary to meet the
sensitivity requirements. Simultaneously, temperature drift, susceptibility to ambient light,
power consumption, and noise had to be kept as low as possible. As a trade-off we designed
a full Wheatstone bridge of four p-type resistors of a sheet carrier concentration of
3 × 10
14
cm
-2
to obtain a bridge resistance of 2.5 kΩ for which we could expect a gauge factor
of K ≈ 80, a temperature drift of ∼ (1 – 2) × 10
-3
/K, noise of ∼ 1 µV in a bandwidth of 20 kHz
and a power consumption of 0.4 mW at U
0
= 1 V.
2.2 Vertical loading
Using the cantilever sensor in Fig. 3 as a tactile sensor three directions of force application to
the cantilever free end can be distinguished with respect to the cantilever axis: vertical,
lateral and axial loading. In the case of vertical loading, i. e. the normal loading case, a
Sensors, Focus on Tactile, Force and Stress Sensors
382
force F
z
acts onto the probing tip perpendicularly to the chip plane. It results in a deflection
of the cantilever of:
(
)
zzB
3
23
z
114
F
k
Fc
Ewh
l
=
−
=
ν
δ
(1)
with the plate modulus E/(1-
ν
2
) = 170 GPa of a (001) silicon cantilever aligned to the [110]
crystal direction and l, w and h as defined in Fig. 3. Plane strain is assumed. The cantilever
stiffness is denoted by k
z
. The widening of the cantilever at its clamped end (w
B
, l
B
cf. Fig. 3)
is taken into account by the factor
(
)
.1
3
1
B
2
BB
B
⎟
⎟
⎠
⎞
⎜
⎜
⎝
⎛
−
−
−=
w
w
l
lll
c
(2)
At the cantilever surface uniaxial strain is generated along the cantilever axis depending on
the tip deflection δ
z
, which has its maximum at the cantilever clamping amounting to:
z
BB
2
B
2
3
δε
×=
cw
w
l
h
(3)
Stiffness and strain values calculated for the given cantilever geometries (l = 1.5 – 5 mm,
w = 30 – 200 µm, h = 25 – 50 µm, w
B
= 100 – 200 µm, l
B
= 250 µm) using eqs. (1) to (3) were
compared with the data obtained by finite element modelling (FEM) using ANSYS 8.1. We
found an agreement within 2-3 % for the stiffness and 8-10 % for the strain.
Four resistors R
ij
(indices denote the numbers assigned to each resistor contact) are
connected into a full Wheatstone bridge (Fig. 3). Assuming for simplicity that each of the
four legs of the bridge, which are aligned either in parallel (longitudinal: R
14
and R
23
) or
perpendicularly (transversal: R
12
and R
34
) to the cantilever, is uniformly strained by
ε
B
we
observe resistance changes of almost identical absolute value but opposite sign. At a
constant voltage supply to the bridge of U
0
we find:
B
0
ε
Δ
K
U
U
= (4)
with the piezoresistive gauge factor K. Either an additional resistor or a diode is integrated
close to the strain-sensing Wheatstone bridge and can be connected via the contacts 5 and 6
for on-chip temperature sensing.
2.3 Lateral loading
In general, during scanning over a not ideally flat work piece surface the cantilever may be
deflected not only in vertical but also in lateral direction, i.e. the probing force acting on the
tip is a superposition of vertical and lateral contributions. A lateral force F
y
applied to the tip
caused e.g. by friction forces emerging during scanning the cantilever over a surface in the
direction perpendicular to the cantilever axis lead to a lateral cantilever deflection.
Simultaneously, a moment about the cantilever axis is exerted causing an additional tip
deflection. In total we obtain:
Compliant Tactile Sensors for High-Aspect-Ratio Form Metrology
383
(
)
()
y
y
y
3
2
t
torsion
3
23
y
12/14
F
k
F
Gwh
lhh
c
Ehw
l
=
⎥
⎥
⎦
⎤
⎢
⎢
⎣
⎡
+
+
−
=
ν
δ
(5)
with the shear modulus G = E/(1 + ν) = 80 GPa (
ν
= 0.064) and c
torsion
= 3.6 for h/w = 4 and
c
torsion
= 7.1 for h/w = 1 (Bao 2000). In the present case of slender cantilevers, i. e.
h . w . 0.02l and a tip height of h
t
# h the torsional contribution is more than two orders of
magnitude smaller than the lateral bending. This was confirmed by FEM. Non-uniform
uniaxial strain across the Wheatstone bridge is induced: At a lateral deflection δ
y
the
longitudinally oriented resistors (R
14
and R
23
) are strained at equal absolute value but at
opposite sign
y
2
B
4
3
δε
×=
l
w
while strain across the transversally oriented resistors (R
12
and R
34
) averages to zero. The
longitudinal resistors are located at ± w/2 from the neutral axis. Connecting both
longitudinal resistors into a half bridge (hb) we obtain an output signal of:
y
2
hb
0
4
3
2
1
δ
Δ
×=
⎟
⎟
⎠
⎞
⎜
⎜
⎝
⎛
l
w
K
U
U
(6)
2.4 Axial loading
Axial loading results from moving the cantilever with its free end against a fixed body.
Three modes of deflection of an axially loaded cantilever which have been implemented in
MEMS technology (Beyeler et al., 2008; Ruther et al. 2007; Samuel et al., 2006) are
schematically shown in Fig. 4 where cantilevers fixed to a support by clamping (left), a
hinge (middle) and a spring (right) are depicted. Due to its slender shape the first one is best
suited for probing the bottom surface of deep and narrow blind holes, e.g. through silicon
vias (TSV) for 3D interconnects. Under an axial load F
x
a cantilever beam is uniformly
compressed until buckling occurs, when F
x
exceeds a critical value:
12
3
2
c
Ewh
l
F
⎟
⎠
⎞
⎜
⎝
⎛
=
π
β
(7)
In this case a uniform rectangular cross section was assumed. The constant β depends on the
boundary conditions, i. e. β = 1/4 for a beam with one end clamped and the other free (type
I) and β = 1/(0.7)
2
for a beam with one end clamped and the other pinned (type II). In the
case of slight initial cantilever bending buckling occurs gradually as the load approaches F
c
.
Below F
c
the cantilever is uniformly compressed leading to a strain at the piezoresistive
bridge of:
x
x
B
δε
×=
Ewh
k
(8)
with the axial stiffness of the cantilever:
Sensors, Focus on Tactile, Force and Stress Sensors
384
l
Ewh
k =
x
(9)
For a 5-mm-long cantilever and a gauge factor of the piezoresistive bridge of 80 we find a
sensitivity of 16 mV/µm.
Fig. 4. Schematic of tactile sensing using axially loaded cantilevers.
2.5 Fabrication
Sensor prototypes were realized using a bulk micromachining process which is
schematically shown with a sectioned piece of the silicon chip in Fig. 5:
- An n-doped (100) silicon wafer (300 ± 3 µm) was thinned in a time-controlled process
using either deep reactive ion etching (DRIE, SF
6
/O
2
) at cryogenic temperature ( 75 °C
to (-95 °C) or wet anisotropical etching in TMAH (tetra methyl ammonium hydroxide,
20 %, 80 °C) solution through a mask of photo resist or thermal oxide, respectively.
Etching was stopped at a residual thickness corresponding to the desired cantilever
thickness plus the tip height (Fig. 5a). The standard deviation of the thickness measured
with the generated membranes was typically less than 1 %. An advantage of cryogenic
DRIE over anisotropic wet etching is the considerably higher etch rate of ~ 4 µm/min
vs. 0.7 µm for TMAH. Thus, the time consumed for this process step is drastically
reduced from ~6 h to ~1 h. Furthermore, a photo resist mask can be employed instead
of thermal oxide needed for TMAH etching.
- Subsequently, p-type stripes arranged in a square geometry were designed as the
resistor legs of a full Wheatstone bridge (Fig. 5a). They were realized by boron diffusion
from a spin-on silica emulsion source (Emulsitone Borofilm 100) or by boron
implantation. Contact formation to the p-type silicon was improved by an extra boron
diffusion/implantation dose in the corner regions of the bridge square (Fig. 5b). The
standard deviation of the measured resistivity about the target value was 4.1 % and
0.6 % for the diffused and implanted wafers, respectively. The doping profile was
measured during various stages of the process with monitor wafers using
electrochemical capacitance-voltage profiling (ECV). Subsequent to the final high-
temperature step we found a junction depth of 4.5 µm and a surface concentration of
1.5-3.0 × 10
18
cm
-3
which is a tradeoff to obtain a high piezoresistive coefficient around
π
44
≈ 1 GPa
-1
and a low temperature coefficient around 1 × 10
-3
K
-1
(Cho et al., 2006).
- A probing tip was generated at the cantilever bottom side by undercut etching of a
circular or square oxide (nitride) mask using either TMAH or KOH (Fig. 5c). In this case
Compliant Tactile Sensors for High-Aspect-Ratio Form Metrology
385
photolithography had to be performed within the backside-etched depression shown in
Figs. 5a and b. Its depth was determined by the desired tip height, i.e., it has a
maximum value of ~ 250 µm for the smallest tips. Using single exposure of positive
resist (Shipley, S1818) we realized squares of an edge length of ~ 70 µm as the smallest
structures showing deviations from the desired length of typically less then 10 %.
During anisotropic etching a micro pyramid with an octagonal base developed
underneath the mask with its angle of apex determined by the emerging sidewall facets.
We used TMAH (20 %, 80 °C) and KOH (45 %, 80 °C) to generate tip angles of ~ 90° and
~ 40°, respectively. SEM photographs of tips in the backside-etched groove before and
just after complete under etching of a square oxide mask using KOH (45 %, 80 °C) are
depicted in Figs. 6a and b, respectively.
Fig. 5. Schematic of the sensor fabrication process: Membrane etching (a), boron doping (a,
b), tip etching (c), metallization (d) and cantilever etching (e).
- After tip formation the wafer was oxidized and patterned for contact holes to the
Wheatstone bridge. Either a gold/chromium or an aluminum metallization was used
(Fig. 5d).
- Finally, the cantilever was released by either DRIE at cryogenic temperatures using
SF
6
/O
2
or anisotropic wet etching using KOH (30 %, 60 °C) (Fig. 5e). In both cases a
protection of the Au/Cr metallization was not necessary. In the case of DRIE we could
employ a photo resist mask and a CMOS compatible Al metallization while an oxide
mask and an Au/Cr metallization were used for the KOH process. Samples of the
cantilever sensor of 1.5-5 mm in length, 30-200 µm in width and 25-50 µm in height are
shown in Fig. 7.
Figure 8 shows a realized probe head comprising the cantilever sensor mounted on a steal
finger, a retractable plastic cover protecting the cantilever during transport and mounting
bracket.
Sensors, Focus on Tactile, Force and Stress Sensors
386
Fig. 6. SEM photographs of tips in the backside-etched groove before (a) and just after
complete under etching (b) of a square oxide mask using KOH (45 %, 80 °C).
Fig. 7. Samples of slender piezoresistive cantilever sensors with integrated probing tip.
Either DRIE at cryogenic temperatures (upper) or wet etching using KOH (lower) was
employed for the final release of the cantilevers.
Fig. 8. Probe head after back-end processing. A plastic cover serving as a protection of the
cantilever during transport and mounting into a scanning unit is retracted.
Compliant Tactile Sensors for High-Aspect-Ratio Form Metrology
387
3. Sensor performance
Realized sensors were calibrated using a nanonewton force testing setup (Behrens et al., 2003;
Peiner et al., 2007; Peiner et al., 2008). For this purpose the sensor dies were mounted into a
custom-made metal case. Electrical connection was provided using contact pins which were
pressed against the large contact pads shown in Fig. 3 serving as the counterparts for a
temporary, easily detachable connection. Temperature and relative humidity in the calibration
box were stabilized within 21.4 - 23.5 °C and 23 - 39 %, respectively. The output signal of the
full Wheatstone bridge operated at a supply voltage of U
0
= 1 V was connected to an
instrumentation amplifier (HBM, ML 10B) via a shielded cable. During a typical calibration
measurement the cantilever was incrementally moved with its tip against the weighing pan of
an electronic balance (Sartorius, SC 2). Simultaneously with the force measurement the output
signal ΔU of the integrated piezoresistive gauge was recorded. A calibration curve typically
comprised ~ 100 sample increments and was repeated ~ 500 × for each sensor device.
The complete setup was mounted on a platform comprising stabilizer pneumatic isolators
with automatic leveling for vibration damping to cancel ground vibrations and acoustic
noise. A shielded cable was used to protect the bridge output signal against electromagnetic
interference.
3.1 Vertical loading
The typically measured performance data of realized 5-mm-long silicon cantilever sensors
were listed in Table 2. Cantilevers show linear load-deflection characteristics in a range up
to 200 µm with a fracture limit exceeding 1.6 mm. For the stiffness we found ~ 12 N/m at a
repeatability of 2.5 %. The stiffness of the balance of > 10 kN/m is by far higher. Therefore, it
was not taken into account for the analysis of the cantilever stiffness. The main source for a
deviation from the design value was the cantilever height given by the etching in a time-
controlled process. Measurements across the wafer showed a typical variation of ~ 1 – 2 %
about the target height.
Parameter Value
Range
δ
max
200 µm @ FS, fracture limit: δ
z
> 1.6 mm, δ
y
> 0.3 mm
Stiffness 11.9 N/m @ repeatability of 2.5 %
Sensitivity S 0.25 µV/nm @ without amplification, repeatability of 1 %
Non-linearity 0.3 %FS @ 200 µm, 0.2 %FS @ 20 µm
Gauge factor K 76 ± 2
Switch-on delay
∼ 1 s
Temperature coefficient of R - 0. 2 %/K
Temperature drift 10 nm/K @ referred to vertical deflection
Light sensitivity 4-10 nm @ neon light: 100 µW/cm
2
, referred to vertical
deflection
Long-term stability
6 nm @ 70 h, ΔT < 1 K, referred to vertical deflection
Resolution
δ
min
1.8 nm @ f
max
=
1.6 kHz, f
min
= 0.003 Hz
1.3 nm @ f
max
= 800 Hz, f
min
= 0.003 Hz
0.6 nm @ f
max
= 100 Hz, f
min
= 0.003 Hz
Uncertainty (k = 2) 30 nm @ 1 µm
Table 2. Sensor performance (l = 5 mm, w = 200 µm, h = 50 µm, U
0
= 1 V, T = 21.4 – 23.5 °C,
rH = 23 – 39 %.)
Sensors, Focus on Tactile, Force and Stress Sensors
388
A deflection sensitivity of 0.25 µV/nm and a non-linearity of 0.3 %FS was measured at a
repeatability of 1 % in an exceptionally large deflection range up to 200 µm. Using eqs. (3)
and (4) we could calculate from these results a gauge factor of K = 76 ± 2 which is close to
the desired value of 80. The resistivity showed a temperature coefficient of - 0.2 %/K. A
stable read-out signal was achieved typically within one second after switch-on of the
voltage supply. The cross sensitivity against temperature and ambient light was below
10 nm at ΔT = 1 K and an illumination intensity of 100 µW/cm
2
, respectively. The input-
referred stability of the strain-gauge output signal amounted to 6 nm over 70 h at ΔT < 1 K.
Noise of the complete system including sensor and amplifier measured in a frequency range
from 10
-3
Hz to 20 kHz showed characteristic 1/f and white noise regimes below and above
~ 10 Hz, respectively (Peiner et al., 2007). White noise of 5.8 × 10
-11
mV
2
/Hz can be
calculated for a symmetric Wheatstone bridge of a resistance of 2.5 kΩ of each leg. This
corresponds very well to the measured value of 6 × 10
-11
mV
2
/Hz obtained as the difference
of measured total and amplifier noise in the white noise regime. 1/f noise comprises
contributions from both the Wheatstone bridge and the amplifier according to:
fU
N
U
f
U
/
2
2
A
2
0
2
H
⎟
⎟
⎠
⎞
⎜
⎜
⎝
⎛
+=
α
(10)
where
α
, N and
2
A
U denote the Hooge constant, the total number of carriers in a single
resistor, and the amplifier noise, respectively (Nesterov & Brand, 2006). With the bridge
supply voltage of 1 V and a total number of carriers of 2.5 × 10
9
within each resistor we
calculate a Hooge constant of
α
= 1.3 × 10
-6
.
Integration of 1/f noise and white noise (Johnson noise:
fU Δ/
2
J
) from f
1
to f
2
yields:
()
12
2
J
1
2
2
H
2
noise
Δ
ln ff
f
U
f
f
UU −+
⎟
⎟
⎠
⎞
⎜
⎜
⎝
⎛
=
(11)
With
()
2
102
H
mV108
−
×=U
,
()
Hz/mV105.1Δ/
2
102
J
−
×=fU
, f
1
= 10
-3
Hz and f
2
= 1.6 kHz we
we find
μV5.0
2
noise
=U
, which at a sensitivity of 0.25 µV/nm corresponds to a resolution
of 2 nm.
A high sampling rate is required for scanning at high levels of speed (> 1 mm/s) and lateral
resolution (< 1 µm), i.e. the ratio of scanning speed to upper cutoff frequency should be on
one hand considerably lower than the minimum lateral structure width which has to be
resolved. On the other hand, however, for nanometer vertical resolution high-frequency
noise has to be cancelled by reducing the upper cutoff frequency. As a tradeoff we selected
an upper cutoff frequency of 100 Hz and reduced the probing speed to around 10 µm/s, if
nanometer vertical resolution and sub-micrometer lateral resolution were required. If a
lower vertical resolution around 10 nm was acceptable we could operate the amplifier at
19.2 kHz and increase the probing speed to around 1 mm/s.
We tested the vertical and lateral scanning resolution using a photolithography mask
comprising 60-nm-high and 1-to-10-µm-wide stripes of chromium on a glass substrate.
Scanning of the entire test area of 310 – 100 µm
2
in the fast modus, i.e. within < 3 min reveals
all stripes clearly resolved. High-resolution scans were then performed with the 1-, 2-, and
Compliant Tactile Sensors for High-Aspect-Ratio Form Metrology
389
3-µm-wide stripes at a speed of 15 µm/s and an upper cutoff frequency of 100 Hz.
According to the noise analysis we can expect lateral and vertical resolutions of 0.15 µm and
0.5 nm, respectively. Measured stripe heights and widths are summarized in Table 3
showing deviations from the nominal height and width of less than 16 % and 6 %,
respectively. The measured stripe width corresponds to the distance between the raising
and falling flanks at 90 % of the height. The variances measured for the heights of 1.6 to
2.5 nm are higher than expected. They can be assigned to a 50 Hz interference due to not
perfect shielding of the signal transmission. Measurement uncertainty was determined
within the deflection range of 0.3 - 10 µm using a depth setting standard (EN 48200). We
found a value of 30 nm (k = 2) for a deflection of 1 µm. These results confirm the potential of
the described slender piezoresistive cantilever sensor for contour and roughness
measurements of structured surfaces at sub-micron lateral and nanometer vertical
resolutions.
nominal stripe width (µm) measured stripe width (µm) measured stripe height (nm)
1 1.06 ± 0.01 51.8 ± 1.9
2 1.96 ± 0.01 53.2 ± 2.5
3 3.03 ± 0.01 50.7 ± 1.6
Table 3. Scanning across Cr stripes on a glass carrier using a slender cantilever sensor
(l = 3 mm, w = 100 µm, w = 50 µm, U
0
= 1V, scanning speed = 15 µm/s, probing
force = 80 µN, f
2
= 100 Hz).
3.2 Lateral loading
We investigated the behaviour of a cantilever of uniform cross section of l = 5 mm,
w = 200 µm, and h = 40 µm under combined vertical and lateral loading. Combining eqs. (4)
and (6) we find a ratio of lateral-to-vertical sensitivity of w/(4h) = 1.25. Measurements were
performed of the output signals of the strain gauge resistors under tilted loading conditions,
i.e. by moving the tip against a flat work piece inclined by - 30° and 45° about an axis
parallel to the cantilever axis. We find values of 0.84-0.93 for the ratio of lateral-to-vertical
sensitivity which in fair agreement with the expected value of 1.25. Thus, vertical and lateral
signals can be decoupled by analyzing the responses of all four resistors in the conventional
full bridge arrangement and the longitudinal resistors alone connected into a half bridge,
respectively.
3.3 Axial loading
Moving a cantilever with its free end axially against a fixed body can lead to three different
stages of deformation as schematically displayed in Fig. 9a. Initially, it is uniformly
compressed. After exceeding a critical load F
c
(eq. (7)) buckling occurs which may be either
of type I or II depending on whether the cantilever free end can move or is pinned on the
probed surface. Axial loading tests were performed with cantilever sensors below and
above the critical load for buckling F
c
. The photographs in Fig. 9b to d show an axially
loaded 5-mm-long cantilever at the initial surface contact (b) and at axial displacements of
δ
x
= 2 µm and δ
x
= 80 µm, respectively. In Fig. 9d the type-II buckling form of a beam is
exhibited which typically occurs under the boundary conditions of the cantilever of one end
clamped and the other pinned.
Sensors, Focus on Tactile, Force and Stress Sensors
390
Fig. 9. Schematic (a) and photographs of an axially loaded 5-mm-long cantilever (b-d) at
different stages of axial displacement.
The sensor response measured with the cantilever depicted in Figs. 9b-d during axial
loading is shown in Fig. 10a where the sensor signal is displayed in dependence on the axial
displacement of the cantilever moved against a fixed body. Two probing speeds were
selected: 0.25 and 8 µm/s. Up to a maximum displacement of 40 µm an almost linear
increase of the output signal amplitude with δ
x
is observed at 0.25 µm/s with a buckling
form of type I (Fig. 9b). At δ
x
. 50 µm the signal drastically increased corresponding to the
transition from type-I to type-II buckling (Fig. 9d). At a probing speed of 8 µm/s this
transition occurred much earlier, i. e. at an axial displacement between 10 and 20 µm
indicating the dynamic-loading effect. The sensitivities of ~ 0.5 mV/µm and ~ 4 mV/µm
observed under the conditions of type-I and type-II buckling, respectively, are lower than
the sensitivity of 16 mV/µm expected for uniform compression.
Fig. 10. Signal of an axially loaded 5-mm-long cantilever at different levels of maximum
displacement (a) and at high-speed loading at inclination angles of ± 15° (b)
Compliant Tactile Sensors for High-Aspect-Ratio Form Metrology
391
In Fig. 10b the sensor response on high-speed axial probing (2 mm/s) against a fixed body at
a maximum displacement of 3 µm and an inclination angle of ± 15° is shown. Type-I
buckling is observed in both cases with positive and negative signs of signal change
indicating compressive and tensile strain, respectively, to the Wheatstone bridge. After an
initial sharp increase the signals rapidly decayed towards constant amplitudes.
Finally, axial loading tests below F
c
were performed using the nanonewton force testing
setup described above. Under these conditions the balance stiffness is much less than the
axial cantilever stiffness k
x
calculated using the cantilever dimensions and eq. (9). We find
values of typically > 100 kN/m. Therefore, the balance stiffness had to be considered when
the measured load-deflection curves were analyzed.
Parameter Value
Vertical sensitivity S
z
0.1953 ± 0.0008 µV/nm @ without amplification
Axial sensitivity S
x
11.15 µV/nm @ without amplification
8.5 µV/nm @ calculated using eqs. (4) and (8)
Average residual from linearity ± 5 µV @ 0.7 mV FS
Stiffness k
z
16.33 ± 0.04 N/m
Stiffness k
x
261.6 kN/m @ calculated using eq. (9)
Axial deflection before buckling 1.2 µm @ calculated using k
x
and eq. (8)
Fracture limit 580 ± 58 µm @ vertical deflection
300 ± 30 µm @ lateral deflection
260 ± 26 µm @ axial deflection
Table 4. Sensor performance (l = 3 mm, w = 100 µm, U
0
= 1V, T = 22.0 – 22.1 °C, rH = 40.1 –
41.5 %.)
In Table 4 the results obtained from the calibration of a slender cantilever sensor are
summarized. Vertical stiffness k
z
and sensitivity S
z
were measured and analyzed using
eqs. (1) to (5) yielding a cantilever thickness of h = 46.2 µm and a gauge factor of K = 25.4.
Under axial loading we observed a stiffness of 11.46 kN/m which is much less than the axial
cantilever stiffness k
x
= 261.6 kN/m calculated using eq. (9), i. e. it nearly corresponds to the
balance stiffness. For the axial sensitivity we measured a value of 0.488 µV/nm which had to
be corrected by multiplying with the ratio of measured stiffness to k
x
yielding
S
x
= 11.15 µV/nm. Using eqs. (4) and (8) we obtain a axial sensitivity of S
x
= 8.5 µV/nm
which is in fair agreement with the measurement.
4. Form measurement
Silicon wafers patterned by deep reactive ion etching (DRIE) and spray holes manufactured
using electro discharge machining (EDM) were used as artefacts of form and roughness
measurements using the described slender cantilever sensor.
4.1 Micro sac hole
The results of the previous chapter show that a front-side loaded slender cantilever can be
used to measure the depth of a micro sac hole. The highest sensitivity occured at uniform
compression but even at F > F
c
we observed values around 1 µV/nm leading to sub
nanometer resolution. We checked the measurement uncertainty by repeatedly measuring
the height Δh of a step fabricated on a silicon wafer using DRIE. The results are displayed in
Sensors, Focus on Tactile, Force and Stress Sensors
392
Fig. 11 where the measured values of the step height are plotted. A typical trace of the
sensor signal in dependence on axial cantilever position is shown in the inset. The contact
position x
0
was defined as the position where the signal exceeded the average zero signal
(offset voltage) by the fivefold of its standard deviation. For the step we found a mean value
of 252.407µm at a standard deviation of σ = 82 nm.
Fig. 11. Step height measured with a DRIE patterned silicon wafer using an axially loaded
cantilever.
4.2 Injector nozzle
VCO (valve covered orifice) direct injection (DI) Diesel nozzles with six spray holes of 110 –
170 µm in diameter fabricated by (EDM) were investigated using realized prototype sensors
to check the capability of slender piezoresistive cantilevers for in-hole form and roughness
measurements. For these experiments we used 1.5-mm-long, 30-µm-wide, and 36-to-41-µm
high cantilever sensors with 50-µm-high tips of a radius of curvature of 1.5 µm and a cone
angle of 40°. Calibration of the sensors yielded a vertical sensitivity of
ΔU/δ
z
= 0.25 - 0.31 µV/nm and a vertical stiffness of k
z
= 19.2 - 29.1 N/m.
A photograph and a schematic of the measurement setup are depicted in Fig. 12. The
cantilever sensor with the piezoresistive Wheatstone bridge was connected via Au wire
bonding to a printed circuit board and then via unshielded cables to an instrumentation
amplifier (HBM ML 10B). This experimental probe head was then mounted on a 2D piezo
positioning stage featuring a travel range of 800 µm at sub-nanometer resolution (P-628.2CD
with digital piezo controller PI 710, Physik Instrumente, Germany) which was fixed for
rough positioning to an x-/y-/z-table. The nozzle was arranged on a rotating/tilting stage.
Before starting the scanning process the cantilever and hole axes were carefully adjusted.
The schematic in Fig. 13 shows the movement of a cantilever sensor along the inner contour
of a spray hole. Before moving into the hole the cantilever had to be carefully aligned to the
Compliant Tactile Sensors for High-Aspect-Ratio Form Metrology
393
hole axis. Digital optical micrographs of a VCO nozzle and a slender cantilever into one the
six spray holes are depicted in Fig. 14.
Fig. 12. Photograph (left) and schematic (right) of a setup for surface scanning inside spray
holes of DI nozzles.
Fig. 13. Schematic of a slender cantilever sensor during scanning along the inner surface
profile of deep narrow micro hole.
Fig. 14. Optical micrographs of a VCO Diesel injector nozzle with a slender cantilever sensor
probing inside a spray hole.
Sensors, Focus on Tactile, Force and Stress Sensors
394
Fig. 15 shows the complete inner-surface profile of the spray hole measured using a slender
cantilever sensor. The scans performed at a constant speed of 2 – 200 µm/s were started at
the inner hole edge, i.e. at the entry of fuel flow. A step of 50 µm in height corresponding to
the tip height was measured during the initial scanning stage which can be assigned to the
transition from shaft contact at the beginning of the scan to tip contact (outer left schematic).
Then the tip touched the injector wall with its side facet and was moved along the hole edge
until the hole wall was reached (inner left schematic). Linear slopes of 30° and 23° appeared
at the rising and the trailing flanks, respectively, which are close to the half of the tip angle.
Thus both the rising and the trailing flanks of the profiles represent superpositions of the
shapes of the tip and the hole edge, respectively.
Regular probing conditions were achieved when the inlet edge of the hole was reached
(inner right schematic) and the tip is moved further (outer right schematic). The profile in
Fig. 15 corresponds to a not optimal form of a micro hole by EDM indicating a neck at the
hole inlet. Necking is related to the loss of erosion particles occurring at the end of the
drilling operation, leading to a constricted diameter of the hole at the inlet (Diver et al.,
2004). For the surface roughness we found values of 0.4-0.8 µm which is a typical range for
micro holes fabricated by EDM (Li et al., 2007; Cusanelli et al., 2007; Diver et al., 2004).
Abrasive flow machining (AFM) can be used subsequent to the EDM process to improve
surface finish and chamfer radius (Jung et al., 2008).
Fig. 15. Typical surface profile measured by scanning within a spray hole of a VCO Diesel
injector nozzle using a slender cantilever sensor (lower). The schematics represent the
different contact scenarios of the probe about the inlet edge.
In Fig. 16a the profiles from subsequent in-hole scans along identical traces are shown
revealing good agreement as indicated by the occurrence of characteristic signatures at
identical positions. The profiles provide information on roughness and waviness of the
profiles being a measure of the quality of tool and the machine, respectively. Exemplarily,
roughness parameters and waviness profile were determined from one the measured
profiles according to ISO 4287 and displayed in Table 5 and Fig. 16b, respectively.
Compliant Tactile Sensors for High-Aspect-Ratio Form Metrology
395
Parameter Value
R
p
1859.27 nm
R
V
2716.97 nm
R
max
4692.09 nm
R
z
4576.24 nm
R
a
637.08 nm
R
q
744.48 nm
R
c
1778.09 nm
R
Sm
16.72 µm
R
Δq
0.4318
R
sk
-0.321
R
ku
2.782
R
t
4460.39 nm
Table 5. Roughness parameters according to ISO 4287 extracted from the profile of the inner-
wall surface of a VCO nozzle spray hole displayed in Fig. 14.
Fig. 16. Surface profiles measured repeatedly along the same trace within a spray hole of a
VCO Diesel injector nozzle (a) and waviness profile calculated according to ISO 4287 (b).
Scanning measurements within spray holes were repeated using different sensors at various
scanning speeds (2 – 200 µm/s) and probing forces. We found good agreement of the
signatures in the profiles. Furthermore, the roughness values 0.80, 0.73, 0.76 and 0.74 µm
determined at probing speeds of 2, 20, 100, and 200 µm/s over a scan distance of 300 µm did
not show a dependence on probing speed. We conclude that the described piezoresistive
cantilever sensors have the potential for fast and non-destructive contour and roughness
measurement within spray holes.
Sensors, Focus on Tactile, Force and Stress Sensors
396
5. Conclusion
Construction, fabrication and testing of slender piezoresistive cantilever probes were
addressed which were designed for tactile shape and roughness measurements with high-
aspect-ratio micro components. In the normal cantilever-bending mode the sensor could be
operated within an exceptionally large deflection range (hundreds of µm) at high scanning
speeds (> 1 mm/s) and low probing forces (< 100 µN). Vertical and lateral resolution
amounted to ~ 10 nm and ~ 1 µm, respectively which fulfils the requirements of form and
roughness measurements with machined surfaces. Cross sensitivity vs. temperature and
ambient light was typically less than 10 nm at measurement conditions of temperature and
light intensity variations of 1 K and 0.1 mW/cm
2
, respectively. Sensor response on axial
loading could be used for probing the bottom of deep and narrow sac holes. In this case
cantilever buckling was normally observed which was monitored by the bridge output to
measure the structure heights of 3D-patterned silicon. For the first time form and roughness
measurement inside spray holes of injector nozzles could be demonstrated with not sectioned
holes. Using tailored prototypes of slender piezoresistive cantilever sensors good
reproducibility was obtained at different scanning speeds and loading forces. We could
demonstrate the feasibility of slender piezoresistive cantilever sensors for fast, non-destructive
and high-performance form and roughness measurements with deep and narrow micro holes.
6. Acknowledgements
The author is grateful to the valuable technical assistance by Nadine Beckmann, Doris
Rümmler, Julian Kähler and Stefan Kahmann. This work was supported in part by the
German Federal Ministry of Education and Research (BMBF) in the framework of the
collaborative project “Prüfung und Bewertung geometrischer Merkmale in der
Mikrosystemtechnik (µgeoMess)” within the cluster MSTPrüf under no. 16SV1944.
7. References
Anantharamaiah, N.; Vahedi Tafreshi, H. & Pourdeyhimi, B. (2007). A simple expression for
predicting the inlet roundness of micro-nozzles. J. Micromech. Microeng., Vol. 17,
N31–N39
Bae, C; Yu, J.; Kang, J.; Kong,J. & Lee, K O. (2002). Effect of Nozzle Geometry on the
Common-Rail Diesel Spray. SAE Techn. Pap. Ser. 2002-01-1625
Bao, M H. (2000). Micro Mechanical Transducers, Elsevier, ISBN 0-444-50558-X, Amsterdam
Baron, N.; Passave, J.; Guichardaz, B. & Cabodevila, G. (2008). Investigations of
development process of high hollow bevelled microneedles using a combination of
ICP RIE and dicing saw. Microsyst. Technol. DOI 10.1007/s00542-008-0596-1
Bauza, M. B.; Hocken, R. J.; Smith, S. T. & Woody, S. C. (2005). Development of a virtual
probe tip with an application to high aspect ratio microscale features. Rev. Sci.
Instrum., Vol. 76, 095112
Behrens, I.; Doering, L. & Peiner, E. (2003). Piezoresistive cantilever as portable micro force
calibration standard. J. Micromech. Microeng., Vol. 13, 1279-1288
Beyeler, F.; Muntwyler, S.; Nagy, Z.; Graetzel, C.; Moser, M; & Nelson, B. J. (2008). Design
and calibration of a MEMS sensor for measuring the force and torque acting on a
magnetic microrobot. J. Micromech. Microeng. Vol. 18, 025004 (7pp)
Compliant Tactile Sensors for High-Aspect-Ratio Form Metrology
397
Bos, E. J. C. ; Heldens, R. W. P.; Delbressine, F. L. M.; Schellekens, P. H. J. & Dietzel, A.
(2007) Compensation of the anisotropic behavior of single crystalline silicon in a 3D
tactile sensor. Sens. Actuat. A , Vol.134, 374–381
Bos, E. J. C.; Delbressine, F.L.M. & Haitjema, H. (2004). High-Accuracy CMM Metrology for
Micro Systems, Proceedings of 8th International Symposium on Measurement and
Quality Control in Production, ISMQ2004, pp. 511-522, Erlangen, Germany, October,
2004, VDI, Düsseldorf, Germany, No. 1860
Cho, C. H.; Jaeger, R. C. & Suhling, J. C. (2006). Experimental Characterization of the
Temperature Dependence of the Piezeresistive Coefficients of Silicon, Proceedings of.
ITherm 2006, pp. 928–935, San Diego, CA , May, 2006
Choudhury, A.; Hesketh, P. J.; Thundat, T. G.; Hu, Z. & Vujanic, R. (2007). Design and
Testing of Single and Double Sided Cantilevers for Chemical Sensing”, Proceedings
of IEEE Sensors 2007 Conf., pp. 1432-143, Atlanta, GA, October, 2007
Cusanelli, G.; Minello, M.; Torchia, F.; Ammann, W. & Grize, P. E. (2007). Properties of Micro-
Holes for Nozzle by Micro-EDM, Proceedings of 15th Intern. Symp. Electromachining
(ISEM XV), pp. 241-245, Pittsburgh, PA, April, 2007, ISBN (13): 978-0-9794977-0-4
Diver, C.; Atkinson, J.; Helml, H. J. & Li, L. (2004). Micro-EDM drilling of tapered holes for
industrial applications. J. Mater. Process. Technol., Vol. 149, 296–303
Engelke, R.; Ahrens, G.; Arndt-Staufenbiehl, N.; Kopetz, S.; Wiesauer, K.; Löchel, B.;
Schröder, H.; Kastner, J.; Neyer, A.; Stifter, D. & Grützner, G. (2007). Investigations
on possibilities of inline inspection of high aspect ratio microstructures. Microsyst.
Technol., 13, Vol. 319–325
Hon, R.; Lee, S. W. R.; Zhang, S. X. & Wong; C. K. (2005). Multi-Stack Flip Chip 3D Packaging
with Copper Plated Through-Silicon Vertical Interconnection, Proceedings of 7th
Electron. Packaging Technol. Conf., (EPTC 2005), Vol. 2, pp. 384-389, Singapore,
December, 2005
Jung, J W.; Ko, S. H.; Jeong, Y. H.; Min, B K. & Lee, S. J. (2007). Estimation of Material
Removal Volume of a Micro-EDM Drilled Hole Using Discharge Pulse Monitoring.
Int. J. Precision Eng. Manufact. Vol. 8, 45-49
Jung, D.; Wang, W. L.; Knafl, A.; Jacobs, T. J.; Hu, S. J. & Assanis, D. N. (2008). Experimental
investigation of abrasive flow machining effects on injector nozzle geometries,
engine performance, and emissions in a DI Diesel engine. Intern. J. Automotive
Technol., Vol. 9, No. 1, 9-15
Kao, C C. & Shih, A. J. (2007). Form measurements of micro-holes. Meas. Sci. Technol., Vol.
18, 3603–3611
Kiuchi, M.; Matsui; S. & Isono, Y. (2008) The piezoresistance effect of FIB-deposited carbon
nanowires under severe strain. J. Micromech. Microeng., Vol, 18, 065011 (10pp).
Krüger, O.; Schöne, G.; Wernicke, T.; John, W.; Würfl, J. & Tränkle, G. (2007). UV laser drilling
of SiC for semiconductor device fabrication. J. Phys.: Conf. Ser., Vol. 59, 740–744
Küng, A.; Meli, F. & Thalmann, R. (2007). Ultraprecision micro-CMM using a low force 3D
touch probe. Meas. Sci. Technol., Vol. 18, 319–327
Lebrasseur, E.; Pourciel, J. P.; Bourouina, T.; Masuzawa, T. & Fujita, H. (2002). A new
characterization tool for vertical profile measurement of high-aspect-ratio
microstructures. J. Micromech. Microeng., Vol. 12, 280-285
Li, X.; Wang, J. & Li W. (2007). Current State and Prospect of Micro-Machining, Proceedings of
IEEE Intern. Conf. Automation and Logistics, pp. 1414-1419, Jinan, China, August, 2007
Muralikrishnan, B.; Stone, J. A. & Stoup, J. R. (2006). Fiber deflection probe for small hole
metrology.
Precision Engineering Vol. 30, 154-164.
Sensors, Focus on Tactile, Force and Stress Sensors
398
Mathieu, F.; Saya, D.; Bergaud, C. & Nicu, L. (2007). Parallel Detection of Si-Based
Microcantilevers Resonant Frequencies Using Piezoresistive Signals Downmixing
Scheme. IEEE Sens. J., Vol. 7, 172–178.
Nesterov, V. & Brand, U. (2006). Modelling and investigation of the mechanical and
electrical characteristics of the silicon 3D-boss microprobe for force and deflection
measurements. J. Micromech. Microeng., Vol. 16, 1116–1127
Peggs, G.; Lewis A. & Oldfield S. (1999). Design for a compact high-accuracy CMM. CIRP
Annals - Manufacturing Technology, Vol. 48, No. 1, 417-420
Peiner, E.; Balke, M. & Doering, L. (2007). Slender Tactile Sensor for High-Aspect-Ratio
Micro Metrology, pp. 760-763, Proceedings of IEEE Sensors 2007 Conf., Atlanta,
GA, October, 2007
Peiner, E.; Doering, L. & Nesterov, V. (2004). Tactile Probes for High Aspect Ratio
Micrometrology. mstnews, No. 02/2004, 41,42
Peiner, E.; Doering, L.; Balke, M. & Christ A. (2008). Silicon Cantilever Sensor for Micro-
/Nanoscale Dimension and Force Metrology. Microsyst. Technol., Vol. 14, 441–451
Pourciel, J B.; Jalabert, L. & Masuzawa, T. (2003). Profile and Surface Measurement Tool for
High Aspect-Ratio Microstructures. JSME Intern. J. Series C, Vol. 46, 916-922
Rauh, W. (2005). Präzision mit gläserner Faser. Mikroproduktion, No. 1/2005, 1-6, Carl
Hanser, München, Germany
Ruther, P.; Spinner, S.; Cornils, M. & Paul, O (2007). Cantilever-based tactile sensor with
improved sensitivity for dimensional metrology of deep narrow drillings.
Proceedings of 14th Intern. Conf. Solid-State Sensors, Actuators and Microsystems,
(Transducers & Eurosensors ’07), pp. 1469-1472, Lyon, France, June, 2007
Samuel, B. A.; Desai, A. V. & Haque, M. A. (2006). Design and modeling of a MEMS pico-
Newton loading/sensing device. Sens. Actuators A, Vol. 127, 155–162
Seitz, K. (2005). Qualitätsprüfung in der Mikrosystemtechnik. inno, Vol. 29, No. 03/05, 19,
IVAM, Dortmund, Germany
Seo, T I ; Kim, D W.; Cho, M W. & Lee, E S. (2008). A Study on the Characteristics of
Micro Deep Hole Machining Processes. Key Engineering Materials, Vols. 364-366,
566-571, Trans Tech Publications, Switzerland
Simon, M.; Reznikova, E.; Nazmov, V. & Last, A. (2008). Measurement of side walls of high
aspect ratio microstructures. Microsyst. Technol. DOI 10.1007/s00542-008-0618-z
Tibrewala, A.; Phataralaoha, A.; & Büttgenbach, S. (2008). Analysis of full and cross-shaped
boss membranes with piezoresistors in transversal strain configuration. J.
Micromech. Microeng., Vol. 18, 055001 (6pp)
UMAP (2008) Vision System, Catalog No. E4257-361, Mitutoyo Corporation, Japan.
Available:
Vora, K. D.; Shew, B Y.; Lochel, B.; Harvey, E. C.; Hayes, J. P.& Peele, A. G. (2008). Sidewall slopes
and roughness of SU-8 HARMST. Microsyst. Technol., DOI 10.1007/s00542-007-0506-y
Weckenmann, A.; Peggs, G. & Hoffmann, J. (2006). Probing systems for dimensional micro-
and nano-metrology. Meas. Sci. Technol., Vol. 17, 504–509
Woody, S. C. & Bauza, M. B. (2007). High Aspect Ratio Sensors with an application
Application to microscale Microscale metrologyMetrology, Proc. 2007 NCSL Intern.
Workshop & Symp. on Metrology’s Impact on Products and Services. Available:
Yamamoto, M.; Takeuchi, H. & Aoki, S. (2000). Dimensional measurement of high aspect
ratio micro structures with a resonating micro cantilever probe. Microsyst. Technol.,
Vol. 6, 179-83
22
Tactile Sensor Without Wire and
Sensing Element in the Tactile Region
using New Rubber Material
Yo Kato and Toshiharu Mukai
Bio-Mimetic Control Research Center, RIKEN
Japan
1. Introduction
Recently the idea of covering a robot's surface with a ‘skin’ of soft tactile sensors has
attracted the attention of researchers, and some human-interactive robots covered with such
sensors have actually been made (Tajima et al., 2002; Kanda et al., 2002). However, most
conventional tactile sensors need a large number of sensing elements and wires because
every detection point needs one sensing element and wiring to an A/D converter. There are
some studies aiming to overcome this wiring problem by using 2D surface communication
or wireless communication (Shinoda & Oasa, 2000; Ohmura et al., 2006), but these are very
complicated and expensive solutions.
We have developed a soft areal tactile sensor made of pressure-sensitive conductive rubber
without any wire or sensing element in the tactile region. The distribution of applied pressure,
relating to the resistivity change of the pressure-sensitive rubber, can be estimated by using
inverse problem theory. We employed electrical impedance tomography (EIT) to reconstruct
the resistivity distribution from information obtained by electrodes placed around the region.
EIT is an established method in medical and industrial applications (Holder, 2005), but it has
not been applied to tactile sensors until recently. Nagakubo and Alirezaei proposed a tactile
sensor using an EIT algorithm operating with commonly used EIT software and
commercially available pressure-sensitive rubber (Nagakubo & Kuniyoshi, 2006; Alirezaei et
al., 2006). Their method is based on the same principle as ours, but their pressure-sensitive
conductive rubber is not suitable for this method. We have newly developed special
pressure-sensitive conductive rubber for this sensor, and adopted a new computation
technique suitable for this rubber. We have also developed a prototype sensor system that
can measure pressure distribution in real-time.
In this paper, we describe basic structure and computation technique of our sensor system,
as well as experimental results obtained using our prototype sensor system.
2. Device design
2.1 Basic structure
We have developed, in collaboration with Tokai rubber industries, Ltd., a new type of
pressure-sensitive conductive rubber, the resistivity of which increases when pressure is
Sensors, Focus on Tactile, Force and Stress Sensors
400
applied, unlike ordinary conductive rubber. This new rubber is suitable for a tactile sensor
using EIT, because its initial resistivity can be set low, which leads to the accurate
reconstruction of pressure distribution from voltage measurements with relatively low
noise. Fig. 1 shows the dimensions of the pressure-sensitive conductive rubber that we used
in experiments. We formed the rubber into a 1-mm-thick, 195-mm-diameter disc and put 16
electrodes around the disc by vulcanization gluing at regular intervals.
This rubber also has the important feature that its resistivity increases in either case where
compressive or tensile strain is applied to it. Fig. 2 shows the relationship between the
distortion factor and the resistivity of the rubber. The filled circles are for the compressive
case, and the open triangles are for the tensile case. We confirmed that the resistivity
increases regardless of the type of strain (i.e. any type of stress).
Fig. 1. Pressure-sensitive conductive rubber sheet with 16 electrodes
Fig. 2. Resistance changes depends on a) compressive, and b) tensile strains
2.2 Measurement system
The processing of our tactile sensor consists of two steps. The first step is the measurement
of conductivities using the 16 electrodes placed around the rubber sheet at even intervals.
Tactile Sensor Without Wire and Sensing Element in the Tactile Region using New Rubber Material
401
An AC voltage is applied, and resistance is calculated using the four-electrode method from
the differential voltage between neighboring electrodes, for every possible combination (Fig.
3). In the figure, alternating voltage is supplied between the first and second electrodes and
the differential voltage is measured between the 10th and 11th electrodes. The number of
possible combinations is 208. However, the number of the independent measured data is
actually 104, because the measurements when the supply and the measuring electrode pairs
are symmetrically positioned are not independent.
This basic measurement procedure of EIT was developed at Sheffield University (In the
original method, current source is used, but we use voltage source instead, for circuit
simplicity). The main advantages of this procedure are that it is relatively precise and easy.
We can measure at quite a high rate by switching measurement electrodes with a higher
frequency AC voltage. In the experiment, we used a 3.685kHz, 4.5 V
pp
AC voltage. This
frequency was determined from the conversion speed of an A/D converter in our sensor
controller, dsPIC board, described below.
Fig. 3. Conductivity measurement method
2.3 Reconstruction algorithm
In the second step, the distribution of resistivity change is reconstructed from the
measurements. This distribution also indicates the pressure distribution because the
resistivity change is caused by the change of the pressure applied to the sheet. To get a
reconstruction image, we use a sensitivity matrix (Kotre, 1989) that is the Jacobian matrix
between V and ρ.
δ
V
(
m,n
)
=
S
m,n,x,y
δ
ρ
(
x,y
)
(1)
Here, m and n indicate the position of the applying electrode pair and the measuring
electrode pair, respectively, and x and y indicate the position coordinates of the discrete
domain in the rubber plate.
The sensitivity matrix can be obtained by numerically solving a forward problem. Then
solving (1) by using a least squares (Lawson & Hanson, 1974) or generalized inverse matrix
method, the distribution of resistivity change
δρ
(x,y) is obtained. However this is inverse
problem. The inverse solution is apt to become instable and, in our case, the ordinary least
squares method does not work because of this instability. To overcome this problem, inverse
problem theory suggests various normalization methods. We employed the positive value
constraint, because we can assume that the resistivity change is always positive thanks to
our new pressure-sensitive conductive rubber, unlike ordinary EIT method that uses the
regularization technique.
Sensors, Focus on Tactile, Force and Stress Sensors
402
Equation (2) shows the least squares method with a non-negative constraint. In the next
section, we show that the constraint successfully stabilizes the solution. In the case of EIT, A,
x, b are corresponding to S,
δρ
,
δ
V.
2
min bAx
x
−
)0( ≥x
(2)
This method needs the sensitivity matrix in advance; we calculate the matrix using (3).
(3)
Here,
∇φ
m
and
∇φ
n
are the electric potential gradient, which is derived from the electric
supply from the electrode pair of m or n, respectively. In other words, we can calculate each
component of the sensitivity matrix by integrating the inner products of the potential
gradients that are caused by the electric current from m and n electrode pairs in the area
indicated by x and y. This equation can be derived from electromagnetic theory.
Fig. 4 shows the example calculation results of the inner products. These solutions are
obtained by using the Partial Differential Equation Toolbox on MATLAB (The MathWorks
Inc.).
Fig. 4. Example calculation results of the inner product of the potential gradients that caused
by m and n electrode pairs
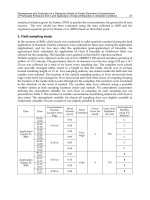
3. Reconstruction experiments
We conducted experiments to determine the performance of our tactile sensor. The
measurement conditions were as follows (Kato et al., 2008).
We measured the potential of all electrodes by using sensor controller and driver board (Fig.
5). The main controller is dsPIC board that is a general-purpose 35x50 mm
2
Tactile Sensor Without Wire and Sensing Element in the Tactile Region using New Rubber Material
403
sensing/controlling board we developed, having a dsPIC (Microchip technology 30F6012A)
as the CPU and a USB interface IC (FTDI FT232RL) for 1 Mbps communication.
It has many connectors through which most pins are accessed. It also has a stacking
connector for an extension board. A tactile sensor controller we developed based on the
dsPIC board uses a 12 bit A/D converter and digital I/Os in the 30F6012A. Its program is
written in C and downloaded in flash memory of the 30F6012A, as firmware.
Within dsPIC board, all measurement is done using Lock-in amp method. Lock-in amp
method is very durable to noise and can be effectively treated by DSP module in dsPIC. The
collected data are sending to PC via USB. The reconstruction algorithm is treated by PC.
Fig. 5. Sensor controller and driver consisting of dsPIC board and extension board
The reconstruction algorithm produced the intensity distribution image of the change in
resistivity from 208 measured values (Redundant pairs were measured for noise tolerance).
The relation between the change in resistivity and pressure distribution is not perfectly
clear, but we can conjecture it from Fig. 2. To display the reconstruction image in gray scale,
we smoothed the image by inserting interpolation pixels among the pixels that represented
actual data. We found that this interpolation successfully displayed a natural distribution
image through the anti-aliasing effect when the pressure point was spread over more than
one reconstruction domain.
Fig. 6. Point pressures are applying by fingers
Sensors, Focus on Tactile, Force and Stress Sensors
404
First, we tested the stabilization ability of our non-negative least squares algorithm. We
applied point pressures by finger as shown in Fig. 6. We compared the reconstruction
images generated using a generalized inverse matrix method and those generated using the
non-negative least squares method from the same data. The non-negative constraint
successfully stabilized the solution, as shown in Fig. 7, while the generalized inverse matrix
method failed. The image obtained by non-negative least squares was very stable, and we
found that areal tactile sensor functioned well enough for practical usage.
Fig. 7. Comparison between ordinal least square solution and non-negative least square
solution from the same input data a) ordinal least square solution, b) non-negative least
square solution
Fig. 8. Reconstructed pressure distribution when three or four point pressures are applied at
a time a) a pressure point, b) two pressure points, c) three pressure points and d) four
pressure points
Tactile Sensor Without Wire and Sensing Element in the Tactile Region using New Rubber Material
405
Next, we tested multiple pressure points. Fig. 8 shows reconstructed images when applying
multiple pressure points by fingers. The images, from the upper left to the lower right, show
the reconstruction results when pressure applied to one, two, three or four points. We found
that the non-negative least squares algorithm makes it possible to recognize individual
pressure points.
Lastly, we measured the update time including the measurement time and reconstruction
time. The update time was about 360ms. This is relatively slow; however, we can improve
the time by optimizing measurement process.
4. Confirmation of basic performance
To examine basic tactile sensor performance, we compared experiments using a digital force
gauge (Shimpo FGC-2B) as shown in Fig. 9 under the same conditions as in previous
sections. A disk-like tip of 25mm in diameter was attached to the digital force gauge to
apply force to conductive rubber. Data was collected in parallel by tactile sensors.
Fig. 9. Experimental setup using digital force gauge
Fig. 10 shows time-averaged reconstructed values by adding time-changing pressures by the
force gauge at one point near the center. Since the tip of the force gauge is almost same size
as the integration area 20mm in diameter corresponding to an element of the sensitivity
matrix, responses were expected to appear on only one or a few adjacent elements, which
was confirmed by results. When the location for adding force was changed, the area
expressing the peak also changed. When peaks appeared in multiple areas, they were in
areas adjacent to each other.