Frontiers in Adaptive Control Part 2 ppt
Bạn đang xem bản rút gọn của tài liệu. Xem và tải ngay bản đầy đủ của tài liệu tại đây (486.53 KB, 25 trang )
Frontiers in Adaptive Control
16
van der Schaf, A. (2000). L
2
-Gain and Passivity Techniques in Nonlinear Control: Spriger-
Verlag, ISBN 978-1852330736.
Xu, Y. & Kanade, T. (1993). Space Robotics: Dynamics and Control: Kluwer Academic
Publishers, ISBN 978-0792392651.
Xu, Y; Shum, H Y; Lee, J J. & Kanade, T. (1992). Adaptive Control of Space Robot System
with an Attitude Controlled Base, Proc. of the 1992 Int. Conf. on Robotics and
Automation, pp. 2005 - 2011, Nice, France, May 1992.
2
On-line Parameters Estimation with Application
to Electrical Drives
Navid R. Abjadi
1
, Javad Askari
1
, Marzieh Kamali
1
and Jafar Soltani
2
1
Isfahan University of Tech.,
2
Islamic Azad University- Khomeinishar Branch
Iran
1. Introduction
The main part of this chapter deals with introducing how to obtain models linear in
parameters for real systems and then using observations from the system to estimate the
parameters or to fit the models to the systems with a practical view.
Karl Friedrich Gauss formulated the principle of least squares at the end of the eighteenth
century and used it to determine the orbits of planets and asteroids (Astrom & Wittenmark,
1995).
One of the main applications of on-line parameters estimation is self-tuning regulator in
adaptive control; nevertheless other applications such as load monitoring or failure
detection, estimation of some states to omit corresponding sensors and etc. also have great
importance.
2. Models linear in parameters
A system is a collection of objects whose properties we want to study and a model of a
system is a tool we use to answer questions about a system without having to do an
experiment (Ljung & Glad, 1994). The models we work in this chapter are mathematical
models, relationships between quantities.
There are different mathematical models categories such as (Ljung & Glad, 1994)
Deterministic-Stochastic
Stochastic models despite deterministic models contain stochastic variables or processes.
Deterministic models are exact relationships between variables without uncertainty.
Dynamic-Static
The variables of a system usually change with time. If there is a direct, instantaneous
relationship between these variables, the system or model is called static; otherwise the
system is called dynamic. For example a resistor is a static system, but a series connection of
a resistor and a capacitor is a dynamic system. In this chapter we interest dynamic systems
which are described by differential or difference equations.
Continuous Time- Discrete Time
If the signals used in a model are continuous signals, the model is a continuous time model;
which is described by differential equations. If the signals used in a model are sampled
signals, the model is a discrete time model; which is described by difference equations.
Frontiers in Adaptive Control
18
Lumped-Distributed
Many physical systems are described by partial differential equations; the events in such
systems are dispersed over the space variables. These systems are called distributed
parameters systems. If a system is described by ordinary differential equations or a finite
number of changing variables, it is a lumped system or model.
Change Oriented-Discrete Event Driven
The physical world and the laws of nature are usually described in continuous signals and
variables, even discrete time systems obey the same basics. These systems are known as
change oriented systems. For systems constructed by human, the changes take place in
terms of discrete event, examples of such systems are queuing system and production
system, which are called discrete event driven systems.
Models linear in parameters or linear regressions are among the most common models in
statistics. The statistical theory of regression is concerned with the prediction of a variable
y , on the basis of information provided by other measured variables
ϕ
1
, …,
ϕ
n
called the
regression variables or regressors. The regressors can be functions of other measured
variables. A model linear in parameters can be represented in the following form
ϕϕϕ
θθθ
=++ =() () () ()
1
1
T
y
tt t t
n
n
(1)
where
ϕϕ ϕ
=() [ () ()]
1
T
tt t
n
,
θθ
θ
=
[ ]
1
T
n
is the vector of parameters to be determined.
There are many systems whose models can be transformed to (1); including finite-impulse
response (FIR) models, transfer function models, some nonlinear models and etc.
In some cases to attain (1), the time derivatives of some variables are needed. To avoid the
noises in measurement data and to avoid the direct differentiation wich amplifies these
noises, some filters may be applied on system dynamics.
Example: The d and q axis equivalent circuits of a rotor surface permanent magnet
synchronous motor (SPMSM) drive are shown in Fig. 1. In these circuits the iron loss
resistance is taken into account. From Fig. 1, the SPMSM mathematical model is obtained as
(Abjadi et al., 2005)
ω
φ
ωω
=− + +
=− − − +
1
1
d
R
i
dm
P
ii v
dm qm r d
dt K K
d
P
i
K
qm
R
P
ii v
qm dm r r q
dt K K K
(2)
where
R
,
B
,
J
,
P
and
T
L
are stator resistance, friction coefficient, momentum of inertia,
number of pole pairs and load torque, also
K
and
K
φ
are defined by
=+(1 )
R
KL
R
i
,
φ
φ
=+(1 )
R
K
R
i
here
R
i
,
φ
and L are respectively the motor iron loss resistance, rotor permanent magnet
flux and stator inductance.
On-line Parameters Estimation with Application to Electrical Drives
19
Figure 1. The d and q axis equivalent circuits of a SPMSM
From Fig. 1-b, the q axis voltage equation of SPMSM can be obtained as
φ
ωω ω
=− − − + + +
LL
Kp R KP P p P
ii i v v v
qq rd rq q rd
RR
ii
(3)
where
=
d
p
dt
Multiplying both sides of (3) by
+
1
p
a
, (3) becomes
φ
ωω
ω
=− − − +
+++ ++
++
++
11 11
()
1
()
p
KRK P
iiPi v
qq rd rq
p
apapa papa
p
LL
P
vv
qrd
pa pa
RR
ii
(4)
Assume
ωω
ωωω ω
== =
++ +
==
++
11 1
,,
11
,
iivv
qf q df d rf r
p
apa pa
iivv
df r d df r d
pa pa
(5)
then
=− = −
++
,
pp
aa
ii i vv v
qq qf q q qf
pa pa
(6)
Frontiers in Adaptive Control
20
Linking (4), (5) and (6), yields
φ
ωω ω
=−+ ++ − −+() ( )
L
KaP R P a P
vii ii vv v
qf q qf df qf rf q qf df
R
i
(7)
Comparing (7) by (1), =
y
v
qf
,
φ
θ
=
[]
T
L
KR
R
i
,
ϕ
ωω ω
=− + −− +[()]
T
aP P a P
ii ii vv v
qqf
d
fqf
r
fqqf
d
f
.
3. Prediction Error Algorithms
In some parameters estimation algorithms, parameters are estimated such that the error
between the observed data and the model output is minimized; these algorithms called
prediction error algorithms. One of the prediction error algorithms is least squares
estimation; which is an off-line algorithm. Changing this estimation algorithm to a recursive
form, it can be used for on-line parameters estimation.
3.1 Least-Squares Estimation
In least square estimation, the unknown parameters are chosen in such a way that the sum
of the squares of the differences between the actually observed and the computed
(predicted) values, multiplied by some numbers, is a minimum (Astrom & Wittenmark,
1995).
Consider the models linear in parameters or linear regressions in (1), base on the least
squares estimation the parameter
θ
are chosen to minimize the following loss function
θ
ϕ
=
∑
−
=
1
2
ˆ
()[ () () ]
2
1
N
T
J
wt yt t
t
(8)
where
θ
ˆ
is the estimation of
θ
and
()wt
are positive weights.
There are several methods in literatures to obtain
θ
such that (8) becomes minimized, the
first one is to expand (8), then separate it in two terms, one including
θ
(it can be shown
this term is positive or equal to zero) the other independent of
θ
; by equating the first term
to zero, (8) is minimized. In other approach the least squares problem is interpreted as a
geometric problem. The observations vector is projected in the vector space spanned by
regression vectors and then the parameters are obtained such that this projected vector is
produced by a linear combination of regressors (Astrom & Wittenmark, 1995). The last
approach which is used here to obtain estimated parameters is to determine the gradient of
(8), since (8) is in a quadratic form by equating the gradient to zero, one can obtain an
analytic solution as follow.
To simplify the solution assume
=
[(1) (2) ( )]
T
yy yN
Y , =
[(1) (2) ( )]
T
ee eN
E ,
ϕ
ϕ
⎡
⎤
⎢
⎥
Φ=
⎢
⎥
⎢
⎥
⎢
⎥
⎣
⎦
M
(1)
()
T
T
T
N
where
θ
ϕ
=−
ˆ
() () ()
T
et yt t .
On-line Parameters Estimation with Application to Electrical Drives
21
Using these notations on can obtain
θ
=−Φ
ˆ
EY (9)
then (8) can be rewritten as
=
1
2
T
JWE
E
(10)
where W is a diagonal matrix of weights.
Substitute for
E in (10)
θ
θ
=−Φ
−Φ
1
ˆ
ˆ
()
()
2
T
JWY
Y
(11)
Expand (11) and calculate its gradient with respect to
θ
ˆ
θθ
θθ
=−Φ− +Φ
ΦΦ
1
ˆˆ
ˆˆ
2
TT
TT T T
JWYW WY W
YY
(12)
θ
θ
∂
=− Φ+ Φ
Φ
∂
ˆ
ˆ
J
T
TT
WW
Y
(13)
Equating gradient to zero
θθ
ϕ
ϕ
ϕ
−
==
ΦΦ
Φ
−
=
∑
∑
=
=
1
ˆˆ
()
()
1
[()()()]
() ()()
1
1
T
T
NWY
W
N
N
T
wt t t
wt tyt
t
t
(14)
provided that the inverse is existed; this condition is called an excitation condition.
Bias and Variance
There are two different source cause model inadequacy. One is the model error that arises
because of the measurement noise and system noise. This causes model variations called
variance errors. The other source is model deficiency, that means the model is not capable of
describing the system. Such errors are called systematic errors or bias errors (Ljung & Glad,
1994).
The least-squares method can be interpreted in statistical terms. Assume the data are
generated by
ϕ
θ
=+() () ()
T
y
ttet (15)
where
={ ( ), 1, 2, }et t is a sequence of independent, equally distributed random variables
with zero mean.
()et is also assumed independent of
ϕ
()t . The least-squares estimates are
unbiased, that is,
θθ
=
ˆ
(())Et and an estimate converges to the true parameter value as the
number of observations increases toward infinity. This property is called consistency
(Astrom & Wittenmark, 1995).
Frontiers in Adaptive Control
22
Recursive Least-Squares (RLS)
In adaptive controller such as self-tuning regulator the estimated parameters are needed on-
line. The least-squares estimation in (14) is not suitable for real-time purposes. It is more
convenient to convert (14) to a recursive form.
Define
ϕϕ
ϕϕ
−
=Φ=
∑
Φ
=
−
=−+
1
() () () () () () ()
1
1
(1) ()()()
t
T
T
ttWtt wiii
P
i
T
twttt
P
(16)
From (14)
θ
ϕ
−
−= −
∑
=
1
ˆ
( 1) ( 1) () () ()
1
t
ttwii
y
i
P
i
(17)
Expanding (14) and substituting for
ϕ
−
∑
=
1
() () ()
1
t
wi i
y
i
i
from (17)
θ
ϕϕ
θ
ϕ
−
=+
∑
=
−
=−−+
1
ˆ
() ()( () ()() () ()())
1
ˆ
1
()( ( 1)( 1) () ()())
t
tPt wi iyiwt tyt
i
Pt t t wt tyt
P
(18)
From (16) it follows that
θθ
ϕϕ ϕ
θθ
ϕϕ
−
=− −+
=−+ − −
ˆˆ
1
() ()(( () () () ())( 1) () ()())
ˆˆ
( 1) () () ()( () ()( 1))
T
tPt twt t t t wt t
y
t
P
T
tPtwttyt tt
(19)
Using (16) and (19) together establish a recursive least-squares (RLS) algorithm. The major
difficulty is the need of matrix inversion in (16) which can be solved by using matrix
inversion lemma.
Matrix inversion lemma. Let A , C and
−
−
+
1
1
DB
C
A
be non-singular square matrices.
Then
−
−
−− −
−
−
+
=−
+
1
1
11 1
1
1
()
()
ABCD
BD
AA DBA
C
A
(20)
For the proof see (Ljung & Soderstrom, 1985) or (Astrom & Wittenmark, 1995). □
Applying this lemma to (16)
ϕϕ
ϕϕ
ϕϕ
−
−
=
−+
−
+−
=−−− −
1
1
()
[ ( 1) () () ()]
1
1
[()(1)()]
( 1) ( 1) () () ( 1)
()
T
t
P
twttt
P
T
T
Itt t
ttt tt
P
PP P
wt
(21)
On-line Parameters Estimation with Application to Electrical Drives
23
Thus the formulas of RLS algorithm can be written as
θθ θ
ϕϕ
ϕϕ
ϕϕ
=−+ − −
−
+−
=−−− −
ˆˆ ˆ
() ( 1) () () ()( () ()( 1))
1
1
[()(1)()]
() ( 1) ( 1) () () ( 1)
()
T
tt Ptwttyt tt
T
T
Itt t
tt t t tt
P
PP P P
wt
(22)
It is worthwhile to note that if
y
is a scalar,
ϕϕ
+−
1
() ( 1) ()
()
T
Itt t
P
wt
will be a scalar too
and there is no need to any matrix inversion in RLS algorithm.
In model (1), the vector of parameters is assumed to be constant, but in several cases
parameters may vary. To overcome this problem, two methods have been suggested. First is
to use a discount factor or a forgetting factor; by choosing the weights in (8) one can
discount the effect of old data in parameters estimation. Second is to reset the matrix
)(tP
alternatively with a diagonal matrix with large elements; this causes the parameters are
estimated with larger steps in (22); for more details see (Astrom && Wittenmark, 1995).
Example: For a doubly-fed induction machine (DFIM) drive the following models linear in
parameters can be obtained without and with considering iron loss resistance respectively
(abjadi, et all, 2006)
Model 1.
ϕ
ωωω
θ
=−
=−−−−−
=
[, , , , ]
[, ,, , ]
y
vv
ds dr
T
pp
ii ii i i i
ds ds r
q
sdr dr r
q
sr
q
r
T
RL RL L
sls rlrm
Model 2.
ϕ
ω
ωω
θ
=−
=− − −
−−+−−−
=+
2
[( ), , , ,
2
,( ), ,, ]
[, ,, ,,, ,, ]
y
vv
ds dr
T
p
pp p
vv ii i i
ds dr ds ds ds r qs
p
pp
ii iiii i
ds r qs r qs qr dr dr dr
LRL LL RL LL
msm lsm rm lrm
T
RLL LR
slsm lrr
RR R R R
ii i i i
0 0.5 1 1.5 2 2.5 3 3.5
0
0.2
0.4
0.6
0.8
1
1.2
1.4
Time <s >
Rs, Rr, Lm
0 0.02 0.04 0.06 0.08 0.1 0.12 0.14 0.16 0.18 0.2
-0.2
0
0.2
0.4
0.6
0.8
1
1.2
1.4
Time <s >
Rs, Rr, Lm
(a) model 1 (b) model 2
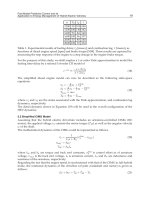
Figure 2. Estimated parameters for DFIM
Frontiers in Adaptive Control
24
To solve the problem of derivatives (
i
p
i
p
drds
, ) in model 1, a first order filter is used and
in order to solve the problem caused by second derivatives in model 2, a second order filter
is used.
The true parameters of the machine are given in Table 1. Using RLS algorithm, the estimated
values of parameters are shown in Fig. 2. In Fig. 2.a. at the time t=1.65 s the value of the
magnetizing inductance (
L
m
) increases 30 %. In this simulation the matrix )(tP has been
reset each 0.1 s with a diagonal matrix.
= 5.5kW
P
n
= 300mH
L
m
=Ω1.2
R
s
= 14mH
L
ls
=Ω0.9
R
r
= 12mH
L
lr
Table 1. Machine parameters
Simplified algorithms
There are simplified algorithms with less computation than RLS. Kaczmarz’s projection
algorithm is one of these algorithms. In this algorithm the following cost function is
considered
αθ
ϕ
θθ θθ
=+−
−− −−
1
ˆ
ˆˆ ˆˆ
(() ()())
(() ( 1))(() ( 1))
2
T
T
J
y
ttt
tt tt
(23)
In fact in this algorithm
θ
ˆ
()t is chosen such that
θθ
−−
ˆˆ
() ( 1)tt is minimized subject to the
constraint
θ
ϕ
=
ˆ
() ()()
T
yt t t .
α
is a Lagrangian multiplier in (23), taking derivatives with
respect to
θ
ˆ
()t and
α
the following parameters estimation law is obtained (Astrom &
Wittenmark, 1995)
ϕ
θθ θ
ϕ
ϕ
ϕ
=−+ − −
()
ˆˆ ˆ
() ( 1) ( () ()( 1))
() ()
t
T
tt yt tt
T
tt
(24)
To change the step length of the parameters adjustment and to avoid zero denominator in
(24) the following modified estimation law is introduced
γϕ
θθ θ
ϕ
λϕ
ϕ
=−+ − −
+
()
ˆˆ ˆ
() ( 1) ( () ()( 1))
() ()
t
T
tt yt tt
T
tt
(25)
where
λ
> 0 and
γ
<<02.
This algorithm is called normalized projection algorithm.
Iterative Search for Minimum
For many model structures the function
θ
=
ˆ
()JJ
in (8) is a rather complicated function of
θ
ˆ
,
and the minimizing value must then be computed by computer numerical search for the
minimum. The most common method to solve this problem is Newton-Raphson method
(Ljung & Glad, 1994).
To minimize
θ
ˆ
()J its gradient should be equated to zero
θ
θ
∂
=
∂
ˆ
()
0
ˆ
J
(26)
On-line Parameters Estimation with Application to Electrical Drives
25
It is achieved by the following recursive estimation
θθ μ θ
θ
−
′
=−−− −
′′
−
1
ˆˆ ˆ
ˆ
() ( 1) ( 1) ( ( 1))
[ ( ( 1))]
tt t Jt
Jt
(27)
Continuous-Time Estimation
Instead of considering the discrete framework to estimate parameters, one can consider
continuous framework. Using analogue procedure similar parameter estimation laws can be
obtained. For continuous gradient estimator and RLS see (Slotine & Weiping, 1991).
Model-Reference Estimation Techniques
Model-reference estimation techniques can be categorizes as techniques analog regression
methods and techniques using Lyapunove or Passivity Theorem. For a detail discuss on
techniques analog regression methods see (Ljung & Soderstrom, 1985) and for examples on
Lyapunove or passivity theorem based techniques see (Soltani & Abjadi, 2002) & (Elbuluk,
et all, 1998).
In model-reference techniques two models are considered; one contains the parameters to be
determined (adaptive model) and the other is free or independent from those parameters
(reference model). The two models have same kind output; a mechanism is used to estimate
the parameters in such a way that the error between these models outputs becomes
minimized or converges to zero.
3.2 Other Algorithms
Maximum Likelihood Estimation
In prior sections it was assumed that the observations are deterministic and reliable. But in
stochastic studies, observations are supposed to be unreliable and are assumed as random
variables. In this section we mention a method for estimating a parameter vector
θ
using
random variables.
Consider the random variable
=∈ℜ( , , , )
12
N
yyy y
N
as observations of the system. The
probability that the realization indeed should take value
y is described as
θ
(;)
f
y , where
θ
∈ℜ
d
is the unknown parameter vector. A reasonable estimator for the vector
θ
is to
determine it so that the function
θ
(;)fy
takes it maximum (Ljung, 1999), i.e. the observed
event becomes as likely as possible. So we can see that
θθ
θ
∧
=() ar
g
max ( ; )
y
fy
ML
(28)
The function
θ
(;)
f
y is called the likelihood function and the maximizing vector
θ
∧
()y
ML
is
known as the maximum likelihood. For a resistance maximum likelihood estimator and
recursive maximum likelihood estimator see (Ljung & Soderstorm, 1985).
Instrumental Variable Method
Instrumental variable method, is a modification of the least squares method designed to
overcome the convergence problems.
Consider the linear system
ϕθ
=+() () ()
T
y
ttvt
(29)
Frontiers in Adaptive Control
26
In the least squares method,
θ
ˆ
()N
will not converge to
θ
, if there exists correlation
between
ϕ
()t
and
()vt
(Ljung, 1999). A solution for this problem is to replace
ϕ
()t
by a
vector
ζ
()t
that is uncorrelated with
()vt
. The elements of
ζ
()t
are called instrumental
variables and the estimation method is called instrumental variable method.
By replacing
ϕ
()t
by
ζ
()t
in the least squares method we have
θζϕ ζ
−
⎡⎤
=
∑∑
⎢⎥
⎢⎥
==
⎣⎦
1
ˆ
( ) () () ()()
11
NN
T
Ntt t
y
t
ii
(30)
for the off-line case and
θϑ θ ϕ
ζ
ζ
ϕζ
ζϕ
ϕζ
=−+ − −
−
==
+−
−−
=−−
+−
ˆˆ ˆ
( ) ( 1) ( )[ ( ) ( 1) ( )],
(1)()
() () (),
1()(1)()
( 1)() ()( 1)
() ( 1) ,
1()(1)()
T
tt Ltyt t t
Pt t
Lt Pt t
T
tPt t
T
Pt t tPt
Pt Pt
T
tPt t
(31)
for recursive fashion.
The instrumental variables should be chosen such that
1.
ζ
()t
and
()vt
be uncorrelated,
2.
The matrix
ζϕ
∑
→∞
=
1
lim ( ) ( )
1
N
T
tt
N
N
i
be invertible.
under these conditions and if
()vt
has zero mean,
θ
ˆ
()N
will converge to
θ
. A common
choice of instrumental variables is (Ljung & Soderstorm, 1985)
ζ
=− − − − − −( ) ( ( 1) ( ) ( 1) ( ))
T
tyt ytnut utm
M
M
(32)
where
()yt
M
is the output of the system
+−++−=−++−( ) ( 1) ( ) ( 1) ( )
11
y
ta
y
ta
y
tn but butm
M
MnM M
(33)
For the recursive fashion it is common to let
a
i
and
b
i
be time-dependent.
Bayesian Method
In the Bayesian method, in addition to observations, parameter is considered as a random
variable too. In this method, parameter vector
θ
is considered to be a random vector with a
certain prior distribution. The value of this parameter is determined using the observations
t
u
and
t
y
(input and output of the system until time t) of random variables that are
correlated with it.
On-line Parameters Estimation with Application to Electrical Drives
27
The posterior probability density function for
θ
is considered as
θ
(,)
tt
p
u
y
. There are
several ways to determine the parameter estimation
θ
ˆ
()
t
from the posterior distribution.
This is a very difficult problem in general to find the estimate
θ
ˆ
()t
and only approximate
solutions can be found. But under the specific conditions mentioned in the following lemma,
there exists an exact solution.
Lemma. (Ljung & Soderstorm, 1985) Suppose that the data is generated according to
ϕθ
=+() () ()
T
y
ttet
(34)
where the vector
ϕ
()t
is a function of
−−11
,
tt
uyand
{
}
()et
is a sequence of independent
Gaussian variable with
=() 0Ee t
and =
2
() ()
2
Ee t r t . Suppose also that the prior distribution
of
θ
is Gaussian with mean
θ
0
and covariance matrix
0
P . Then the posterior distribution
θ
(,)
tt
p
u
y
is also Gaussian with mean
θ
ˆ
()t
and covariance matrix
()Pt
, where
θ
ˆ
()t
and
()Pt
are determined according to
θθ θ ϕ
ϕ
ϕ
ϕϕ
ϕϕ
ϕϕ
θθ
=−+ − −
−
==
+−
−−
=−−
+−
==
ˆˆ ˆ
() ( 1) ()[ () ( 1) ()],
1(1)()
() ()() ,
()
() () ( 1) ()
2
2
(1)()()(1)
() ( 1) ,
() () ( 1) ()
2
ˆ
(0) , (0)
00
T
tt Ltyt t t
Pt t
Lt Pt t
T
rt
rt tPt t
T
Pt t tPt
Pt Pt
T
rt tPt t
PP
(35)
For the proof see (Ljung, 1985).
4. Nonlinear models
There are many applications that linear in parameters models dose not suffice to describe
the system. Systems with nonlinearities are very common in real world; in this section some
models suitable for such systems are introduced.
Wiener and Hammerstein System
Some especial cases of nonlinearities in system are static nonlinearities at the input or the
output or both of them. In other words there are systems with dynamics with a linear
nature, but there are static nonlinearities at the input or the output or both of them. Example
for static nonlinearity at the input is saturation in the actuators and static nonlinearity at the
output is sensors characteristics (Ljung, 1999).
A model with a static nonlinearity at the input is called a Hammerstein model while a
model with a static nonlinearity at the output is called a Wiener model. Fig. 3 shows these
models.
Frontiers in Adaptive Control
28
Figure 3. Hammerstein and Wiener models
Fuzzy System
Fuzzy Systems or knowledge-based systems are a type of nonlinear systems that can be
used to approximate nonlinear behavior of many practical systems (Wang, 1997).
Certain types of fuzzy systems can be written as compact nonlinear formulas. In this section
we will consider Takagi-Sugeno fuzzy systems that are a common used type of fuzzy
systems.
Consider a multi input-single output Takagi-Sugeno fuzzy system given by (Passino &
Yurkovich, 1998)
μ
μ
∑
=
=
∑
=
() ()
1
()
1
R
gx x
ii
i
y
R
x
i
i
(36)
Where,
μ
()x
i
is the certainty of the premise of the i-th rule (Trabelsi & Lafont, 2004)
and =+ ++()
,0 ,1 1 ,
gx a a x a x
iii inn
is the consequent of the i-th rule
With extending (36) we have
μμ μ
μμ μ
∑∑ ∑
== =
=+ ++
∑∑ ∑
== =
() () ()
,0 ,1 1 ,
11 1
() () ()
11 1
RR R
ax axx axx
ii i i inni
ii i
y
RR R
xx x
ii i
ii i
(37)
If we define
μ
ξ
μ
=
∑
=
()
()
()
1
x
i
x
i
R
x
i
i
(38)
ξξξξξξ ξ ξξ ξ
=( ) [ , , , , , , , , , , , , ]
12 1112 1 1 2
T
xxxxxxx
RRnnnR
(39)
On-line Parameters Estimation with Application to Electrical Drives
29
θ
= [ , , , , , , , , , , , , ]
1,0 2,0 ,0 1,1 2,1 ,1 1, 2, ,
T
aa a aa a aa a
RRnnRn
(40)
We can write (36) as
ξ
θ
= ()
T
yx (41)
We see that (41) is in the same form as we defined for linear systems and is linear versus
θ
.
Thus it is possible to use mentioned Estimators like recursive least square and Gradient
Estimators to estimate parameter vector
θ
.
Neural Network System
Another common method to model systems is using artificial neural network for the details
see (Ljung, 1999).
5. Conclusion
In this chapter, some parameters estimation algorithms are presented; among them RLS is
one of the most common parameters estimation algorithms, which is discussed in details.
The main key to use this algorithm or similar ones is the model must be linear in
parameters.
Two practical examples from the field of electrical motor drives are introduced to show that
even from nonlinear complex systems one may obtain models linear in parameters.
There are several ways to model a real system. Some of the models used to predict the
behaviour of systems are presented.
6. References
Abjadi, N. R.; Soltani, J.; Pahlavaninezhad, M. & Askari, J. (2005). A Nonlinear Adaptive
Controller for Speed Sensorless PMSM Taking The Iron Loss Resistance Into
Account, Proceedings of The Eighth International Conference on Electrical Machines and
Systems (ICEMS), pp. 188-193, Nanjing, China, September 2005, Southeast
University, Nanjing
Abjadi, N. R.; Askari, J. & Soltani, J. (2006).
Adaptive Control of Doubly Fed Field-Oriented
Induction Machine Based On Recursive Least Squares Method Taking the Iron Loss
Into account, Proceedings of CES/IEEE 5
th
International Power Electronics and Motion
Control Conference (IPEMC), pp. 1923-1927, ISBN 1-4244-0448-7, Shanghai, China,
August 2006, Shanghai Jiao Tong University, Shanghai
Astrom, K. J. & Wittenmark, B. (1995). Adaptive control,
Addison-Wesley Longman, Inc.,
Californian
Elbuluk, M.; Langovsky, N. & Kankam, D. (1998). Design and Implementation of a Closed-
Loop Observer and Adaptive Controller for Induction Motor Drives, IEEE
TRANSACTIONS ON INDUSTRY APPLICATIONS, pp. 435-443, Vol. 34, No. 3,
MAY/JUNE 1998
Ljung, L. & Soderstrom, T. (1985). Theory and Practice of Recursive Identification, MIT Press,
Massachusetts
Ljung, L. & Glad, T. (1994). Modeling of dynamic systems, Prentice-Hall, Inc., ISBN 0-13-
597097-0, NJ
Frontiers in Adaptive Control
30
Ljung, L. (1999). System identification: Theory for the user, Prentice-Hall, Inc., NJ
Passino, K. M. & Yurkovich S. (1998). Fuzzy control, Addison-Wesley
Longman, Inc.,
Californian
Slotine, J. J. E. & Weiping, L. (1991). Applied nonlinear control, Prentice-Hall, Inc., NJ
Soltani, J. & Abjadi, N. R. (2002).
A Modified Sliding Mode Speed Controller for an
Induction Motor Drive without Speed Sensor Using the Feedback Linearization
Theory,
Proceedings of EPE-PEMC 10
th
Power Electronics and Motion Control
Conference, Dubrovnik, Croatia, 2002, Zagreb University, Dubrovnik
Trabelsi, A.; Lafont F.; Kamoun M. & Enea G. (2004). Identification of nonlinear
multivariable system by adaptive fuzzy Takagi-Sugeno model, Int. J. Computational
Cognition, vol. 2, no. 3, pp. 137-153
Wang L. X. (1997). A Course in Fuzzy Systems and Control, Prentice-Hall, NJ
3
A New Frequency Dependent Approach to
Model Validation
Pedro Balaguer and Ramon Vilanova
Autonomous University of Barcelona
Spain
1. Introduction
In order to have confidence in a model it is necessary to validate it. Different model
validation approaches exist. Their difference is based upon the assumptions about the plant
and models. Classical validation methods, based on classical model identification (Ljung,
1994; Soderstrom and Stoica, 1989) rely on statistical uncertainty assumptions due to
stochastic noise only. On the other hand, control oriented identification methods (Chen and
Gu, 200) (i.e.
∞
H identification, stochastic embedding, set membership identification, etc.)
lead to validation assumptions based on bounded noise and bounded model
undermodelling. However in both cases the output of the validation process is just a
“validated/invalidated” result.
Regarding classical validation methods, the problem of assessing the validity of an
identified model has been traditionally linked with the problem of model order selection.
The classical model validation literature (Ljung, 1994; Soderstrom and Stoica, 1989) has
approached the problem in two ways:
• use of plots and common sense.
• use of statistical tests on the residuals
()t
ξ
(i.e. the difference between the real output
and the model output
ˆ
() () ()tytyt
ξ
=−).
The first approach is basically based on the comparison of experimental data with the model
output. If both are similar then the model can be considered a good one. However there are
two unavoidable reasons that prevent the model output to fit data perfectly: the modelling
errors and perturbations. The second approach is to apply a hypothesis test over the
residual ()t
ξ
, which follows from the assumptions on the disturbance. The more common
assumptions over the residual are (Soderstrom and Stoica, 1989):
• h1:
()t
ξ
is a zero mean white noise.
• h2:
()t
ξ
has a symmetric distribution.
• h3:
()t
ξ
is independent of past inputs (i.e. [()()] 0,Etu t
ξ
ττ
=>).
• h4:
()t
ξ
is independent of all inputs (i.e. [()()] 0, ,Etu t
ξ
ττ
=∀).
Frontiers in Adaptive Control
32
The above assumptions lead to check two main residual properties, the whiteness of the
residuals (i.e. h1, h2) and the cross-correlation between residuals
()t
ξ
and control actions
()ut (i.e. h3, h4).
Hence classical validation tests can be classified as follows
1. Whiteness Test.
• Autocorrelation test (Assumption h1).
• Testing changes of sign (Assumptions h1 and h2).
2. Independence between residuals and inputs.
• Cross-correlation test of past inputs (Assumption h3 or Assumptions h3 and h1).
• Cross-correlation test of all inputs (Assumption h4 or Assumptions h4 and h1).
The rationale of the tests is to detect causes of variation on the residual distinct than the ones
assumed. For example if the residual is assumed to be white noise and the test shows that
the whiteness statistical hypothesis is violated then we assume that there is a distinct cause
producing the mismatch (i.e. model error).
The result of the statistical tests above reviewed is a binary one. In fact the test either
validates or invalidates the model. No further information is provided by the test. As a
result, two important drawbacks are
1. There is no information on important model aspects such as (Balaguer and Vilanova,
2006a):
• The reasons why the model is invalidate.
• How to improve the model.
• The model usefulness degree.
2. In control design, undermodelling (i.e. use of low order models) is normally present
(Balaguer and Vilanova, 2006b). In fact as stated in (Ljung, 1994) “For such a model (a
model simpler that the one that minimizes the total error) typically the bias error is the
dominating contribution to the total error. Consequently, such models would normally be
falsified during model validation”.
Thus, as a conclusion, although the theory of classical validation methods is well developed
and plenty of successful applications it has limitations when a more informative validation
procedure is required.
In this chapter we present a new view to the model validation procedure. The main
characteristic of the presented approach is that the validation is frequency dependent. As a
result the validation procedure is more informative as:
1. The same model can result validated for a frequency range and invalidated for a distinct
frequency band. Thus the result of the validation procedure is no longer binary but
frequency dependent.
2. The algorithm provides the frequency range for which the model is validated.
3. The validation procedure is suited to be used with residuals generate in a control
oriented fashion (i.e. in closed loop).
The application areas of this new, more informative, validation procedure are wide. The
applicability potential hinges on the frequency dependence of the validation result. In
particular we focus on the application for model validation on Iterative Identification and
Control Design Schemes. In Iterative Identification and Control Design Schemes (Albertos
and Sala, 2002), a new model is identified at each iteration. Thus it is necessary to validate
the new model. Moreover these iterative schemes have some requirements, such as input
A New Frequency Dependent Approach to Model Validation
33
experiment design, model order selection, etc. The proposed frequency dependent
algorithm gives information in order to i) select controller bandwidth, ii) select model
order and iii) design the input experiment for the next iteration.
A distinct application area of the algorithm presented here is the validation of controllers.
The objective is to validate the behaviour of a possibly low order controller (e.g. PID)
against a more complex controller (e.g. optimal controller). The procedure presented here
can be applied to ascertain for what frequency ranges both controllers are behaving in an
equivalent manner. Moreover the validation procedure also suggests a tuning method by
means of minimizing the residual generated by the comparison of both controllers. First
results can be found in (Balaguer et al., 2008).
Summing up, in this chapter we present a new model validation algorithm in which the
validation result is no longer “validated/invalidated” but frequency dependent. Thus the
validation result is more informative, providing new features of applicability in several
areas of control theory.
The chapter contributions are organized as follows
1. A new procedure for model validation in the frequency domain is presented (Section
2). This procedure permits to validate or invalidate models over certain frequency
ranges. The procedure is the translation of a time domain residual whiteness test to a
frequency dependent residual whiteness test. The counterpart on the frequency
domain of a time domain whiteness test is established. This leads to stating the
statistical properties of each spectrum frequency component if the time domain
transformed signal is white noise. It is shown that the normalized spectrum is a
random variable with a
2
χ
distribution of 2 degrees of freedom (Theorem 2). The
validation/invalidation step is based on a hypothesis test applied to each frequency
component. This determines if certain frequency components have an unusual
content that discards the model validity for this frequency value. The
acceptance/rejection decision of the frequency component validity comes with a
probability measure.
2. The intended use of the model (e.g. open loop or closed loop) is taken into account by
considering the structure from which the residuals are generated. In Section 3 a study
of the residuals information content and its statistical properties for different
structures (e.g. open loop Vs closed loop) is conducted. As the validation procedure is
based on a whiteness test, the residual should be white noise whenever the model fits
accurately the plant. This however is not the general case when residuals coming
from closed loop comparisons are used. In order to overcome this difficulty, a novel
structure is proposed in Section 3.3 which is able to provide white residuals in closed
loop.
3. The application of the presented validation procedure on Iterative Identification and
Control Design Schemes is discussed in Section 4. It is shown that the validation
procedure shifts from a classical static test (i.e. validation/invalidation) to a dynamic
one which gives frequency domain information useful for improvement of
identification and control design on iterative schemes.
4. The chapter ends in Section 5 stating the conclusions and the possible extensions of
the frequency dependent validation algorithm.
Frontiers in Adaptive Control
34
2. Frequency Dependent Model Validation
The main objective of the methodology presented is to validate a model on the frequency
domain. To this end a time domain validation procedure based on testing the residual
whiteness is modified to achieve the pursued objectives. The idea is as follows. It is assumed
that if the residual is white noise the model is validated because the residual contains no
further useful information that could be used to improve the model accuracy. This test is
usually performed in the time domain by studying the residual autocorrelation, the number
of sign changes, etc (Ljung, 1994).
We translate the time domain residual to the frequency domain by its discrete Fourier
transform. Moreover, the statistical properties of the spectrum of a white noise signal are
calculated. The objective is to test if the spectrum calculated from the residual has properties
of white noise. As a result, one unique test in the time domain has been translated to N
different tests in the frequency domain. We check if the
th
k frequency component of the
spectrum has the properties of a typical frequency component of a white noise. In the
affirmative case we have no reason to believe that the model is invalid on that frequency
component. On the other hand, if there are certain frequency components that clearly do not
behave accordingly with the statistical properties of white noise then it is likely that at this
frequency range there is an important mismatch between the model and the plant. As a
result the model is invalid for that frequency range.
2.1 Whiteness Test on the Frequency Domain
In this section the statistical time domain properties of a white noise are translated to the
frequency domain. This is accomplished by means of two theorems. The first one is an
intermediate result that is used by the second one which describes the frequency domain
distribution of the spectrum of a white noise.
Theorem 1
Let
()n
ξ
be a sequence of independent identically distributed (IID) samples of normal
distribution
2
(, )N
ξξ
μ
σ
. If we express the discrete Fourier transform by its real and
imaginary part, that is
0
1
0
1
()
N
j
kn
kk k
n
RjI ne
N
ξξ
−
−Ω
=
=+ =
∑
then the real part
k
R is a random variable normally distributed
2
,
()
kk
kRR
RN
μσ
∈ with mean
k
R
μ
and variance
2
k
R
σ
given by
1
0
0
1
()
k
N
R
n
Cos kn
N
ξ
μμ
−
=
=Ω
∑
(1)
1
22 2
0
2
0
1
()
k
N
R
n
Cos kn
N
ξ
σσ
−
=
=Ω
∑
(2)
A New Frequency Dependent Approach to Model Validation
35
Similarly the Imaginary part
k
I
is a random variable normally distributed
2
,
()
kk
kII
IN
μ
σ
∈
with mean
k
I
μ
and variance
2
k
I
σ
given by
1
0
0
1
()
k
N
I
n
Sin kn
N
ξ
μμ
−
=
=Ω
∑
(3)
1
22 2
0
2
0
1
()
k
N
I
n
Sin kn
N
ξ
σσ
−
=
=Ω
∑
(4)
Proof:
The discrete Fourier transform of a discrete time signal
k
ξ
is given by
0
1
0
1
()
N
j
kn
k
n
ne
N
ξξ
−
−Ω
=
=
∑
(5)
where
0
2
N
π
Ω=
is the fundamental frequency. Decomposing the equation (5) into its real
part and its imaginary part gives
()
0
1
0
1
00
0
11
00
00
1
()
1
()() ()
11
() ( ) () ( )
N
jkn
k
n
N
n
NN
nn
kk
ne
N
n Cos kn jSin kn
N
n Cos kn j n Sin kn
NN
RjI
ξξ
ξ
ξξ
−
−Ω
=
−
=
−−
==
=
=Ω−Ω
=Ω− Ω
=−
∑
∑
∑∑
where the second equality comes from Euler's identity. Hence the real and imaginary parts
are linear combinations of normally distributed random variables
1
0
0
1
0
0
1
() ( )
1
() ( )
N
k
n
N
k
n
RnCoskn
N
I
nSin kn
N
ξ
ξ
−
=
−
=
=Ω
=Ω
∑
∑
As a result, it follows that
k
R and
k
I
are also normally distributed random variables. The
distribution parameters for the stochastic variable
k
R are calculated as follows (see, for
example, (Box et al., 1978), page 87)
1
0
0
1
()
k
N
R
n
Cos kn
N
ξ
μμ
−
=
=Ω
∑
1
22 2
0
2
0
1
()
k
N
R
n
Cos kn
N
ξ
σσ
−
=
=Ω
∑
The same reasoning is applicable to the imaginary part
k
I
.
Frontiers in Adaptive Control
36
Remark 1
k
R
μ
is equal to zero for
{
}
1, 2, , 1kN∈−K
and
0
R
μ
equals the mean value of the residual
(i.e.
0
R
ξ
μμ
=
).
k
I
μ
is always equal to zero for
{
}
0,1, 2, , 1kN∈−K
.
Theorem 2
The normalized squared gain
2
k
M
defined as
22
2
kk
kk
kR kI
k
RI
RI
M
μμ
σσ
⎛⎞⎛⎞
−−
=+
⎜⎟⎜⎟
⎜⎟⎜⎟
⎝⎠⎝⎠
(6)
has a
2
χ
distribution of 2 degrees of freedom.
Proof:
By definition the sum of r independent squared random normal variables
(0,1)N has a
2
χ
distribution of r degrees of freedom. Due to the normalization of
k
R and
k
I
, it follows that
(0,1)
k
k
kR
R
R
N
μ
σ
−
∈
and (0,1)
k
k
kI
I
I
N
μ
σ
−
∈
.
2.2 Procedure
The frequency domain model validation procedure is as follows
1. Calculate the residual as the difference of the real output and the model estimated
output (
ˆ
() () ()
nynyn
ξ
=−).
2. Calculate the discrete Fourier transform of the residual
k
ξ
.
3. Decompose each frequency component on its real part and imaginary part
kk k
RjI
ξ
=+ .
4. Calculate distribution parameters of the Real (
k
R ) and Imaginary (
k
I
) part for each
frequency component
k
, as shown in Theorem 1, that is:
• Real part (
k
R ): Calculate
0
R
μ
and
2
k
R
σ
for
{
}
0,1, 2, , 1kN∈−K
(Equations (1) and
(2)).
• Imaginary part (
k
I
): Calculate
2
k
I
σ
, for
{
}
0,1, 2, , 1kN∈−K (Equations (3) and (4)).
5. Calculate the normalized magnitude spectrum for each frequency
{
}
0,1, 2, , 1kN∈−K
as follows:
22
2
kk
kk
kR kI
k
RI
RI
M
μμ
σσ
⎛⎞⎛⎞
−−
=+
⎜⎟⎜⎟
⎜⎟⎜⎟
⎝⎠⎝⎠
6. Perform a hypothesis tests over each one of the normalized magnitude spectrum
2
k
M
,
indexed by
{
}
0,1, 2, , 1kN∈−K , as follows:
•
22
02
:
k
HM
χ
∈
•
22
12
:
k
HM
χ
∉
A New Frequency Dependent Approach to Model Validation
37
See next section for a deeper discussion on the hypothesis test procedure.
Figure 1. White noise example
The above steps are materialized in the following example. A realization of a normally
distributed random variable of zero mean and unity variance is performed with 500
samples. The discrete Fourier transform of the realization is calculated and decomposed into
its real and imaginary parts (i.e.
k
R ,
k
I
). The values of
k
R and
k
I
are shown in figure 1.
They follow a normal variable distribution with parameters given by equations (1), (2), (3)
and (4) (i.e.
2
( 0, 0.001)
kk
kRR
RN
μσ
∈== and
2
( 0, 0.001)
kk
kI I
IN
μσ
∈==. On figure 1
the realizations of
k
R and
k
I
are plotted together with the 3 sigma limits of their
distribution (i.e. the 99.73% of the samples fall between the plotted limits). It can be seen that
all points fall inside this range.
Finally the normalized magnitude spectrum is calculated following equation (6). The
magnitude spectrum can be seen in figure 1 together with the 99.5% confidence limit of the
2
2
χ
distribution (i.e. the 99.5% of the samples fall between 0 and 10.6). All the magnitude
frequency components remain below of the confidence limit so there are no reasons to
invalidate the model. The whiteness test has passed. In the sequent section the hypothesis
test features are described more thoroughly.
Frontiers in Adaptive Control
38
2.3 Hypothesis Test
A hypothesis test is a statement about a random variable. This statement is expressed by
means of two hypothesis
0
H
and
1
H
.
0
H
is called the null hypothesis and
1
H
is the
alternative hypothesis. In order to decide the validity of either the null hypothesis
0
H
or the
alternative hypothesis
1
H
, an estimation of a population parameter (e.g. mean or variance)
is computed from a population sample and it is compared against the assumed population
parameters. These population parameters are random variables too with certain mean and
variance. If it is likely that the computed statistic is inside the population parameters
distribution then
0
H
is accepted, otherwise
0
H
is rejected in favour of
1
H
. As a result, two
errors are possible: to reject
0
H
when it is true (type I error or
α
error), or to fail to reject
0
H
when
0
H
is false (type II error or
β
error).
The hypothesis test is the last step of the presented procedure, where the decision of
validation/invalidation of certain frequency component is taken. The hypothesis test to be
applied in the proposed procedure is:
22
02
22
12
:
:
k
k
HM
HM
χ
χ
∈
∉
(7)
The hypothesis
0
H
states that the normalized modulus
2
k
M
of the
k
frequency component
is
2
2
χ
distributed. On the other hand the hypothesis
1
H
states that the normalized modulus
2
k
M
of the k frequency component is not
2
2
χ
distributed.
Remark 2
The hypothesis test stated in (7) is applied to each frequency component, from 0 rad/sec up
to the Nyquist frequency (i.e.
s
T
π
, where
s
T is the sample time).
In order to decide the validity of either the null hypothesis
0
H
or the alternative hypothesis
1
H
,
2
k
M
is computed. If it is “likely” that the value of
2
k
M
lies inside the
2
2
χ
distribution
then
0
H
is accepted, otherwise
0
H
is rejected in favour of
1
H
. As a result, two errors are
possible as discussed above, to reject
0
H
when it is true, or to fail to reject
0
H
when
0
H
is
false.
The probability of rejecting
0
H
when it is true is set by the user by choosing the confidence
limit. For example, if the confidence limit is chosen to be 10.6 then the 99.5% of samples of a
2
2
χ
distribution fall inside the limit. This confidence limit sets the type I error. Following the
example presented in the preceding section, the type I error was of 0.5%, that is the 0.5% of
the samples of a
2
2
χ
must be greater than 10.6. The type II error is more difficult to be
calculated as it depends on knowledge of of the actual distribution followed by
2
k
M
.
The hypothesis test is then simply a check that any magnitude of the normalized spectrum is
less than the test limit. If the value is greater then it is very unlikely and the model results
invalidate for this frequency.
A New Frequency Dependent Approach to Model Validation
39
2.4 Open Loop Model Validation Example
The proposed validation procedure in the frequency domain is applied to a stable plant in
open loop (see figure 2). The real plant
G and the model
ˆ
G chosen to approximate it are:
10
(1)(10)
1
ˆ
1
G
ss
G
s
=
++
=
+
The Bode diagram comparing the real plant with the model is shown in figure 3.
Figure 2. Open loop structure
Figure 3. Comparison of Bode Diagram of plant and model
Frontiers in Adaptive Control
40
The experimental setup is as follows. The residuals generated by the open loop structure of
figure 2 are given by:
ˆ
()
OL
dGGr
ξ
=+ −
Hence the residual
OL
ξ
is just the noise
d
if the model and the plant are equal (i.e.
ˆ
GG= ).
Hence the residual has the same stochastic properties than the noise. The perturbation
d
is
assumed to be white noise with
σ
=1. The reference input r is a train of sinusoids up to
frequency 3 rad/sec.
The validation procedure results can be seen in figure 4. The model
ˆ
G shows no
invalidation signs up to 1.4 rad/sec. However for higher frequencies the hypothesis test fails
to validate the model. As a conclusion we can state that, for the input applied, the model is
correct for frequencies below to 1.4 rad/sec. It is worth to mention that although between
1.7 rad/sec and 2.3 rad/sec there are no spikes out of the confidence limits, a deeper
examination reveals that several consecutive spikes are abnormally high to belong a
2
2
χ
distribution. In order to detect this situation further probabilities should be checked (e.g. the
probability that two consecutive points of a
2
2
χ
distribution be higher than some given
value.)
Figure 4. Normalized Magnitude Spectrum and Confidence Limit