Environmental Technologies Part 12 docx
Bạn đang xem bản rút gọn của tài liệu. Xem và tải ngay bản đầy đủ của tài liệu tại đây (690.62 KB, 20 trang )
Assessment of Air Quality in an Urban Area of Belgrade, Serbia 213
the main sources by multivariate receptor modeling (PCA, CA), enrichment factor (EF)
calculation, meteorological conditions and air back trajectories analysis.
In this review, we report some of the results of the integral monitoring of air quality in
Belgrade urban area in order to evaluate the impact of airborne trace metals on the pollution
load for the period from 2002 to 2006. Some of the results concerning suspended particle
mass and trace metal concentrations in ambient air of the Belgrade will be presented,
including physical and chemical characterization, with the aim to examine elemental
associations and to indicate the main sources of trace and other metals in the city. The
results of this long-term project of the pollution monitoring could be used as the baseline
data for analysis of health risks due to inhalation of suspended aerosols, and to provide
scientific evidence for setting up an air pollution control strategy. This information is crucial
in environmental quality assessment, and can lead to the determination of a possible
exceedance of the critical loads.
Also, the aim of our research was to set up a reliable methodological approach in sampling
and analytical procedures for investigation of moss and deciduous leaves biomonitoring,
and to evaluate the reliability of investigated species for biomonitoring of trace metal
pollution in Belgrade urban areas. The higher plants leaves, horse chestnut (Aesculus
hippocastanum L.) and Turkish hazel (Corylus colurna L.) widely spreaded in the city have
been sampled and their trace metal accumulation abilities analysed. Some physical and
chemical characteristics of particles deposited on leaf surfaces have been studied as well.
Mosses Brachythecium sp. and Eurhynchium sp., used in this study, more common in Serbia,
were investigated for their accumulation capability.
The first data set for ozone and correlation to relevant meteorological parameters obtained
in Belgrade during several sampling periods in Belgrade will be presented, and
consequently, important information about the local air quality.
Meteorological conditions favorable for the build up of ozone are frequent, in Belgrade and
the surrounding area, from early spring to early autumn. During this period, photochemical
smog events often show different features and are difficult to assign to a particular pattern.
Although ozone levels were measured in Belgrade sporadically during the early 80-ties, and
each season starting from 1991, few of these data have been published and the information
is scant and difficult to find (Vukmirović et al., 1987). Therefore, it would be useful to
present the more complete results of our measurements, stressing the main characteristics of
the photochemical episodes recorded in the Belgrade area. As there is no available data on
ozone measurements from the area of the former Yugoslavia (except Slovenia and FYROM)
in European Environmental Agency reports, it is important to increase the geographical
coverage of the current state of knowledge with respect to ozone seasonal cycles in the
troposphere over Europe.
2. Experimental Methods and Procedures
2.1 Studied Sites and Sampling
Belgrade, (H
s
= 117 m, ϕ = 44
0
49’14’’N and λ = 20
0
27’ 44’’E) the capital of Serbia, with about
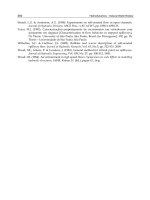
2 million inhabitants, is situated at the confluence of the Sava and Danube rivers (Fig. 1). In
the winter, severe air pollution in the form of aerosol smog occurs frequently in the urban
area of Belgrade, particularly under the meteorologically calm (wind speed < 2 m s
-1
) and
stable conditions. The total number of vehicles in the year 2002 was more than 350,000,
including 22,000 heavy-duty vehicles and over 1,000 city buses using diesel. The average
214 ENVIRONMENTAL TECHNOLOGIES: New Developments
age of passenger cars is more than 15 years, which means that leaded gasoline (0.4 g l
-1
Pb)
is still in wide use in the country. There are many old buses and trucks on the streets and it
could be the significant major source of ambient PM
10
. There are 18 bigger heating plants
with a total capacity of 2018 MW, run with natural gas or crude oil and 59 smaller plants
run only with crude oil (approximately 193 MW). Fuel used for domestic heating consists
mainly of coal or crude oil and natural gas in last few years.
The climate of Belgrade is moderate continental with fair cold winters and warm summers.
The prevailing wind is N-NW, but characteristic wind “Košava” (SE-ESE) blows with an
annual frequency of 26% and an average speed of 4 m s
-1
(Unkašević, 1999). Fortunately,
“Košava” comes from relatively unpolluted area. This wind effectively improves the
horizontal dispersing and dilution of pollutants in the ground-level atmosphere of Belgrade
city.
Fig. 1. Location of the sampling sites in Belgrade urban area: Rector’s Office building (RB);
Botanic Garden (BG); Autokomanda (VF); Institute of Physics- Zemun (IF);
Kalemegdan Park (KP)
2.1.1 Particulate Matter
Sampling of particulate matter PM
10
and PM
2.5
started on three sites in the very urban area
of Belgrade in June 2002 and has continued afterwards. The first sampling point was on the
roof of the Rector’s Office building of Belgrade University on Student Square (RB), at a
height of about 20 m, near a small city-park. The square has high traffic density and a bus
terminal. As this sampling point is in the very city center, on the rooftop where the airflow
is not blocked by any direction, it can be considered as representative for urban-background
concentrations. The second sampling location was at about 6 m height in the Botanic Garden
(BG) about 50 m far from heavy-traffic streets. The third sampling site was the platform
above the entrance steps to the Faculty of Veterinary Medicine (VF) at a height of about 4 m
from the ground, 5 m away from a street with heavy traffic and close to the big
Autokomanda junction with the main state highway. The traffic is controlled by street
lights. This point can be considered as traffic-exposed. From time to time, samples were
Assessment of Air Quality in an Urban Area of Belgrade, Serbia 215
taken at a control suburban site in Zemun, on the right bank of the Danube River, near the
Institute of Physics (IF). During the sampling, meteorological parameters including
temperature, relative humidity, rainfall, wind direction and speed were provided by the
Meteorological Station of the Hydro-Meteorological Institute of the Republic of Serbia (H
s
=
132 m, ϕ = 44°48′ N and λ = 20° 28′ E), located inside the central urban area, very close (≈200
m) to the Autokomanda (VF) sampling site.
Suspended particles were collected on preconditioned (48
h
at 20˚C and constant relative
humidity around 50%) and pre-weighed Pure Teflon filters (Whatman, 47 mm diameter, 2
µm pore size) and Teflon-coated Quartz filters (Whatman, 47 mm diameter) using two
MiniVol air samplers (Airmetrics Co. Inc., 5 l min
-1
flow rate) provided with PM
10
and PM
2.5
cutoff inlets and positioned at 2 m height. The sampling time was 24 h, yielding a sample
volume of 7.2 m
3
. Routine maintenance of the samplers and calibration of the flow meters
were often conducted in order to ensure the sampling quality. After particle collection, the
filters were sealed in plastic bags and kept in portable refrigerators, in a horizontal position
during transportation back to the laboratory where they were reconditioned for another 48
h. The sampling methodology used in this study was described in detail by Rajšić et al.
(2004a).
2.1.2 Total Atmospheric Deposition
The total atmospheric deposition (TD) collection was performed using an open polyethylene
cylinder (29 cm inner diameter and 40 cm height) fixed in a basket on a pole 2 m above the
ground to avoid the collection of re-suspended dust from the surface. The devices collected
both dry deposition and precipitation continuously for 4 - week periods from June 2002 to
December 2006 Rector’s Office building, Botanic Garden (BG) and Autokomanda (VF) (Fig.
1). The collection bottles were filled before each sampling period with 20 ml of 10% HNO
3
(Suprapure, Merck).
2.1.3 Biomonitoring
Deciduous leaves for trace metal deposition and accumulation analyses were sampled from
horse chestnut (Aesculus hippocastanum L.) and Turkish hazel (Corylus colurna L.) trees in the
Belgrade urban area at three locations, BG, RB and VF (Fig.1). Leaf samples for the metal
accumulation study were collected at the beginning and the end of the seasonal vegetation
cycles. Ten leaves growing at 2 m height were cut off with Teflon coated stainless steel
scissors. Measurements were performed at the single leaf level. Each leaf was placed
horizontally in a polycarbonate Petri dish and transferred to the laboratory. Sampling and
handling of all plant material were carried out using polyethylene gloves and bags.
Collection of native moss, Brachythecium sp. (B. rutabulum and B. salebrosum) and
Eurhynchium sp. (E. hians and E. striatum), for passive biomonitoring of atmospheric trace
and other elements pollution was performed according to standardized procedure (UNECE
ICP Vegetation, 2003). Mosses were collected at two parks in Belgrade, IF and KP (Fig. 1),
within a 30 x 30 m area, at least 100 m away from main roads, and 50 m from smaller roads
and houses. The samples were taken at least 5 m from the base of any tree so as not to be
directly exposed to throughfall precipitation. In laboratory, the samples were carefully
cleaned from all dead material and attached litter, then only green and green-brown moss
upper parts up to two/three-years old were analyzed. The samples were dried for 48 h at
35°C to constant weight prior to analysis of elements content.
216 ENVIRONMENTAL TECHNOLOGIES: New Developments
2.1.4 Ozone
The tropospheric ozone concentrations were measured using UV photometric O
3
analyzer
Model 108-AH Dasibi Environmental Corporation, at the same points in Belgrade urban
ares as suspended particles, total atmospheric deposition and plant leaves in 2002. In June,
September and October, the measurements were conducted at 20 m above the ground, on
the roof of Belgrade University Rector's Office Building (RB), Student Square, Belgrade. In
July, the measurements were conducted at 3 m above the ground in Botanic Garden (BG). In
July, November and December, the measurements were performed at the height of 3 m on
the platform above the entrance stairs to the Faculty of Veterinary Medicine (VF).
2.2 Analytical Procedures
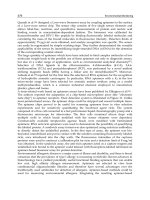
2.2.1 Mass Concentrations
Daily PM samples were handled and processed in a Class 100 clean laboratory, at the
Institute of Physics, Belgrade. Particulate matter mass concentration was determined by
weighting of the filters using a semi-micro balance (Sartorius, R 160P), with a minimum
resolution of 0.01 mg. Loaded and unloaded filters (stored in Petri dishes) were weighed
after 48 hours conditioning in a desiccator, in the clean room at a relative humidity of 45-
55% and a temperature of 20 ± 2 ˚C. Quality assurance was provided by simultaneous
measurements of a set of three ‘‘weigh blank’’ filters that were interspersed within the pre-
and post- weighing sessions of each set of sample filters and the mean change in “weigh
blank” filter mass between weighing sessions was used to correct the sample filter mass
changes.
2.2.2 Trace Metal Analysis
Atomic absorption spectroscopy (AAS)
The elemental composition (Al, V, Cr, Mn, Fe, Ni, Cu, Zn, As, Cd, and Pb) of the aerosol
samples and total atmospheric deposition, was measured by the atomic absorption
spectroscopy method (AAS). After completion of gravimetric analysis, PM samples were
digested in 0.1 N HNO
3
on an ultrasonic bath. An extraction procedure with dilute acid was
used for the evaluation of elements which can become labile depending on the acidity of the
environment. This procedure gives valid information on the extractability of elements, since
the soluble components in an aerosol are normally dissolved by contact with water or acidic
solution in the actual environment (Kyotani & Iwatsuki, 2002). Depending on concentration
levels, samples were analyzed for a set of elements by flame (FAAS) (Perkin Elmer AA 200)
and graphite furnace atomic absorption spectrometry (GFAAS) using the transversely-
heated graphite atomizer (THGA; Perkin Elmer AA 600) with Zeeman-effect background
correction. The THGA provided a uniform temperature distribution over the entire tube
length, rapid heating and an integrated L’vov platform, which gave an improved
signal/interference ratio and high analytical sensitivity. Analyte injection (20 µl) and the
atomization were done in five steps controlled by the appropriate software and auto-
sampler.
Total atmospheric deposition samples were evaporated to dryness, digested with 50 ml 0.1
N HNO
3
on ultrasonic bath, the digested solution was filtered through 0.45 μm porosity
Sartorius membranes and analyzed using a flame and graphite furnace atomic absorption
spectrometer. Laboratory blanks were analyzed in the same manner as field samples and
the heavy metal concentration values were below the detection limit values for all analyzed
Assessment of Air Quality in an Urban Area of Belgrade, Serbia 217
metals. Data treatment included the calculation of Al, V, Cr, Mn, Fe, Ni, Cu, Zn, As, Cd, and
Pb monthly deposition fluxes.
For calibration, standard solutions containing all metals of interest were prepared using
Merck certified atomic absorption stock standard solutions containing 1000 mg l
-1
metal in
0.5 N HNO
3
and Milli-Q quality deionized water, with no matrix modifier addition.
Detection limits for the trace elements were found to be: 0.04 ng ml
-1
for Cd, 0.1 ng ml
-1
for
Cr, 0.2 ng ml
-1
for Cu, 0.5 ng ml
-1
for Pb, 2 ng ml
-1
for Zn, 0.4 ng ml
-1
for Ni, 0.2 ng ml
-1
for
Mn, 5 ng ml
-1
for V, 0.5 ng ml
-1
for
Fe, 2 ng ml
-1
for Al, and 0.5 ng ml
-1
for As. Standard
practices for the handling of trace metal samples were implemented. For quality assurance,
NIST 2783 standard reference material was used.
Differential pulse anodic stripping voltammetry (DPASV)
Leaf samples were transferred to a Class 100 clean room under the specific conditions
required for analysis of low concentrations of trace metals (Vukmirović et al., 1997). Leaves
were rinsed in double distilled water, and the samples were then dried at 105 °C to constant
weight. Ashing was carried out for 6 hours at 450 – 500 °C, with a gradual temperature
increase of 50 °C per hour to eliminate organic matter without losing some constituents
from the samples by volatilization. The ash was dissolved in 0.1 N HNO
3
prior to analysis.
All chemicals and standard solutions employed were of ultra pure quality. An
electrochemical method, differential pulse anodic stripping voltammetry with a hanging
mercury drop electrode (DPASV) was used for determination of Cu, Zn, Cd and Pb contents
in a single leaf. Measurements were performed with an EDT, ECP 140 Polarograph and the
analytical technique was described in detail previously (Vukmirović et al., 1997; Tomašević
et al., 2004). The detection limits (ng ml
-1
) were 0.5, 1.0, 0.1 and 1.0 for Cu, Zn, Cd and Pb,
respectively.
Instrumental neutron activation analysis (INAA)
Heavy metal and other element concentrations in the native moss samples were determined
by instrumental neutron activation analysis (INAA). INAA was performed at the Frank
Laboratory of Neutron Physics, Joint Institute for Nuclear Research (FLNP JINR), Dubna,
Russian Federation (Frontasyeva & Pavlov, 2000). The moss was analyzed on 36 elements.
Approximately 0.3 g of well homogenized moss was taken for analyzing by INAA and most
element concentrations were determined with detection limits within the range of 0.01 - 10
μg g
-1
. The short-term irradiation (2 min) was used for short-lived radionuclides (Mg, Al, Cl,
K, Ca, Ti, V, Mn, I, and Dy). The long irradiation (100 h) was used to determine elements
associated with long-lived radionuclides (Na, Sc, Cr, Fe, Co, Ni, Zn, As, Se, Br, Rb, Sr, Mo,
Sb, Cs, Ba, La, Ce, Sm, Tb, Hf, Ta, W, Hg, Th, and U). Gamma-ray spectra were measured
four times using a high-purity Ge detector after decay periods of 5 and 10 min following the
short irradiation and after three and 20 days following the long irradiation, respectively.
The low temperature during irradiation of samples (60 – 70 °C) provides determination of
elements present in the samples in volatile form.
To provide quality control, content of elements yielding short- and long-lived isotopes in moss
samples was determined using certified reference materials
issued by the International Atomic
Energy Agency (IAEA): lichen (IAEA-336), cabbage (IAEA-359) and standard reference
material SRM-1575 (pine needles) from the National Institute of Standards and Technology
(US NIST).
For the short irradiation, the three reference materials were irradiated together
with 10 experimental samples. In the case of long irradiation, the three reference materials
were packed and irradiated together with 7 – 9 samples in each transport container.
218 ENVIRONMENTAL TECHNOLOGIES: New Developments
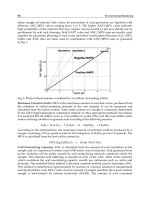
2.2.3 Scanning Electron Microscopy
Scanning electron microscopy (SEM) coupled with Energy-Dispersive X-ray analysis (EDX)
was used for the characterization (size, size distribution, morphology and chemistry of
particles) and source apportionment of suspended atmospheric particulate matter and
particles deposited on leaves.
One PM sample per sampling episode was analyzed with the SEM/EDX (JOEL JSM-5300 SEM)
according to the US-EPA Guidelines (2002). Prior to analyses three small sections of the filters (5
mm x 5 mm) were mounted on the SEM stubs and then coated with 10 nm layer of high purity
gold using vacuum evaporator (Balzers/Union FL-9496). The SEM observations were carried out
at magnifications up to 15,000X; the electron beam energy was 30 keV, and probe current of the
order of 100 μA. Ten photomicrographs were arbitrarily taken under low resolution conditions
and about 300 particles per PM sample were assessed for their morphology and about 50
particles for the X-ray spectral analysis. The elemental composition of selected particles in the
secondary electron images was deduced from an energy dispersive X-ray spectrum in the energy
range up to 20 keV, collected from the selected particles for a spectrum acquisition time of 100 s.
The elements observed were: C, N, Na, Mg, Al, Si, P, S, Cl, K, Ca, Ti, V, Cr, Mn, Fe, Ni, Cu, Zn,
As, Cd, and Pb, with detection limit of 1 wt % (Tasić et al., 2006).
An SEM Philips XL30 apparatus equipped with a thin-window EDAX DX4 system for energy
dispersive X-ray microanalysis was used to analyze the particles deposited on the leaf samples.
Leaf samples were dried in air in the clean room. To minimize charge build-up on the samples
from exposure to the SEM electron beam the samples were coated with (10 – 15) nm layer of high
purity carbon using vacuum evaporator (Balzers/Union FL-9496) prior to analyses. The SEM
observations were carried out at magnifications up to 2000X while the electron beam energy was
fixed at 20 KeV, and the working distance in most cases was about 10 mm and probe current was
100 pA. Particles were observed by backscattered electron images. Three different leaf discs of
the adaxial and abaxial surfaces for both tree species were examined in the same way. Ten
photomicrographs were randomly taken of each 0.03 mm
2
area at 624X magnification and about
1800 particles per species were assessed to their morphology and about 900 for X-ray spectra
analysis. For each tree species about 0.025% of the original leaf surface was examined.
An energy dispersive X-ray spectrum (EDS) was collected from the selected particles in the
range up to 15 keV for a preset time (live time) of 10 s to 20 s. The total X-ray count rate was
between 1000 and 2000 counts s
-1
. The relative elemental composition of the particles, were
computed directly with EDAX software, using the “ZAF'' (atomic number, absorption,
fluorescence) correction. As the particles deposited on leaves have complex shapes, quite
different from an ideal flat sample, there may be over- or underestimation of the actual atomic
concentration, but this does not prevent identification of the most important particle types.
Periodical checks of the X-ray by peak identification were conducted. EDX Spectrometer gain
calibration was accomplished using a gold/copper standard since X-ray lines from these two
elements span almost the entire spectral range of the detector.
2.3.4 Multivariate Receptor Modelling
Principal component analysis (PCA) and cluster analysis (CA) were used to identify the
possible emission sources of trace elements and correlations among them in suspended
particulate matter and total atmospheric deposits. The extracted principal components were
interpreted as source categories contributing to PM concentrations at the sampling site and
total deposition as well. The identification of source categories was done by examination of
the profiles of the principal components, i.e. loadings of the elements and other variables on
Assessment of Air Quality in an Urban Area of Belgrade, Serbia 219
the Varimax (orthogonally) rotated principal components. Factor loadings > 0.71 are
typically regarded as excellent and < 0.32 as very poor (Nowak, 1998). In this study, all
principal factors extracted from the variables with eigenvalues > 1.0 were retained,
according to the Kaiser criterion (Kaiser, 1960). When PCA with Varimax normalized
rotation was performed, each PC score contained information on the metal elements, while
the loadings indicated the relative contribution each element made to that score.
Cluster analysis (CA), as a complementary analysis to PCA, was performed to classify
elements of different sources further on the basis of their chemical properties. CA was
applied to the concentration data using Ward‘s method, with Euclidean distances as the
criterion for forming clusters of elements and also to determine when two clusters were
sufficiently similar to be linked. In general, this form of CA is regarded as very efficient,
although it tends to create small clusters. As the variables had large differences in scaling,
standardization was performed before computing.
2.3.5 Enrichment Factor
Enrichment factor (EF) analysis was used to differentiate between the elements originating
from human activities and those of natural origin and to assess the degree of anthropogenic
influence. By convention, the average elemental concentration of the natural crust is used
instead of the continental crust composition of the specific area, as detailed data for different
areas are not easily available. There is no rule for the reference element choice and Si, Al, and
Fe have been used as the most common elements for this purpose (Manoli et al., 2002; Gao et
al., 2002). In this study, Al was used as the reference element with upper continental crustal
composition given by Mason (1966). EF represents the ratio of the fraction of the element E
with respect to reference element R in the samples (aerosols, atmospheric deposition, moss…)
(E/R)
sample
to the fraction of E with respect to the same R in the crust (E/R)
crust
:
=
()
()
sam
p
le
crust
ER
EF
ER
(1)
According to the degree of enrichment the elements may be grouped as follows: highly
enriched (EF > 100); intermediately enriched (10 < EF < 100) and less enriched (EF < 10)
(Berg et al., 1994; Wang et al., 2005). If the EF approaches unity, the crustal material is likely
the predominant source for element; if EF > 1, the element has a significant fraction
contributed by non-crustal sources.
2.3.6 Air Back Trajectories
The analysis of air back trajectories for high PM concentrations episodes, in Belgrade, has been
performed. Theoretical and experimental evidence was based on numerical weather
prediction model and trajectory model so-called Eta model. The model used for simulation
and air back trajectory calculation in this study is a regional weather prediction primitive
equation model for synoptic and meso-scale processes (Mesinger et al., 1984, 1988, Janjić et al.,
1990, 1994). In this study model with 3.2 km horizontal resolution and 32 layers in the vertical
was used. The boundary conditions were updated every 6 hours obtained from European
Centre for Medium-Range Weather Forecast (ECMWF). Construction of three-dimensional
atmospheric trajectories provides a valuable diagnostic tool for illustrating and studying three-
dimensional flow fields and associated transports. Trajectories are calculated from simulated
wind fields, with both horizontal and vertical wind components derived from the Eta model.
220 ENVIRONMENTAL TECHNOLOGIES: New Developments
Trajectories can be calculated forwards and backwards in time. Air back trajectories are
calculated by specifying final parcel locations and time, and then tracing the parcels with
decreasing time to ascertain their origins. The model has been used for research in entire
Serbia region and boundary regions of the other countries in the neighborhood.
3. Results and Discussion
3.1 Particulate Matter
A first assessment of PM
10
and PM
2.5
particulate level in the ambient air of Belgrade
Daily mass concentrations of 96 PM samples (PM
10
and PM
2.5
) were determined by
gravimetric analysis of filters that were exposed to urban air in Belgrade during the year
2002. The PM
10
mean 24-hours mass concentration value, over whole measuring period was
77 μg m
-3
, almost twice as much as the annual limit in European Union (40 μg m
-3
) and 62%
of days had mean daily concentrations above limit value of 50 μg m
-3
. Average PM
2.5
mass
concentration exceeded the EC annual limit of 20 μg m
-3
(EN 14907, 2005) by a factor of 3
(Rajšić et al., 2004; Tasić et al., 2005).
PM
10
and PM
2.5
mass and trace metal concentrations
During the next sampling episode, between June 2003 and July 2005, daily mass (μg m
-3
) and
trace and other element (ng m
-3
) concentrations were calculated in PM
10
and PM
2.5
and already
presented in detail (Rajšić et al., 2007; Todorovic et al., 2007). A total of 273 (209 PM
10
and 64
PM
2.5
) valid samples were taken during the 2-year period. The high mean and maximum
levels of PM
10
and PM
2.5
were observed; the PM
10
mean mass concentration during the 2-year
period (68.4 μg m
-3
) exceeded the proposed EC annual limit of 40 μg m
-3
(EC, 1999). Of more
concern was the average PM
2.5
concentration of 61.4 μg m
-3
for the 2-year period, which was
three times higher than the EC annual limit of 20 μg m
-3
(ES 14907, 2005)
The results for the total mean concentrations of individual metals indicate iron as the most
abundant metallic element (1462.9 ng m
-3
) in the PM
10
. Zinc and Al concentrations in this
fraction were very high, amounting to 1389.2 ng m
-3
and 873.8 ng m
-3
, respectively. The
highest mean concentration in PM
2.5
was
for Zn (1998.0 ng m
-3
), followed by Al (1180.3 ng m
-
3
) and Fe (1081.2 ng m
-3
). Zinc is reliable tracer of unleaded fuel and diesel oil powered
motor vehicle emissions (Monaci et al., 2000) and besides, it could be released in large
amounts from tired friction or various industrial activities. Concerning Cu, a heavy metal
characterized by its toxicity, relatively high mean values of 71.3 ng m
-3
in PM
10
and 20.8 ng
m
-3
in PM
2.5
were obtained. This trace element is associated with industrial activities, but in
urban areas, road traffic (diesel engines and wearing of brakes) could be the most important
source. Aluminum concentration was higher in PM
2.5
than in PM
10
. Although Al and Fe are
typically crustal elements, if coupled with other elements, they can indicate the presence of
anthropogenic sources, such as the steel production industry. The mean Ni concentration of
28.4 ng m
-3
in the PM
2.5
fraction was above the target value of 20
ng m
-3
for PM
10
(Directive
2004/107/EC). Mean concentrations of V (36.6 ng m
-3
), Mn (20.8 ng m
-3
), Cd (1.4 ng m
-3
),
and Pb (46.5 ng m
-3
), did not exceed the current air quality guideline values (WHO, 2002).
The seasonal variations of the trace metals in PM
10
and PM
2.5
were also analyzed. In winter,
when domestic heating becomes a significant source of particles in the area, the amounts of
all elements were elevated. The sources for the elements exhibiting winter enrichment are
mostly connected with fossil fuel combustion in heating units. The exceptions were Cr, Cu,
and Cd, which suggests that some local industrial source of these elements is more
influential during the summer.
Assessment of Air Quality in an Urban Area of Belgrade, Serbia 221
3.2 Total Atmospheric Deposition
A total of 141 atmospheric deposits was collected monthly from June 2002 to Decembar 2006
in three sites in the urban area of Belgrade - RB, BG and VF (Fig. 1) and trace and other
metal (Al, V, Cr, Mn, Fe, Ni, Cu, Zn, As, Cd, and Pb) monthly fluxes calculated. Table 1
presents average daily atmospheric deposition of heavy metals (μg m
-2
day
-1
) in the
Belgrade urban area for all sampling sites for the period of 2003 to 2006
.
Al V Cr Mn Fe Ni Cu Zn As Cd Pb
RB 807.13 40.20 1.91 64.08 1723.19 23.92 113.03 117.65 1.59 0.58 55.67
BG 976.60 49.66 2.32 78.95 2062.74 29.07 61.84 138.24 9.78 0.58 62.35
VF 1071.59 58.89 2.77 88.84 2549.86 38.64 97.22 148.19 40.43 0.70 74.18
Table 1. Average daily atmospheric deposition of heavy metals (μg m
-2
day
-1
) in the Belgrade
urban area for 2003 – 2006
Besides Fe and Al, the most abundant trace metal in bulk deposition was Zn, followed in
order of abundance by V, Mn, Ni, Cu, Pb, As, Cr and Cd. Cu and Zn have multiple
anthropogenic sources, including high temperature combustion processes and the most
probable source of Cu and Zn enrichment are vehicle-related particles. The impact of
human activities could be seen on several metals like Zn, Cu, Pb, Cd, Mn, Al, Cr, and Fe.
This influnce was more obvious for Cu, Cd and Pb which have only anthropogenic sources,
while other four metals originate from many natural sources as well (Pacyna & Pacyna,
2001).
As expected, the TD values were highest at Autokomanda site (VF) for almost all metals
except Cu. High Zn and Cu fluxes in total deposition samples could also be related to roof
covering of Zn metal sheets nearby and could point to the presence of point sources, which
are clearly site specific. High deposition of Cu in samples at Rector’s Office building (RB)
comparing to other locations indicates the possible local source influence.
Seasonal variation for element concentrations in bulk deposition have been analysed.
Maximum concentrations of V (Fig. 2) and Ni were in winter periods, while seasonal
variations of the other elements were not pronounced.
0
50
100
150
200
250
300
350
Jul-02
Se
p
Nov
Jan-03
A
pr
Jun
Aug
Oct
Jan-04
Mar
May
J
ul
Se
p
Nov
Jan-05
Mar
Ma
y
Aug
Oct
Dec
Feb-
06
A
pr
Jun
A
u
g
Oct
RB
BG
VF
Atmospheric deposition [
μ
g m
-2
day
-1
]
Fig. 2. Seasonal variation for V concentrations in total atmospheric deposits in Belgrade
urban area for the period July 2002 - November 2006
222 ENVIRONMENTAL TECHNOLOGIES: New Developments
3.3 Biomonitoring
3.3.1 Higher plants
The level of trace metals, particularly Pb, accumulated in the leaves of A. hippocastanum
showed a high correspondence to their increased atmospheric concentrations, indicating
this plant species as suitable biomonitor for trace element atmospheric pollution (Tomašević
et al., 2004)
The results, presented on Fig. 3, illustrate this correspondence in two successive
experimental years with different traffic and industrial emissions. Trace metal
concentrations of Cu, Zn, Cd and Pb in the leaves from A. hippocastanum and C. colurna were
analyzed at the beginning and in the end of the vegetation periods.
Concentrations of Cd
(0.02 to 0.06 μg g
-1
) were below the detection limit in most of the samples. The increased
atmospheric trace metal concentrations in the Belgrade down-town area affected their
amounts found in the investigated deciduous tree leaves. While the average accumulations
of trace metals in C. colurna were very similar for both experimental years, the levels found
in A. hippocastanum leaves were considerably higher in September 1997 as compared to
September 1996.
Fig. 3. Chemical fingerprints of Aesculus hippocastanum after normalization against the
"Reference plant"
system for comparison (Markert, 1992)
Similarly, over the same time interval, higher concentrations of the investigated trace metals
were also found in the water-soluble fraction of deposits on leaves of A. hippocastanum in
comparison to C. colurna (Tomašević et al., 2005).
Fig. 3 shows “the chemical fingerprints” of A. hippocastanum obtained for the second
experimental year as normalized against the “reference plant“ system for comparison
(Markert, 1992). In both years, Pb concentrations were much higher than the "reference
plant" value, and markedly increased in the second experimental year. As the chemical
fingerprint may be assumed to represent the background concentrations, it offers some
advantages for a quick assessment of the pollution level and allows comparison between
different species and vegetation types, such as mosses, herbaceous plants and trees
(Markert, 1992; Djingova et al., 1994).
Assessment of Air Quality in an Urban Area of Belgrade, Serbia 223
Metal uptake in higher plants takes place through the roots and somewhat via the leaves,
which makes it difficult to distinguish whether the accumulated elements in leaves originate
from the soil or from the air (Markert, 1993; Bargagli, 1998; WHO, 2000). Pb in leaves is
considered to originate mainly from atmospheric deposition (Tjell, 1979; Harrison&
Johnston, 1987), while the soil contributes to Cu and Zn in leaves (Kim&Fergusson, 1994;
Palmieri et al., 2005). As there were hardly any other emission sources during the
investigated vegetation seasons, the results obtained here may suggest that the Pb found in
the leaves mainly originated from traffic emissions. Unfortunately, leaded gasoline is still
the prevailing traffic fuel in Belgrade, and many diesel engine vehicles are old and not
maintained well. In the second experimental year Zn concentrations increased in A.
hippocastanum leaves, while no increase occurred in the leaves of C. colurna. This result also
implies a species-specific element accumulation. Moreover, the highest Pb concentrations in
leaves also occurred in A. hippocastanum among a group of urban deciduous tree species in
Istanbul (Baycu et al., 2006).
3.3.2 Moss
The element concentrations in both investigated moss genera, Brachythecium sp. and
Eurhynchium sp., were at a similar level (Table 2). For a majority of the 36 determined
elements, the difference between the moss contents in the two genera was within the range
of specific experimental error, except for Co, Ta, Ce, Sm, Tb, Th, and U which concentrations
were close to the detection limits of used INAA, and hence it would not be reasonable to
compare such data (Aničić et al., 2007). The previous result suggests that both moss species,
found in sufficient quantity for sampling in the urban area of Belgrade, could be combined
for biomonitoring purposes.
Especially interesting for evaluation, as carcinogenic and toxic elements (EEA, 2005), have
been the obtained moss concentrations of V, Cr, Ni and As. The median values of these
elements in native moss samples from this study were presented in relation to some other
corresponding data (UNECE ICP Vegetation, 2003) as shown in Fig. 4.
0
2
4
6
8
10
12
14
16
VNiCrAs
Concentration [ μg g
-1
]
Belgrade
Bor copper basin
Serbia
Bosnia
Macedonia
Bulgaria
Romania
Hungaria
Norway
Fig. 4. Median concentrations (μg g
−1
) of V, Cr, Ni and As in moss from Belgrade area and
some European countries
Such comparison gave an insight into a level of heavy metal and other element air pollution
in Belgrade urban area in relation to the highest polluted industrial area in Serbia (Bor
copper basin), base-level moss content (data from Norway) and the concentration levels in
224 ENVIRONMENTAL TECHNOLOGIES: New Developments
adjacent countries. In general, the concentrations of V, Cr, Ni, and As obtained for the
Belgrade urban area correlated to the results from the neighbouring countries where fossil
fuel is still a major energy source resulting in higher heavy metal and other element air
pollution. However, the moss content for the above-mentioned elements was up to 10 fold
higher than background levels (Norway).
Zemun Kalemegdan Park
Element
Brach.sp. Eurhin.sp. Brach.sp. Eurhin.sp.
Na
545 757 313 307
Mg
16950 22760 10173 8290
Al
5000 6685 2147 1940
Cl
642 565 817 332
K
10705 10637 9760 7264
Ca
12590 14937 18647 12340
Sc
0.90 1.0 0.27 0.33
Ti
329 539 137 160
V
10.0 14 9.9 9.5
Cr
7.0 9.2 4.5 4.5
Mn
90 114 56 57
Fe
3000 3504 1057 1295
Co
0.80 1.3 0.42 0.68
Ni
8.2 13 6.8 9.2
Zn
34 37 41 40
As
0.95 1.6 1.0 1.1
Se
0.06 0.09 0.12 0.14
Br
1.8 2.5 2.9 3.7
Rb
8.1 11 6.7 7.7
Sr
29 36 50 42
Mo
0.52 0.59 1.2 0.75
Sb
0.18 0.22 0.29 0.35
I
0.19 0.26 0.30 0.31
Cs
0.39 0.59 0.22 0.22
Ba
44 64 33 28
La
3.0 3.7 1.1 1.5
Ce
3.9 7.0 1.7 3.1
Sm
0.40 0.77 0.20 0.25
Tb
0.05 0.09 0.02 0.03
Dy
0.81 1.2 0.42 0.38
Hf
0.42 0.78 0.22 0.24
Ta
0.05 0.10 0.02 0.03
W
0.32 0.29 0.16 0.19
Hg
0.48 0.43 0.18 0.38
Th
0.62 1.1 0.27 0.34
U
0.07 0.14 0.23 0.10
Table 2. The element concentrations (μg g
−1
) in Brachythecium sp. and Eurhynchium sp. at
Zemun and Kalemegdan Park
3.4 Factor Analysis
Principal Component Analysis (PCA) with Varimax rotation on the dataset of selected
metals and particle mass concentrations in PM
10
and PM
2.5
was performed for the source
identification. Table 3 presents four rotated factor loadings with eigenvalues >1, embodying
and explaining more than 73% of total variance for the case of PM
10
. The first factor,
Assessment of Air Quality in an Urban Area of Belgrade, Serbia 225
explaining most of the variance (26%), has high loadings for Mn, Zn, Fe, Al, and Ni, can be
attributed to road dust. Its bulk matrix is soil, while correlation with other metals indicates
some other sources, such as tire tread, brake-drum abrasion, yellow paint, etc. Therefore,
this factor is interpreted as representing road dust resuspension, which includes soil dust
mixed with traffic related particles. Zn could be released from wear and tear of vulcanized
vehicle tires and corrosion of galvanized automobile parts (Li et al., 2002, 2003;
D`Alessandro, 2003). Adriano (2001) also reported that corrosion of galvanized steel is a
major source of Zn emission in the surface environment. This is probably a significant
source, as numerous old tracks, buses, cars and tires are present on the Belgrade streets. The
second factor, with 17% of the total variance, shows high loading for fuel oil markers V and
Ni. The third factor, including Cu, Cd and Pb, also accounted for 17%, while Factor 4
accounted for 13% with Cr and Pb as the main components. Factor 3 may be associated with
road traffic emission. Cu and Cd are associated with diesel engines and wearing of brakes.
Pb probably comes from exhaust emission, since road vehicles use leaded gasoline or diesel
fuel. Factor 4 with the Pb component is most likely due to traffic exhausts.
PM
10
PM
2.5
Total atmospheric
deposition
Fac 1 Fac 2 Fac 3 Fac 4 Fac 1 Fac 2 Fac 3 Fac 4 Fac 1 Fac 2 Fac 3
Pb -0.07 0.04 0.41
0.72
0.27
0.85
-0.05 0.06 0.51 0.31
0.56
Cu 0.01 0.13
0.86
0.02 -0.1 0.14 0.46
0.78
-0.08 0.1
-0.74
Zn
0.78
0.09 -0.12 0.01
0.85
0.17 0.25 -0.24
0.96
-0.08 -0.02
Mn
0.84
0.16 0.08 0.27
0.8
0.22 0.27 0.03
0.76
0.27 0.32
Fe
0.77
-0.03 0.04 -0.13
0.78
0.16 -0.09 0.16
0.75
0.42 0.11
Cd -0.08 -0.11
0.79
0.03 0.1 -0.25 -0.36
0.79 0.64
0.48 0.02
Ni 0.32
0.85
0.19 -0.01 0.06 0.1
0.88
0.08 0.25
0.84
-0.11
V 0.02
0.94
-0.13 -0.05 0.3 -0.15
0.71
-0.11 0.26
0.86
0.22
Al
0.74
0.23 -0.14 0.22
0.84
0.09 0.08 -0.01
0.71
0.49 0.13
Cr 0.24 -0.11 -0.2
0.81
0.16
0.91
0.05 -0.15 -0.01 0.71 0.57
As - - - - - - - - 0.42 0.66 -0.33
%Variance 26.1 17.4 16.8 13.2 29 17.8 17.7 13.5 32.3 29.3 13.4
PCA loadings > 0.5 are marked in bold
Table 3. Principal component analysis after Varimax rotation for the trace elements analyzed
in PM
10
, PM
2.5
and total atmospheric deposition
PCA analysis and the following Varimax rotation were conducted on element
concentrations dataset in total deposits. Three factor loadings explaining 75% of total
variance are presented in Table 3. The first factor has high loadings for most of the elements
and represents resuspended road dust, which includes soil dust mixed with traffic related
particles. Factor 2 has high loading for Ni, V, As and Cr emitted from fossil fuel combustion
processes and Factor 3 has high loadings for Pb and Cu. Cu shows the most independent
behavior as it is almost on the third factor with negative loading indicating its specific
source.
The results of CA for the variables, trace elements in PM, were obtained as dendograms
displaying four main clusters. In the dendogram for PM
10
(Fig. 5a) the first group containing
226 ENVIRONMENTAL TECHNOLOGIES: New Developments
the variables Pb and Cu with Cd, is associated with traffic emissions; the second group
includes Zn and Fe mostly originating from abrasion of mechanical parts of road vehicles.
The third cluster containing Ni and V is mainly associated with oil burning and emission
from heavy fuel oil, while the fourth group includes Mn, Al and Cr with a soil origin. All
groups are connected at some distance, suggesting that the main sources of metals in PM
10
are fossil fuel combustion (traffic or stationary units) and resuspended dust, which is a
mixture of soil and road dust.
The dendogram for trace elements in PM
2.5
(Fig. 5b) points to several groups connected to
each other at some distance. The first group contains only Pb and Cr, probably from leaded
gasoline vehicular exhaust and may be also from the oil refinery in Pančevo, 25 km
northeast of Belgrade. The second group containing Zn and Mn is closely connected with Al
and Fe and, all together, they represent road dust. The third group includes Cu and Cd and
is connected with the fourth group (V and Ni) at a higher level suggesting perhaps a
common source. These results imply that the main source of trace elements in urban PM
2.5
is
traffic, with a considerable portion of resuspended road dust, and products of other fossil
fuel combustion processes.
The results of cluster analysis on trace metals in PM
10
, PM
2.5
and total atmospheric
deposition (Fig. 5c) are in good agreement with PCA and correlation study, showing that
metals with common sources have a strong inter-relationship; emission of metals most
associated with traffic (Zn, Cu, Fe, Mn, Pb, Al) is probably more related to suspension or
resuspension of road dust, which includes soil dust mixed with traffic related particles, than
to direct exhaust emission (Vukmirović et al., 1997; Rajšić et al., 2006).
a) b)
PM
10
Linkage distance
Cr
Al
Mn
V
Ni
Fe
Zn
Cd
Cu
Pb
0 5 10 15 20 25
PM
2.5
Linkage distance
V
Ni
Cd
Cu
Fe
Al
Mn
Zn
Cr
Pb
2 4 6 8 1012141618
Total atmospheric deposition
Linkage distance
Cu
As
V
Ni
Cr
Pb
Al
Mn
Zn
Cd
Fe
4 6 8 10 12 14 16 18
c)
Fig. 5. Dendogram resulting from Ward’s method of hierarchical cluster analysis of the trace
elements in PM
10
(a); PM
2.5
(b) and total atmospheric deposition (c)
Assessment of Air Quality in an Urban Area of Belgrade, Serbia 227
3.5 Enrichment Factor
Enrichment factors (EFs) for the mean concentration of trace elements in suspended
particles, PM
10
and PM
2.5
, total atmospheric deposition and moss samples were calculated
according to the earth’s crustal mean abundances of the elements given by Mason (1966)
and using Al as a reference element and presented in Fig. 6.
The EF sequence related to particulate matter in the Belgrade urban area for the sampling
period was: Zn > Cd > Pb > V > N > Cu > Cr > Mn > F e> Al. The highly enriched elements,
primarily emitted from high-temperature processes (e.g. fossil fuel combustion and
smelting), are usually associated with small and medium sized aerosol particles, and can be
transported to remote areas.According to the degree of enrichment, the elements are
grouped as follows (Wang et al, 2005): Zn, Cd and Pb, elements with a toxic character, were
highly enriched (EF > 100) confirming that anthropogenic sources prevail over natural
inputs for these elements; Cu was intermediately enriched (EF between 10 and 100); EFs for
V and Ni were higher than 10 during the heating season and in the PM
2.5
fraction; Cr was
less enriched (EF less than 10) probably attributed to both natural and anthropogenic
sources. EF values higher than 1 were found for Mn and Fe, suggesting a mainly crustal
origin, although an earlier analysis implicated an important influence of anthropogenic
sources on the amounts of these metals. Because dilute acid was used for the extraction, the
concentrations would be slightly underestimated for some common crustal elements,
especially for the coarse particle size range (Pakkanen et al., 1993, 2003).
For total atmospheric deposition, the calculated enrichment factors for trace elements show
the same pattern as in the particulate matter. Additionally, As (484) and Cu (155) were
highly enriched.
1
10
100
1000
10000
Al Fe Mn Cr Ba K Mg Ca I Mo Ni V Br Sb Hg Se Cu Cl Pb As Cd Zn
Element
Enrichment Factor
PM PM
TD MOSS
10 2.5
Fig. 6. Enrichment factor (EF) of elements in PM
10
, PM
2.5
, total atmospheric deposition and moss
High EFs for K, Mg, Ca, As, I, Zn, Mo, Br, Sb, Se, Hg and Cl (from 14 to 238) in moss
samples were calculated. The highest EFs in moss samples were observed for Cl, Hg and Se
which are important tracers for coal combustion (Watson et al., 2001). The fuel used in the
complex of coal-fired power plants, 20 km SW from Belgrade, as well as for local domestic
heating in Belgrade, is mainly lignite-brown coal (high in As) or crude oil. These fuels are
228 ENVIRONMENTAL TECHNOLOGIES: New Developments
significant sources of the enriched elements at studied sites (Rajšić et. al., 2004). Elements
such as Br, Sb, As, Mo and Zn are considered as indicators of emission from fossil fuel
combustion processes, including vehicle exhausts (Arditsoglou & Samara, 2005; Pacyna &
Pacyna, 2001). Kalemegdan Park is surrounded with heavy traffic roads, with trucks very
frequently present. Leaded gasoline and diesel fuel (still widely used in Belgrade) contain a
large amount of Br and Mo (Pacyna & Pacyna, 2001).
Tire and brake lining wear as well as other metallic parts of vehicles might be a significant
source of Sb (Arditsoglou & Samara, 2005). Concentrations of the enriched elements from
this study were in accordance with some previous investigations of air quality of the urban
Belgrade in the vicinity of Kalemegdan Park (Tomašević et al., 2004; 2005; Vukmirović,et al.
, 1997).
3.6 Correlation Factors
In order to investigate the extent to which metal concentrations are related to road traffic,
the relevant data set for carbon monoxide (CO), nitrogen oxides (NO
x
) and sulphur dioxide
(SO
2
) for the whole PM sampling period were provided by the Institute of Public Health of
Belgrade and correlated with PM data. Pearson’s correlation coefficients between
meteorological parameters, combustion-related gases, PM mass and trace element
concentrations in PM
10
and PM
2.5
were calculated, and presented in Table 4. As products of
fossil fuel combustion, CO, NO, NO
2
, and SO
2
were the most closely correlated (r = 0.70 to
0.95). The highest correlations among the trace elements in PM
10
were between V and Ni (r =
0.69) (elements associated with oil combustion), Al and Mn, elements of mostly crustal
origin, as well as Zn - Mn and Fe - Mn (emission from traffic and possibly steel production).
Copper was most correlated to Cd, which could have originated from brake linings and coal
combustion in stationary sources, or some local industry. The mass concentration of PM
10
was mainly correlated to the concentrations of gases related to combustion processes and,
among the trace elements, to V as a product of fossil fuel combustion.
Higher correlation was found during the winter, with the most significant correlation
coefficient between V and Ni (r = 0.72), while for Pb - Cu the correlation coefficient was 0.56.
Pb was also significantly correlated with gases, Cd and Cr. Copper was more closely
associated with Pb, than with Cd and gases, which are good indicators of combustion-
related sources. These correlations support the recent finding that Cu is one of the metals
most closely related to vehicle circulation in urban areas. Zinc was more correlated with Cr
(r = 0.65) than with Mn, Al, Fe and Ni.
Generally, mass concentrations of PM
2.5
were positively correlated with the pollution gases, CO
(r = 0.80), NO (r = 0.74), NO
2
(r = 0.70) and SO
2
(r = 0.65) as well as V (r = 0.40). The correlation
of NO
2
with particle mass was more prominent than for SO
2
, showing that particles from traffic
emissions predominated. Lead was most closely connected to Cr, Zn to Mn and Al.
Regarding correlations between metal concentrations and wind speed, only Cu and Cd in
PM
2.5
were significantly negatively correlated with wind speed, suggesting that Cu and Cd
are mostly from local sources. Vanadium and Ni were strong negatively correlated with
temperature. This result supports the presumption that those elements originate from
combustion of fossil fuels in heating units. The absence of good correlations between Pb and
most meteorological parameters (temperature, relative humidity and wind speed) suggests
that those factors may not be influential enough to control the Pb levels.
The analysis of the correlation coefficients between all metal fluxes (Table 5) in total
deposition (TD) have shown the similar connections as in the case of PM (Fe - Mn=0.61, V -
Assessment of Air Quality in an Urban Area of Belgrade, Serbia 229
Ni=0.68, As - Ni=0.65; Zn - Fe=0.57, Ni - Cd=0.58). As in the case of PM
10
, high correlation
between V and Ni was obtained indicating the origin in oil combustion processes.
PM
10
P
a
T
max
T
RH W
av
Pb Cu Zn Mn Fe Cd Ni V Al Cr NO NO
2
SO
2
CO
PM
10
1.00
0.27 -0.28-0.30
0.00
-0.26 0.15 0.19
0.11
0.35 0.25
-0.02
0.36 0.44 0.15
-0.11
0.58 0.39 0.56 0.61
P 1.00
-0.30-0.31
0.00
-0.34
-0.02-0.03 0.05 0.12
0.16
0.01 0.05 0.09 0.00
-0.20 0.18
0.07
0.25
0.12
T
max
1.00
0.99 -0.50
-0.12 0.05 0.09
-0.25
-0.02 0.01 0.01
-0.45 -0.54-0.21 0.19
-0.07
0.32 -0.30
0.02
T
1.00
-0.45
-0.14 0.03 0.10
-0.27
-0.05 0.00 0.00
-0.46 -0.55-0.23 0.19
-0.09
0.29 -0.32
0.00
RH 1.00
-0.17
-0.04 0.08 -0.10
-0.21-0.21
0.10
0.25 0.34
-0.03-0.07 0.10
-0.34
0.03 0.07
W
s
1.00 -0.07-0.14
0.18
-0.12 -0.09-0.05-0.01-0.11 0.02 0.02
-0.24 -0.24
-0.06
-0.25
Pb 1.00
0.28
-0.02
0.16
-0.01
0.25
0.04 -0.03 0.00
0.25 0.17 0.28
0.12 0.12
Cu 1.00 -0.13 0.12 0.02
0.45 0.29
-0.04-0.07 -0.09 0.13
0.14
0.07 0.11
Zn 1.00
0.56 0.41
-0.09
0.31
0.11
0.54 0.16 -0.22 -0.19
-0.10
-0.15
Mn 1.00
0.55
-0.05
0.37 0.15 0.66 0.35
-0.02 0.02 0.01 0.12
Fe 1.00-0.12
0.24
0.05
0.36
0.10 0.01 0.01 0.01 0.03
Cd 1.00 0.02
-0.14
-0.10 -0.08 -0.02 -0.07 0.01 -0.05
Ni 1.00
0.69 0.35
0.01 0.07 -0.07
0.16
0.08
V 1.00
0.22
-0.12
0.19
-0.03
0.30 0.18
Al 1.00
0.30 -0.15 -0.18
-0.08 -0.03
Cr 1.00 -0.14 0.10 -0.07 0.01
NO 1.00
0.73 0.83 0.94
NO
2
1.00
0.70 0.67
SO
2
1.00
0.71
CO 1.00
a)
PM
2.5
P
a
T
max
T
av
RH W
av
Pb Cu Zn Mn Fe Cd Ni V Al Cr NO NO
2
SO
2
CO
PM
2.5
1.00 0.01 -0.29-0.30 0.06 -0.17 0.19 0.20 -0.17-0.03 -0.16-0.14
0.26
0.40 -0.16-0.17
0.74 0.70 0.65 0.80
P 1.00 -0.16-0.15-0.04-0.20-0.25-0.06
-0.35-0.28
-0.17
0.34
-0.13-0.15
-0.37-0.33
0.14 0.14 0.22 0.04
T
max
1.00
0.99 -0.68
0.08 -0.12-0.13-0.07-0.19 0.07
-0.28-0.29 -0.55
-0.20 0.14 -0.02 0.08 -0.23 -0.02
T
av
1.00
-0.65
0.05 -0.14-0.11-0.09-0.21 0.08 -0.25
-0.28-0.56
-0.20 0.13 -0.04 0.06 -0.25 -0.04
RH 1.00 -0.26 0.08 0.18 -0.11 -0.05 0.00
0.27 0.27 0.37
0.21 -0.18 0.01 -0.20 0.02 -0.02
W
av
1.00 0.14
-0.36
0.03 -0.01-0.11
-0.34
-0.01-0.19 0.02
0.28
-0.19 -0.15 -0.07 -0.17
Pb 1.00 0.04 0.15
0.25
0.08 -0.12 0.04 0.10 0.20
0.56
0.12 0.14 0.13 0.16
Cu 1.00 0.04 0.08 0.04 0.20
0.49
0.16 0.01 0.08 0.13 0.06 0.18 0.14
Zn 1.00
0.82 0.48
0.12 0.08 0.00
0.66 0.37 -0.31
-0.18 -0.24 -0.19
Mn 1.00
0.37
-0.05 0.17 0.23
0.50 0.34 -0.25
-0.06 -0.14 -0.15
Fe 1.00
0.29
-0.13-0.17
0.43
0.22 -0.17 -0.11 -0.19 -0.08
Cd 1.00 -0.24 -0.21 0.14 -0.01-0.22
-0.36
-0.08 -0.15
Ni 1.00
0.50
0.02 -0.03 0.01 0.07 -0.01 0.02
V 1.00 0.07
-0.26
0.04 0.05 0.07 0.08
Al 1.00 0.17 -0.24 -0.20 -0.22 -0.14
Cr 1.00 -0.15 -0.05 -0.07 -0.14
NO 1.00
0.90 0.85 0.95
NO
2
1.00
0.86 0.86
SO
2
1.00
0.80
CO 1.00
b)
P
a
- atmospheric pressure; T
max
- maximal temperature; T - temperature; RH-relative humidity; W
s
–
daily wind speed
Correlation coefficients significant at 0.05 level are marked in bold
Table 4. Pearson’s correlation coefficients between meteorological parameters, combustion-
related gases, mass and trace element concentrations in PM
10
(a) and PM
2.5
(b)
230 ENVIRONMENTAL TECHNOLOGIES: New Developments
Fe Cd Pb Cu Ni Zn Cr Mn Al V As
Fe 1.00
0.49 0.44 -0.18 0.57 0.57 0.45 0.61 0.78 0.63 0.58
Cd 1.00
0.39
0.15
0.58 0.33 0.30 0.41 0.51 0.57 0.48
Pb 1.00 -0.05
0.29
0.08
0.20 0.34 0.46 0.41 0.21
Cu 1.00 0.01 -0.15
-0.20 -0.19
-0.12 -0.07 0.11
Ni 1.00 0.15
0.28 0.32 0.65 0.68 0.65
Zn 1.00
0.26 0.59 0.54 0.17 0.35
Cr 1.00
0.58 0.45 0.55 0.25
Mn 1.00
0.65 0.40 0.40
Al 1.00
0.61 0.50
V 1.00
0.57
As 1.00
Correlation coefficients significant at 0.05 level are marked in bold
Table 5. Pearson’s correlation coefficients of trace element concentrations in total
atmospheric deposition
3.7 Air Back Trajectories
During the period of June 2002 to December 2004 the PM
10
and PM
2.5
mass concentrations in
Belgrade urban area had high average values (83 and 75 µg m
-3
), and 72% of PM
10
samples
exceeded the level of 50 µg m
-3
. To make an identification of possible pollution sources and
assess the influence of meteorological parameters on PM mass concentrations, air back
trajectories for high PM concentrations episodes were analyzed (Mijić et al., 2006). Three
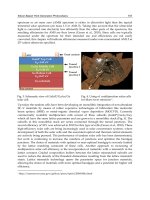
selected, sixty hours backward trajectories, starting at 12 00 UTC, are shown on Fig. 7.
Fig. 7a shows backward trajectories calculated for 21/12/2002., when the highest mass
concentration occurred (362 µg m
-3
). This case was characterized by anticyclone (1030 mb) at
the surface and very slow flow caused by small gradient of the pressure field. Wind varied
from north at higher levels, over western and southwestern at low levels (contribution from
the complex of coal power plant in Obrenovac).
The episode for 2/4/2005 (Fig. 7b) was characterized with trajectories which at all levels
show very weak flow changing from north-eastern at higher levels to eastern at lower levels
(Pančevo). Synoptic situation was characterized by ridge of high pressure (1020 - 1025 mb)
from the north, with weak pressure gradients caused by eastern flow in our region.
On Fig. 7c, trajectories corresponding to 27/11/2005 are placed from south-western
direction at highest levels to south-eastern direction at lowest levels (Smederevo). They are
presented for the last 12-20 h only, because the flow is strong at all levels, and particles
quickly leave domain. Synoptic situation: A cyclone is placed on the west of the domain,
caused southern magnified flow in the region of interest. Calm wind conditions were found
to have an increment effect on particle concentrations and were also associated with the
appearance of persistent episodic events. All cases analysed in this study were characterized
by very slow flow field caused by small gradient of the pressure field. At the surface layer
high pressure was placed over observed region.
The main sources of particulate matter were of local origin: traffic emission, and individual
heating emissions. When the air masses were coming from the SW direction, the
contribution from the power plants in Obrenovac was also evident, from NE-E contribution
of Pančevo-rafinery and chemical industry, and from SE direction influence of Smederevo-
steel industry. Episodes of high mass PM concentrations were observed in Belgrade
throughout the year, although, they were more prominent during winter period. The
prevalence of stagnant or week flow regimes favors the suspension and accumulation of
particles produced locally, resulting at the elevation of PM levels.
Assessment of Air Quality in an Urban Area of Belgrade, Serbia 231
16E 18E 20E 22E 24E 26E 28E
37N
38N
39N
40N
41N
42N
43N
44N
45N
46N
47N
48N
49N
50N
60h
50h
60h
54h
46h
45h
54h
47h
54h
49h
54h
49h
54h
48h
54h
48h
42h
48h
42h
24h
22h
48h
42h
36h
30h
24h
22h
48h
42h
36h
30h
24h
22h
Latitude [
0
]
Longitude [
0
]
Belgrade
Vienna
Athens
Bucharest
2534 m
2216 m
1918 m
1640 m
1380 m
1139 m
916 m
710 m
350 m
275 m
163 m
a)
16E 18E 20E 22E 24E 26E 28E
37N
38N
39N
40N
41N
42N
43N
44N
45N
46N
47N
48N
49N
Zagreb
Belgrade
Athens
Bucharest
Vienna
54
48h
43
56h
48h
42h
34h
52h
42h
32h
22h
52
42
32
22
12
52
42
32
22
12
6
52
42
32
22
16
52
42
32
24
52h
42h
34h
24h
48h
40h
32h
24h
16h
54h
44h
36h
28h
20h
52
42
54
Latitude [
0
]
Longitude [
o
]
2534 m
2216 m
1918 m
1640 m
1380 m
1139 m
916 m
710 m
350 m
275 m
199 m
163 m
b)
16E 18E 20E 22E 24E 26E 28E
37N
38N
39N
40N
41N
42N
43N
44N
45N
46N
47N
48N
49N
Zagreb
Belgrade
Athens
Bucharest
Vienna
57h
55h
53h
56h
53h
58
56
54
56
53
60
56h
53h
52h
56h
52h
48h
56h
48h
43h
56h
48h
54h
48h
42h
56h
48h
42h
56h
48h
44h
Latitude [
0
]
Lon
g
itude
[
o
]
2534 m
2216 m
1918 m
1640 m
1380 m
1139 m
916 m
710 m
350 m
275 m
199 m
163 m
c)
Fig 7. Air mass backward trajectories for the high PM concentrations episodes on: a)
21/12/2002; b) 02/04/2005 and c) 27/11/2005
232 ENVIRONMENTAL TECHNOLOGIES: New Developments
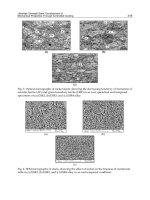
3.8 Scanning Electron Microscopy
Atmospheric PM
10
and PM
2.5
sampled at three representative sites in the urban area of
Belgrade were analyzed with scanning electron microscopy coupled with energy-dispersive
X-ray analysis with the aim to identify their origin. Classification of the present particles
was based on the morphology (McCrone & Delly, 1973) and chemical composition of
particles, typically expressed in terms of EDX peak-to-background values for the elements
of interest, as well as to the particle classification rules described in US-EPA (2002).
According to their morphology, two main particle categories were observed. Particles of
natural sources include materials of organic origin (pollen, bacteria, fungal spores etc.). This
category also includes suspended soil dust (mostly minerals) such as the angular-shaped
material. Particles from anthropogenic sources, mostly emitted from high temperature
combustion processes are characterized by their spherical shapes and smooth surfaces. This
type of particles occur as individual particles but also in an aggregate form, as agglomerates
of similar-sized particles and individual large particles carrying several smaller attached
particles.
Related to the chemical composition and morphology, the analyzed particles were classified
into the most abundant groups such as soot, Si-rich particles, sulfates, metal-rich and
biological particles. The SEM photomicrographs of some characteristic particles and their X-
ray spectra are presented in Fig. 8 - 9. Soot is present as agglomerates of many fine spherical
primary particles. This kind of aggregate has an irregular morphology of various shapes.
The X-ray microanalyses show traces of and sometimes of Na and K. The surface of
carbonaceous particles acts as a catalyst for SO
2
photochemical oxidation producing
ammonium and alkaline metal sulfates. C-rich particles are mainly resulting from the
vehicular traffic and, during winter, from the heating systems. The most of silica particles
(probably Si oxides) and aluminosilicates (containing Al, Si, K, Fe, and Ca) present in the
coarse fractions have irregular forms and come from soil. Spherical aluminosilicates that
dominate in the size fraction below 1 μm are anthropogenic fly ash (e.g. coal combustion)
(Chen et al., 2006; Conner et al., 2001). In Belgrade urban area, this type of particles
originates mostly from individual heating units.
Fig. 8. High resolution SEM image and X-ray microanalysis spectrum of fly ash particles
agglomerate from fossil fuel combustion process emissions and coal-fired power
plant (“Nikola Tesla” A, B, Obrenovac)