Biomedical Engineering 2012 Part 7 ppt
Bạn đang xem bản rút gọn của tài liệu. Xem và tải ngay bản đầy đủ của tài liệu tại đây (1.79 MB, 40 trang )
BiomedicalEngineering232
diagnosis. Again, all video qualities qualified for urgent clinical practice, however QPs of
44/36/28 is recommended. The same allegations stand for constant QP encoding, whereas
for rate control, similar to CIF resolution, videos attaining PSNR higher than 30.5 db.
20
25
30
35
40
45
50
0 100 200 300 400 500 600
BitRate (kbps)
Y-SNR (db
)
IPPP IBPBP IBBPBBP
20
25
30
35
40
45
50
0 200 400 600 800 1000 1200 1400 1600 1800
BitRate (kbps)
Y-PSNR (db)
IPPP IBPBP IBBPBBP
a ) b)
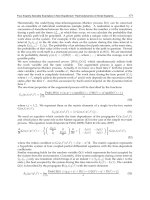
Fig. 5. Rate-distortion curves for tested frame encoding schemes. a) QCIF and b) CIF.
25
27
29
31
33
35
37
39
41
43
45
0 100 200 300 400 500 600
BitRate (kbps)
Y-PSNR (db)
IPPP IBPBP IBBPBBP
25
27
29
31
33
35
37
39
41
43
45
0 100 200 300 400 500 600
BitRate (kbps)
Y-PSNR (db)
IPPP IBPBP IBBPBBP
a ) b)
25
27
29
31
33
35
37
39
41
43
45
0 100 200 300 400 500 600
BitRate (kbps)
Y-PSNR (db)
IPPP IBPBP IBBPBBP
25
27
29
31
33
35
37
39
41
43
45
0 100 200 300 400 500 600
BitRate (kbps)
Y-PSNR (db)
IPPP IBPBP IBBPBBP
c ) d)
Fig. 6. Rate-distortion curves for tested frame encoding schemes, QCIF resolution. a) 2%, b)
5%, c) 8% and d) 10% loss rates. IBBPBBP encoding scheme attains higher PSNR ratings in
most cases, especially in low-noise (up to 5%) scenarios.
25
27
29
31
33
35
37
39
41
43
45
0 200 400 600 800 1000 1200 1400 1600 1800
BitRate (kbps)
Y-PS NR (db)
IPPP IBPBP IBBPBBP
25
27
29
31
33
35
37
39
41
43
45
0 200 400 600 800 1000 1200 1400 1600 1800
BitRate (kbps)
Y-PSNR (db)
IPPP IBPBP IBBPBBP
a ) b)
25
27
29
31
33
35
37
39
41
43
45
0 200 400 600 800 1000 1200 1400 1600 1800
BitRate (kbps)
Y-PSNR (db)
IPPP IBPBP IBBPBBP
25
27
29
31
33
35
37
39
41
43
45
0 200 400 600 800 1000 1200 1400 1600 1800
BitRate (kbps)
Y-PSNR (db)
IPPP IBPBP IBBPBBP
c ) d)
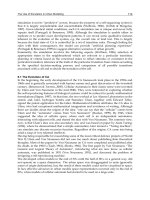
Fig. 7. Rate-distortion curves for tested frame encoding schemes, CIF resolution. a) 2%, b)
5%, c) 8% and d) 10% loss rates. Bi-directional prediction (IBPBP and IBBPBBP) achieves
better results up to 5% loss rates (low-noise), whereas as the noise level increases, single –
directional (IPPP) provides for better error recovery.
20
25
30
35
40
45
50
0 200 400 600 800 1000 1200
Bit Rate (kbps)
Y-PSNR (db)
Constant QP Rate Control Variable QP FMO
20
25
30
35
40
45
50
0 200 400 600 800 1000 1200
Sequence Bit Rate (kbps)
ROI Y-PSNR (db)
Constant QP Rate Control Variable QP FMO
a ) b)
Fig. 8. Rate-distortion curves for a) entire video, QCIF resolution with ECG lead and b)
atherosclerotic plaque extracted from QCIF resolution video with ECG lead (diagnostic
ROI). Observe that Variable QP FMO encoding attains inferior quality for the whole video,
when it comes to diagnostic quality however it outperforms rate control encoding, while it
achieves similar PSNR ratings with constant QP encoding, the key observation being the
drastically lower bitrate it involves.
TowardsDiagnosticallyRobustMedicalUltrasoundVideoStreamingusingH.264 233
diagnosis. Again, all video qualities qualified for urgent clinical practice, however QPs of
44/36/28 is recommended. The same allegations stand for constant QP encoding, whereas
for rate control, similar to CIF resolution, videos attaining PSNR higher than 30.5 db.
20
25
30
35
40
45
50
0 100 200 300 400 500 600
BitRate (kbps)
Y-SNR (db
)
IPPP IBPBP IBBPBBP
20
25
30
35
40
45
50
0 200 400 600 800 1000 1200 1400 1600 1800
BitRate (kbps)
Y-PSNR (db)
IPPP IBPBP IBBPBBP
a ) b)
Fig. 5. Rate-distortion curves for tested frame encoding schemes. a) QCIF and b) CIF.
25
27
29
31
33
35
37
39
41
43
45
0 100 200 300 400 500 600
BitRate (kbps)
Y-PSNR (db)
IPPP IBPBP IBBPBBP
25
27
29
31
33
35
37
39
41
43
45
0 100 200 300 400 500 600
BitRate (kbps)
Y-PSNR (db)
IPPP IBPBP IBBPBBP
a ) b)
25
27
29
31
33
35
37
39
41
43
45
0 100 200 300 400 500 600
BitRate (kbps)
Y-PSNR (db)
IPPP IBPBP IBBPBBP
25
27
29
31
33
35
37
39
41
43
45
0 100 200 300 400 500 600
BitRate (kbps)
Y-PSNR (db)
IPPP IBPBP IBBPBBP
c ) d)
Fig. 6. Rate-distortion curves for tested frame encoding schemes, QCIF resolution. a) 2%, b)
5%, c) 8% and d) 10% loss rates. IBBPBBP encoding scheme attains higher PSNR ratings in
most cases, especially in low-noise (up to 5%) scenarios.
25
27
29
31
33
35
37
39
41
43
45
0 200 400 600 800 1000 1200 1400 1600 1800
BitRate (kbps)
Y-PS NR (db)
IPPP IBPBP IBBPBBP
25
27
29
31
33
35
37
39
41
43
45
0 200 400 600 800 1000 1200 1400 1600 1800
BitRate (kbps)
Y-PSNR (db)
IPPP IBPBP IBBPBBP
a ) b)
25
27
29
31
33
35
37
39
41
43
45
0 200 400 600 800 1000 1200 1400 1600 1800
BitRate (kbps)
Y-PSNR (db)
IPPP IBPBP IBBPBBP
25
27
29
31
33
35
37
39
41
43
45
0 200 400 600 800 1000 1200 1400 1600 1800
BitRate (kbps)
Y-PSNR (db)
IPPP IBPBP IBBPBBP
c ) d)
Fig. 7. Rate-distortion curves for tested frame encoding schemes, CIF resolution. a) 2%, b)
5%, c) 8% and d) 10% loss rates. Bi-directional prediction (IBPBP and IBBPBBP) achieves
better results up to 5% loss rates (low-noise), whereas as the noise level increases, single –
directional (IPPP) provides for better error recovery.
20
25
30
35
40
45
50
0 200 400 600 800 1000 1200
Bit Rate (kbps)
Y-PSNR (db)
Constant QP Rate Control Variable QP FMO
20
25
30
35
40
45
50
0 200 400 600 800 1000 1200
Sequence Bit Rate (kbps)
ROI Y-PSNR (db)
Constant QP Rate Control Variable QP FMO
a ) b)
Fig. 8. Rate-distortion curves for a) entire video, QCIF resolution with ECG lead and b)
atherosclerotic plaque extracted from QCIF resolution video with ECG lead (diagnostic
ROI). Observe that Variable QP FMO encoding attains inferior quality for the whole video,
when it comes to diagnostic quality however it outperforms rate control encoding, while it
achieves similar PSNR ratings with constant QP encoding, the key observation being the
drastically lower bitrate it involves.
BiomedicalEngineering234
20
25
30
35
40
45
50
0 500 1000 1500 2000 2500 3000 3500 4000
Bit Rate (kbps)
Y-PSNR (db)
Constant QP Rate Control Variable QP FMO
20
25
30
35
40
45
50
0 500 1000 1500 2000 2500 3000 3500 4000
Sequence Bit Rate (kbps)
Y-PS NR (db)
Constant QP Rate Control Variable QP FMO
a ) b)
Fig. 9. Rate-distortion curves for a) entire video, CIF resolution video with ECG lead and b)
atherosclerotic plaque extracted from CIF resolution video with ECG lead (diagnostic ROI).
Observe that Variable QP FMO encoding attains inferior quality for the whole video, when
it comes to diagnostic quality however it outperforms rate control encoding, while it
achieves similar PSNR ratings with constant QP encoding, the key observation being the
drastically lower bitrate it involves.
20
25
30
35
40
45
0 200 400 600 800 1000 1200
Sequence Bit Rate (kbps)
ROI Y-PSNR (db)
Constant QP Rate Control Variable QP FMO
20
25
30
35
40
45
0 500 1000 1500 2000 2500 3000 3500 4000
Sequence Bit Rate (kbps)
Y-PSNR (db)
Constant QP Rate Control Variable QP FMO
a ) b)
Fig. 10. Rate-distortion curves for a) atherosclerotic plaque extracted from QCIF resolution
video with ECG lead, 5% loss rate and b) atherosclerotic plaque extracted from CIF
resolution video with ECG lead, 5% loss rate. Variable QP FMO encoding attains the best
diagnostic performance. Better error recovery compared to constant QP encoding is due to
the fact that FMO employs slice encoding. Bandwidth requirements reductions as to Figures
8-9.
Constant QP Rate Control
Variable QP
FMO
Constant QP vs
Variable QP FMO
Rate Control vs
Variable QP FMO
PSNR Seq.
BitRate
PSNR Seq.
BitRate
PSNR Seq.
BitRate
Db
Gain
BitRate
Reduction
Db
Gain
BitRate
Reduction
33.08 235 29.19 82 33.19 82 0.11 153 4
Negligible
34.88 508 30.69 157 36.06 156 1.18 352 5.37
36.51 960 33.01 302 38.65 301 2.14 659 5.64
37.47 1642 33.67 562 40.77 561 3.30 1081 7.10
38.04 2554 35.6 960 42.56 959 4.52 1595 6.96
Table 5. Atherosclerotic plaque extracted from CIF resolution video, no ECG lead - 5% Loss
Rate.
6. Conclusion and Future Work
M-Health systems and services facilitated a revolution in remote diagnosis and care. Driven
by advances in networking, video compression and computer technologies, wide
deployment of such systems and services is expected in the near future. Before such a
scenario becomes a reality however, there are a number of issues that have to be addressed.
Video streaming of medical video over error prone wireless channels is one critical issue
that needs to be addressed. Remote diagnosis is very sensitive to the amount of clinical data
recovered, hence the effort should be directed towards the provision of robust medical
video at a required bitrate for the medical expert to provide a confident and accurate
diagnosis.
H.264/AVC encompasses powerful video coding and error resilience tools, exploitation of
which can significantly improve video quality. We present an evaluation of different frame
types and encoding modes of H.264/AVC and how they relate to diagnostic performance.
In addition, an efficient, diagnostically relevant approach is proposed for encoding and
transmission of medical ultrasound video of the carotid artery. Driven by its diagnostic use,
ultrasound video is segmented and encoded using flexible macroblock ordering (FMO).
FMO type 2 concept is extended to support variable quality slice encoding. Diagnostic
region(s) of interest are encoded in high quality whereas the remaining, non-diagnostic
region, is heavily compressed. Both technical and clinical evaluation show that enhanced
diagnostic performance is attained in the presence of errors while at the same time achieving
significant bandwidth requirements reductions.
Future work includes the insertion of redundant slices (RS) describing diagnostically
important region(s) in the resulting bitstream, maximizing medical video’s error resilience
under severe packet losses (Panayides et al., 2009). We will also explore the application of
these technologies to other medical video modalities.
7. Acknowledgement
This work was funded via the project Real-Time Wireless Transmission of Medical Ultrasound
Video of the Research and Technological Development 2008-2010, of the Research Promotion
Foundation of Cyprus.
TowardsDiagnosticallyRobustMedicalUltrasoundVideoStreamingusingH.264 235
20
25
30
35
40
45
50
0 500 1000 1500 2000 2500 3000 3500 4000
Bit Rate (kbps)
Y-PSNR (db)
Constant QP Rate Control Variable QP FMO
20
25
30
35
40
45
50
0 500 1000 1500 2000 2500 3000 3500 4000
Sequence Bit Rate (kbps)
Y-PS NR (db)
Constant QP Rate Control Variable QP FMO
a ) b)
Fig. 9. Rate-distortion curves for a) entire video, CIF resolution video with ECG lead and b)
atherosclerotic plaque extracted from CIF resolution video with ECG lead (diagnostic ROI).
Observe that Variable QP FMO encoding attains inferior quality for the whole video, when
it comes to diagnostic quality however it outperforms rate control encoding, while it
achieves similar PSNR ratings with constant QP encoding, the key observation being the
drastically lower bitrate it involves.
20
25
30
35
40
45
0 200 400 600 800 1000 1200
Sequence Bit Rate (kbps)
ROI Y-PSNR (db)
Constant QP Rate Control Variable QP FMO
20
25
30
35
40
45
0 500 1000 1500 2000 2500 3000 3500 4000
Sequence Bit Rate (kbps)
Y-PSNR (db)
Constant QP Rate Control Variable QP FMO
a ) b)
Fig. 10. Rate-distortion curves for a) atherosclerotic plaque extracted from QCIF resolution
video with ECG lead, 5% loss rate and b) atherosclerotic plaque extracted from CIF
resolution video with ECG lead, 5% loss rate. Variable QP FMO encoding attains the best
diagnostic performance. Better error recovery compared to constant QP encoding is due to
the fact that FMO employs slice encoding. Bandwidth requirements reductions as to Figures
8-9.
Constant QP Rate Control
Variable QP
FMO
Constant QP vs
Variable QP FMO
Rate Control vs
Variable QP FMO
PSNR Seq.
BitRate
PSNR Seq.
BitRate
PSNR Seq.
BitRate
Db
Gain
BitRate
Reduction
Db
Gain
BitRate
Reduction
33.08 235 29.19 82 33.19 82 0.11 153 4
Negligible
34.88 508 30.69 157 36.06 156 1.18 352 5.37
36.51 960 33.01 302 38.65 301 2.14 659 5.64
37.47 1642 33.67 562 40.77 561 3.30 1081 7.10
38.04 2554 35.6 960 42.56 959 4.52 1595 6.96
Table 5. Atherosclerotic plaque extracted from CIF resolution video, no ECG lead - 5% Loss
Rate.
6. Conclusion and Future Work
M-Health systems and services facilitated a revolution in remote diagnosis and care. Driven
by advances in networking, video compression and computer technologies, wide
deployment of such systems and services is expected in the near future. Before such a
scenario becomes a reality however, there are a number of issues that have to be addressed.
Video streaming of medical video over error prone wireless channels is one critical issue
that needs to be addressed. Remote diagnosis is very sensitive to the amount of clinical data
recovered, hence the effort should be directed towards the provision of robust medical
video at a required bitrate for the medical expert to provide a confident and accurate
diagnosis.
H.264/AVC encompasses powerful video coding and error resilience tools, exploitation of
which can significantly improve video quality. We present an evaluation of different frame
types and encoding modes of H.264/AVC and how they relate to diagnostic performance.
In addition, an efficient, diagnostically relevant approach is proposed for encoding and
transmission of medical ultrasound video of the carotid artery. Driven by its diagnostic use,
ultrasound video is segmented and encoded using flexible macroblock ordering (FMO).
FMO type 2 concept is extended to support variable quality slice encoding. Diagnostic
region(s) of interest are encoded in high quality whereas the remaining, non-diagnostic
region, is heavily compressed. Both technical and clinical evaluation show that enhanced
diagnostic performance is attained in the presence of errors while at the same time achieving
significant bandwidth requirements reductions.
Future work includes the insertion of redundant slices (RS) describing diagnostically
important region(s) in the resulting bitstream, maximizing medical video’s error resilience
under severe packet losses (Panayides et al., 2009). We will also explore the application of
these technologies to other medical video modalities.
7. Acknowledgement
This work was funded via the project Real-Time Wireless Transmission of Medical Ultrasound
Video of the Research and Technological Development 2008-2010, of the Research Promotion
Foundation of Cyprus.
BiomedicalEngineering236
8. References
Doukas, C. & Maglogiannis, I. (2008). Adaptive Transmission of Medical Image and Video
Using Scalable Coding and Context-Aware Wireless Medical Networks, EURASIP
Journal on Wireless Communications and Networking, Vol. 2008, Article ID 428397, 12
pages. doi:10.1155/2008/428397.
Fielding, R.; Gettys, J.; Mogul, J.; Frystyk, H.; Masinter, L.; Leach, P. & Berners-Lee, T. (1999).
Hypertext Transfer Protocol-HTTP/1.1., Internet Engineering Task Force, RFC
2616, 1999.
H.264/AVC JM 15.1 Reference Software, Available:
Handley, M.; Schulzrinne, H.; Schooler, E. & Rosenberg, J. (1999). SIP: Session Initiation
Protocol, Internet Engineering Task Force, RFC 2543, Mar. 1999.
Hennerici, M. & Neuerburg-Heusler, D. (1998). Vascular Diagnosis With Ultrasound, Thieme,
0865776032, 9780865776036, Stutgart - New York.
Istepanian, R.H.; Laxminarayan, S. & Pattichis, C.S. (2006). M-Health: Emerging Mobile Health
Systems, Springer, 0387265589, 9780387265582, New York.
Joint Video Team of ITU-T and ISO/IEC JTC 1. (2003). Draft ITU-T Recommendation and
Final Draft International Standard of Joint Video Specification (ITU-T Rec. H.264 |
ISO/IEC 14496-10 AVC), Joint Video Team (JVT) of ISO/IEC MPEG and ITU-T
VCEG, JVTG050, Mar. 2003.
Kyriacou, E.; Pattichis, M.S.; Pattichis, C.S.; Panayides, A. & Pitsillides, A. (2007). M-Health
e-Emergency Systems: Current Status and Future Directions [Wireless corner],
Antennas and Propagation Magazine, IEEE , Vol. 49, No. 1, Feb. 2007, pp. 216-231,
1045-9243.
Lambert, P.; De Neve, W.; Dhondt, Y. & Van De Walle, R. (2006). Flexible macroblock
ordering in H.264/AVC, Journal of Visual Communication and Image
Representation, Vol. 17, No. 2, Apr. 2006, pp. 358-375, 10473203.
Li, Z.G.; Pan, F.; Lim, K.P.; Feng, G.N.; Lin X. & Rahardaj, S. (2003). Adaptive basic unit
layer rate control for JVT, JVT-G012, 7th meeting, Pattaya II, Thailand, 7-14, Mar.
2003.
Loizou, C.P.; Pattichis, C.S.; Christodoulou, C.I.; Istepanian, R.S.H.; Pantziaris, M. &
Nicolaides, A. (2005). Comparative evaluation of despeckle filtering in ultrasound
imaging of the carotid artery, IEEE Transactions on Ultrasonics Ferroelectrics and
Frequency Control, Vol. 52, No. 10, Oct. 2005, pp. 1653-1669, 0885-3010.
Loizou, C.P.; Pattichis, C.S.; Pantziaris, M. & Nicolaides, A. (2007). An integrated system for
the segmentation of atherosclerotic carotid plaque, IEEE Transactions on Information
Technology in Biomedicine, Vol. 11, No. 5, Nov. 2007, pp. 661-667, 1089-7771.
Loizou, C.P. & Pattichis C.S. (2008). Despeckle filtering algorithms and Software for
Ultrasound Imaging, Synthesis Lectures on Algorithms and Software for Engineering,
Ed. Morgan & Claypool Publishers, 13: 9781598296204, USA.
Panayides, A.; Pattichis, M. S. & Pattichis, C. S. (2008). Wireless Medical Ultrasound Video
Transmission Through Noisy Channels, Proceedings of the 30
th
Annual International
Conference of the IEEE Engineering in Medicine and Biology Society (EMBC’08), pp.
5326-5329, 1557-170X, Aug. 2008, Vancouver, Canada.
Panayides, A.; Pattichis, M. S.; Pattichis, C. S.; Loizou, C. P.; Pantziaris, M. and Pitsillides, A.
(2009). Robust and Efficient Ultrasound Video Coding in Noisy Channels Using
H.264, to be published in Proceedings of the 31
st
Annual International Conference of the
IEEE Engineering in Medicine and Biology Society (EMBC’09), Sep. 2009, Minnesota,
U.S.A.
Park S. & Miller, K. (1998). Random Number Generators: Good Ones Are Hard To Find,
Communications of the ACM, Vol. 31, No. 10, Oct. 1988, pp. 1192 - 1201,0001-0782.
Postel, J. (1980). User Datagram Protocol, Internet Engineering Task Force, RFC 768, 1980.
Postel, J. (1981). Transmission Control Protocol, Internet Engineering Task Force, RFC 793,
1981.
Rao, S. & Jayant, N. (2005). Towards high quality region-of-interest medical video over
wireless networks using lossless coding and motion compensated temporal
filtering, Proceedings of the fifth IEEE International Symposium on Signal Processing and
Information Technology (ISSPIT’05), pp. 618-623, 0-7803-9313-9, Dec. 2005, Athens,
Greece.
Schulzrinne, H.; Casner, S.; Frederick, R. & Jacobson, V. (1996). RTP: A Transport Protocol
for Real-Time Applications, Internet Engineering Task Force, RFC 1889, Jan. 1996.
Schulzrinne, H.; Rao, A. & Lanphier, R. (1998). Real-Time Session Protocol (RTSP), Internet
Engineering Task Force, RFC 2326, Apr. 1998.
Tsapatsoulis N.; Loizou, C. & Pattichis, C. (2007). Region of Interest Video Coding for Low
bit-rate Transmission of Carotid Ultrasound Videos over 3G Wireless Networks,
Proceedings of the 29th Annual International Conference of the IEEE Engineering in
Medicine and Biology Society (EMBC’07), pp. 3717-3720, 978-1-4244-0787-3, Aug.
2007, Lyon, France.
Wang Z. & C. Bovik, A. (2009) Mean squared error: love it or leave it? - A new look at signal
fidelity measures, IEEE Signal Processing Magazine, Vol. 26, No. 1, Jan. 2009, pp. 98-
117.
Wenger S. (2002). FMO: Flexible Macroblock Ordering, ITU-T JVT-C089, May 2002.
Wenger, S. & Horowitz, M. (2002). Flexible MB Ordering – A New Error Resilience Tool for
IP-Based Video, Proceedings of International Workshop on Digital Communications
(IWDC’02), Sept. 2002, Capri, Italy.
Wenger, S. (2003). H.264/AVC over IP, IEEE Transactions on Circuits and Systems for Video
Technolology, Vol. 13, No. 7, Jul. 2003, pp. 645–656, 1051-8215.
Wiegand, T.; Sullivan, G. J.; Bjøntegaard, G. & Luthra, A. (2003). Overview of the
H.264/AVC video coding standard, IEEE Transactions on Circuits and Systems for
Video Technolology, Vol. 13, No. 7, Jul. 2003, pp. 560–576, 1051-8215.
Williams, D. & Shah, M. (1992). A Fast Algorithm for Active Contour and Curvature
Estimation, GVCIP: Imag. Und., Vol. 55, No. 1, 1992, pp. 14-26.
Yu, H.; Lin, Z. & Pan, F. (2005). Applications and improvement of H.264 in medical video
compression, IEEE Transactions on Circuits and Systems I, Special issue on Biomedical
Circuits and Systems: A New Wave of Technology, Vol. 52, No. 12, Dec. 2005, pp. 2707-
2716, 1549-8328.
TowardsDiagnosticallyRobustMedicalUltrasoundVideoStreamingusingH.264 237
8. References
Doukas, C. & Maglogiannis, I. (2008). Adaptive Transmission of Medical Image and Video
Using Scalable Coding and Context-Aware Wireless Medical Networks, EURASIP
Journal on Wireless Communications and Networking, Vol. 2008, Article ID 428397, 12
pages. doi:10.1155/2008/428397.
Fielding, R.; Gettys, J.; Mogul, J.; Frystyk, H.; Masinter, L.; Leach, P. & Berners-Lee, T. (1999).
Hypertext Transfer Protocol-HTTP/1.1., Internet Engineering Task Force, RFC
2616, 1999.
H.264/AVC JM 15.1 Reference Software, Available:
Handley, M.; Schulzrinne, H.; Schooler, E. & Rosenberg, J. (1999). SIP: Session Initiation
Protocol, Internet Engineering Task Force, RFC 2543, Mar. 1999.
Hennerici, M. & Neuerburg-Heusler, D. (1998). Vascular Diagnosis With Ultrasound, Thieme,
0865776032, 9780865776036, Stutgart - New York.
Istepanian, R.H.; Laxminarayan, S. & Pattichis, C.S. (2006). M-Health: Emerging Mobile Health
Systems, Springer, 0387265589, 9780387265582, New York.
Joint Video Team of ITU-T and ISO/IEC JTC 1. (2003). Draft ITU-T Recommendation and
Final Draft International Standard of Joint Video Specification (ITU-T Rec. H.264 |
ISO/IEC 14496-10 AVC), Joint Video Team (JVT) of ISO/IEC MPEG and ITU-T
VCEG, JVTG050, Mar. 2003.
Kyriacou, E.; Pattichis, M.S.; Pattichis, C.S.; Panayides, A. & Pitsillides, A. (2007). M-Health
e-Emergency Systems: Current Status and Future Directions [Wireless corner],
Antennas and Propagation Magazine, IEEE , Vol. 49, No. 1, Feb. 2007, pp. 216-231,
1045-9243.
Lambert, P.; De Neve, W.; Dhondt, Y. & Van De Walle, R. (2006). Flexible macroblock
ordering in H.264/AVC, Journal of Visual Communication and Image
Representation, Vol. 17, No. 2, Apr. 2006, pp. 358-375, 10473203.
Li, Z.G.; Pan, F.; Lim, K.P.; Feng, G.N.; Lin X. & Rahardaj, S. (2003). Adaptive basic unit
layer rate control for JVT, JVT-G012, 7th meeting, Pattaya II, Thailand, 7-14, Mar.
2003.
Loizou, C.P.; Pattichis, C.S.; Christodoulou, C.I.; Istepanian, R.S.H.; Pantziaris, M. &
Nicolaides, A. (2005). Comparative evaluation of despeckle filtering in ultrasound
imaging of the carotid artery, IEEE Transactions on Ultrasonics Ferroelectrics and
Frequency Control, Vol. 52, No. 10, Oct. 2005, pp. 1653-1669, 0885-3010.
Loizou, C.P.; Pattichis, C.S.; Pantziaris, M. & Nicolaides, A. (2007). An integrated system for
the segmentation of atherosclerotic carotid plaque, IEEE Transactions on Information
Technology in Biomedicine, Vol. 11, No. 5, Nov. 2007, pp. 661-667, 1089-7771.
Loizou, C.P. & Pattichis C.S. (2008). Despeckle filtering algorithms and Software for
Ultrasound Imaging, Synthesis Lectures on Algorithms and Software for Engineering,
Ed. Morgan & Claypool Publishers, 13: 9781598296204, USA.
Panayides, A.; Pattichis, M. S. & Pattichis, C. S. (2008). Wireless Medical Ultrasound Video
Transmission Through Noisy Channels, Proceedings of the 30
th
Annual International
Conference of the IEEE Engineering in Medicine and Biology Society (EMBC’08), pp.
5326-5329, 1557-170X, Aug. 2008, Vancouver, Canada.
Panayides, A.; Pattichis, M. S.; Pattichis, C. S.; Loizou, C. P.; Pantziaris, M. and Pitsillides, A.
(2009). Robust and Efficient Ultrasound Video Coding in Noisy Channels Using
H.264, to be published in Proceedings of the 31
st
Annual International Conference of the
IEEE Engineering in Medicine and Biology Society (EMBC’09), Sep. 2009, Minnesota,
U.S.A.
Park S. & Miller, K. (1998). Random Number Generators: Good Ones Are Hard To Find,
Communications of the ACM, Vol. 31, No. 10, Oct. 1988, pp. 1192 - 1201,0001-0782.
Postel, J. (1980). User Datagram Protocol, Internet Engineering Task Force, RFC 768, 1980.
Postel, J. (1981). Transmission Control Protocol, Internet Engineering Task Force, RFC 793,
1981.
Rao, S. & Jayant, N. (2005). Towards high quality region-of-interest medical video over
wireless networks using lossless coding and motion compensated temporal
filtering, Proceedings of the fifth IEEE International Symposium on Signal Processing and
Information Technology (ISSPIT’05), pp. 618-623, 0-7803-9313-9, Dec. 2005, Athens,
Greece.
Schulzrinne, H.; Casner, S.; Frederick, R. & Jacobson, V. (1996). RTP: A Transport Protocol
for Real-Time Applications, Internet Engineering Task Force, RFC 1889, Jan. 1996.
Schulzrinne, H.; Rao, A. & Lanphier, R. (1998). Real-Time Session Protocol (RTSP), Internet
Engineering Task Force, RFC 2326, Apr. 1998.
Tsapatsoulis N.; Loizou, C. & Pattichis, C. (2007). Region of Interest Video Coding for Low
bit-rate Transmission of Carotid Ultrasound Videos over 3G Wireless Networks,
Proceedings of the 29th Annual International Conference of the IEEE Engineering in
Medicine and Biology Society (EMBC’07), pp. 3717-3720, 978-1-4244-0787-3, Aug.
2007, Lyon, France.
Wang Z. & C. Bovik, A. (2009) Mean squared error: love it or leave it? - A new look at signal
fidelity measures, IEEE Signal Processing Magazine, Vol. 26, No. 1, Jan. 2009, pp. 98-
117.
Wenger S. (2002). FMO: Flexible Macroblock Ordering, ITU-T JVT-C089, May 2002.
Wenger, S. & Horowitz, M. (2002). Flexible MB Ordering – A New Error Resilience Tool for
IP-Based Video, Proceedings of International Workshop on Digital Communications
(IWDC’02), Sept. 2002, Capri, Italy.
Wenger, S. (2003). H.264/AVC over IP, IEEE Transactions on Circuits and Systems for Video
Technolology, Vol. 13, No. 7, Jul. 2003, pp. 645–656, 1051-8215.
Wiegand, T.; Sullivan, G. J.; Bjøntegaard, G. & Luthra, A. (2003). Overview of the
H.264/AVC video coding standard, IEEE Transactions on Circuits and Systems for
Video Technolology, Vol. 13, No. 7, Jul. 2003, pp. 560–576, 1051-8215.
Williams, D. & Shah, M. (1992). A Fast Algorithm for Active Contour and Curvature
Estimation, GVCIP: Imag. Und., Vol. 55, No. 1, 1992, pp. 14-26.
Yu, H.; Lin, Z. & Pan, F. (2005). Applications and improvement of H.264 in medical video
compression, IEEE Transactions on Circuits and Systems I, Special issue on Biomedical
Circuits and Systems: A New Wave of Technology, Vol. 52, No. 12, Dec. 2005, pp. 2707-
2716, 1549-8328.
BiomedicalEngineering238
Contact-lessAssessmentofIn-vivoBodySignalsUsingMicrowaveDopplerRadar 239
Contact-less Assessment of In-vivo Body Signals Using Microwave
DopplerRadar
ShahrzadJalaliMazlouman,KouhyarTvakolian,AlirezaMahanfar,andBozenaKaminska
X
Contact-less Assessment of In-vivo Body
Signals Using Microwave Doppler Radar
Shahrzad Jalali Mazlouman, Kouhyar Tavakolian,
Alireza Mahanfar and Bozena Kaminska
Simon Fraser University, School of Engineering Science
8888 University Drive, V5A 1S6
Burnaby, BC, Canada
1. Introduction
Every seven minutes in Canada, someone dies from heart disease or stroke. Cardiovascular
disease (heart disease, diseases of the blood vessels and stroke) accounts for the death of
more Canadians than any other disease (Heartandstroke, 2004). Early detection and
treatment of symptoms and abnormalities can significantly decrease this rate. Therefore, the
heart-related signals are the most important vital signals to monitor. For many years,
extensive work has been devoted to finding low-cost, convenient, ubiquitous solutions to
monitor heart signals in the everyday life. While these devices are beneficial, they have the
disadvantage of requiring physical contact with the patient. Examples include chest straps
to monitor the electrocardiogram (ECG) signal, gel for ultrasounds (echocardiography),
heavy accelerometer sensor for seismocardiogram and electrodes for impedance
cardiography (ICG) and oximetery. In addition, most of the existing methods require special
expertise to use. The ideal solution would include a non-obtrusive method that can be used
continuously and in everyday life without touching the patient and without requiring
special expertise.
From another point of view, seniors are becoming the fastest growing segment of the
population in North America (Michahelles et al., 2004). This trend creates a new demand for
health care. Availability of cost-efficient, wearable, non-invasive, real-time methods of
monitoring body signals that can be used at home can save a significant fraction of costs for
the health care system while providing efficient care to the elderly. Consequently, there is a
growing demand for devices that allow remote monitoring of health related parameters and
transferring the recorded data to a physician via telephone, internet, or cellular phone
networks, in case of sensing any abnormalities or symptoms.
Such non-invasive methods can also be beneficial for monitoring the effectiveness of
treatment procedures for patients in the hospital or at home without requiring physical
contact, thereby allowing long-term health care monitoring at almost no compromise in the
patient’s mobility or ordinary lifestyle. As an example, in this chapter, a new method for
monitoring of congestive heart failure patients using the radar technology is proposed. In
addition, in-vivo body signals monitoring, in particular heart and breathing rate monitoring,
13
BiomedicalEngineering240
can provide safety in critical situations such as car driving, by initiating actions such as
automatic control, stop and urgent call upon reading of an emergency call by the developed
sensor (Michahelles et al., 2004).
In this chapter, the basics of Microwave Doppler radar systems are investigated as a cost-
efficient, non-invasive, and ubiquitous solution for continuous monitoring of in-vivo body
signals; in particular, non-invasive sensing of cardiac, respiratory, and arterial movements.
Microwave Doppler radar can detect motions and velocity based on Doppler effect;
therefore, a variety of body signals including the mechanical motions of the chest because of
heart beat (the radar seismocardiogram, R-SCG) as well as the blood flow velocity in major
blood vessels can be monitored. Parameters such as heart-rate, hemodynamic parameters,
blood flow velocity and respiration rate can be measured using these devices. Microwave
Doppler radar systems do not require direct contact with the body and can function through
blankets or clothing.
Although laboratory demonstrations of the use of Doppler radar for cardiovascular and
respiratory measurements date back to the late 1970’s and early 1980’s (Lin, 1975; Lin, 1979),
cost-efficient, wearable body signal monitoring devices have not been reported until very
recently; when implementation of low-cost, low-power, battery-operated devices is more
feasible than ever by virtue of the availability and advances in high-integration technologies,
signal processing techniques, and high-speed communication networks.
Depending on the application, Microwave Doppler radar systems may use a continuous-
wave or a time-gated radar signal. Continuous-wave Doppler radar have been shown to be
comparable and even exceeding the conventional impedance cardiography methods for
measuring the mechanical activity of the heart, as well as for measuring the heart-rate
variability (HRV) (Staderini, 2002a). In fact, the derivative of the radar signal shows better
correlations with the impedance cardiogram signal (ICG) (Thijs et al., 2005). Some signals
have been confirmed to be more clear on the captured radar signal than on the ICG, for
example, the opening of the atrium and the mitral valve (Thijs et al., 2005).
A continuous Microwave Doppler radar based system was developed in the centre for
integrative bio-engineering research (CiBER lab) of Simon Fraser University (Tavakolian et
al, 2008a). The developed device is completely implemented on board and is the first
reported device that can be used independently as a stand-alone system or can be connected
to a PC. This device was tested to measure the heart and respiration rate of human subjects
and demonstrated a noticeable accuracy of 91.35% for respiration rate, and 92.9% for heart
rate. More importantly, this system was used to extract R-SCG signal as is discussed in the
next sections.
The structure of this book chapter is as follows. In Section 2, body signals that can
potentially be measured using the Doppler radar system are introduced. Special emphasize
has been given to a class of infrasonic cardiac signals, that radar extracted R-SCG signal
belongs to it. In this section technical background such as the Doppler Effect, the radar
system, and the ultra-wideband radar are discussed. In Section 3, details of the Microwave
Doppler radar systems are discussed and analyzed and the related equations are derived.
The building blocks are introduced and design specifications and requirements are
calculated. Section 4 is devoted to practical implementation of the Microwave Doppler radar
based system that was designed and implemented in the CiBER lab.
2. Background
2.1 Infrasonic Cardiac Signals
Radar seismocardiogram (R-SCG) belongs to a category of cardiac signals that have their
main components in the infrasonic range (less than 20 Hz) and reflect the mechanical
function of the heart as a pump. During the past century, extensive research has been
conducted on interpretation of these signals in terms of their relationship to cardiovascular
dynamics and their possible application in cardiac abnormality diagnostics. Signals such as
ballistocardiogram (BCG), seismocardiogram (SCG), apexcardiogram (ACG) and radar
seismocardiogram reflect the displacement, velocity, or acceleration of the body in response
to the heart beating.
Different methods that were used to acquire these signals are shown in Fig. 1. R-SCG is
recorded by contactless radar method, SCG and ACG are recorded by attaching sensors to
the chest and BCG is recorded by measuring the changes of the center of mass of the whole
body. The ACG acquisition is very similar to SCG, except for the recording site on the chest,
which is the point of maximum impulse for ACG and the sternum for most SCG definitions,
as is explained in the next section. A contactless method of recording ACG has also been
proposed using microwave radar (Lin, 1979).
The recorded signal morphology will vary with the method employed, but all the
techniques appear to signal basically the same events in the cardiac cycle. The basic
physiology behind all these signals are as follows: with each heart beat, blood rushes
upward and strikes the aortic arch. The impact is great enough to give the whole body an
upthrust. When the descending blood slows down, there is a rebound effect which gives the
body a downthrust, not as intense as the earlier upthrust.
These signals are normally recorded together with ECG thus, an understanding of the
electromechanical performance of the heart can be achieved. In order to better understand
the genesis of waves in R-SCG signal, for the first time in this writing, we study these signals
in the same context and briefly investigate their simillarities and differences.
Fig. 1. Different recording schemes for acquistion of infrasonic cardiac signals
2.1.1 Ballistocardiogram (BCG)
The ballistocardiogram is caused by the change of the center of mass of body because of the
blood circulation and can be recorded by noninvasive means. In the early 1930s Isaac Starr
recognized that the BCG signals closely reflect the strength of myocardial contraction and
Contact-lessAssessmentofIn-vivoBodySignalsUsingMicrowaveDopplerRadar 241
can provide safety in critical situations such as car driving, by initiating actions such as
automatic control, stop and urgent call upon reading of an emergency call by the developed
sensor (Michahelles et al., 2004).
In this chapter, the basics of Microwave Doppler radar systems are investigated as a cost-
efficient, non-invasive, and ubiquitous solution for continuous monitoring of in-vivo body
signals; in particular, non-invasive sensing of cardiac, respiratory, and arterial movements.
Microwave Doppler radar can detect motions and velocity based on Doppler effect;
therefore, a variety of body signals including the mechanical motions of the chest because of
heart beat (the radar seismocardiogram, R-SCG) as well as the blood flow velocity in major
blood vessels can be monitored. Parameters such as heart-rate, hemodynamic parameters,
blood flow velocity and respiration rate can be measured using these devices. Microwave
Doppler radar systems do not require direct contact with the body and can function through
blankets or clothing.
Although laboratory demonstrations of the use of Doppler radar for cardiovascular and
respiratory measurements date back to the late 1970’s and early 1980’s (Lin, 1975; Lin, 1979),
cost-efficient, wearable body signal monitoring devices have not been reported until very
recently; when implementation of low-cost, low-power, battery-operated devices is more
feasible than ever by virtue of the availability and advances in high-integration technologies,
signal processing techniques, and high-speed communication networks.
Depending on the application, Microwave Doppler radar systems may use a continuous-
wave or a time-gated radar signal. Continuous-wave Doppler radar have been shown to be
comparable and even exceeding the conventional impedance cardiography methods for
measuring the mechanical activity of the heart, as well as for measuring the heart-rate
variability (HRV) (Staderini, 2002a). In fact, the derivative of the radar signal shows better
correlations with the impedance cardiogram signal (ICG) (Thijs et al., 2005). Some signals
have been confirmed to be more clear on the captured radar signal than on the ICG, for
example, the opening of the atrium and the mitral valve (Thijs et al., 2005).
A continuous Microwave Doppler radar based system was developed in the centre for
integrative bio-engineering research (CiBER lab) of Simon Fraser University (Tavakolian et
al, 2008a). The developed device is completely implemented on board and is the first
reported device that can be used independently as a stand-alone system or can be connected
to a PC. This device was tested to measure the heart and respiration rate of human subjects
and demonstrated a noticeable accuracy of 91.35% for respiration rate, and 92.9% for heart
rate. More importantly, this system was used to extract R-SCG signal as is discussed in the
next sections.
The structure of this book chapter is as follows. In Section 2, body signals that can
potentially be measured using the Doppler radar system are introduced. Special emphasize
has been given to a class of infrasonic cardiac signals, that radar extracted R-SCG signal
belongs to it. In this section technical background such as the Doppler Effect, the radar
system, and the ultra-wideband radar are discussed. In Section 3, details of the Microwave
Doppler radar systems are discussed and analyzed and the related equations are derived.
The building blocks are introduced and design specifications and requirements are
calculated. Section 4 is devoted to practical implementation of the Microwave Doppler radar
based system that was designed and implemented in the CiBER lab.
2. Background
2.1 Infrasonic Cardiac Signals
Radar seismocardiogram (R-SCG) belongs to a category of cardiac signals that have their
main components in the infrasonic range (less than 20 Hz) and reflect the mechanical
function of the heart as a pump. During the past century, extensive research has been
conducted on interpretation of these signals in terms of their relationship to cardiovascular
dynamics and their possible application in cardiac abnormality diagnostics. Signals such as
ballistocardiogram (BCG), seismocardiogram (SCG), apexcardiogram (ACG) and radar
seismocardiogram reflect the displacement, velocity, or acceleration of the body in response
to the heart beating.
Different methods that were used to acquire these signals are shown in Fig. 1. R-SCG is
recorded by contactless radar method, SCG and ACG are recorded by attaching sensors to
the chest and BCG is recorded by measuring the changes of the center of mass of the whole
body. The ACG acquisition is very similar to SCG, except for the recording site on the chest,
which is the point of maximum impulse for ACG and the sternum for most SCG definitions,
as is explained in the next section. A contactless method of recording ACG has also been
proposed using microwave radar (Lin, 1979).
The recorded signal morphology will vary with the method employed, but all the
techniques appear to signal basically the same events in the cardiac cycle. The basic
physiology behind all these signals are as follows: with each heart beat, blood rushes
upward and strikes the aortic arch. The impact is great enough to give the whole body an
upthrust. When the descending blood slows down, there is a rebound effect which gives the
body a downthrust, not as intense as the earlier upthrust.
These signals are normally recorded together with ECG thus, an understanding of the
electromechanical performance of the heart can be achieved. In order to better understand
the genesis of waves in R-SCG signal, for the first time in this writing, we study these signals
in the same context and briefly investigate their simillarities and differences.
Fig. 1. Different recording schemes for acquistion of infrasonic cardiac signals
2.1.1 Ballistocardiogram (BCG)
The ballistocardiogram is caused by the change of the center of mass of body because of the
blood circulation and can be recorded by noninvasive means. In the early 1930s Isaac Starr
recognized that the BCG signals closely reflect the strength of myocardial contraction and
BiomedicalEngineering242
function of the heart as a pump. As a result of his valuable research, clinicians and medical
experts for almost three decades studied the effects of different heart malfunctions using
BCG and proved that these malfunctions can be related to typical patterns on the BCG signal
morphology (Starr & Noordergraaf, 1967).
Most types of BCG involve a platform upon which a subject lies supinely. BCG systems
were categorized by their natural frequency with respect to the heart‘s own natural
frequency of about 1 Hz. Those BCG apparatuses with higher natural frequencies of 10 Hz
to 15 Hz are high frequency BCG (HF-BCG). Those with natural frequencies of
approximately 1 Hz are low frequency (LF-BCG) and those lower than 1 Hz are ultra-low
frequency (ULF-BCG). Binding and dampening of the BCG apparatus can be thought of as
filtering its resultant signal such that frequencies below its natural frequency are removed.
Thus, HF-BCG removes more of the low frequency spectrum, and so it reflects forces,
whereas ULF-BCG measures displacement better. The physical basis of these BCG
apparatuses is examined in elegant detail by Noordergraaf (Starr & Noordergraaf, 1967).
The ideal BCG waveform consists of seven waveforms
peaks labeled G through N as
defined by the American Heart Association. H is the first upward deflection after
electrocardiograph (ECG) R-wave on the acceleration BCG when recorded simultaneously.
The letter I is the downward wave immediately after H, and lastly the letter J is the upward
wave after I. The L, M and N waves correspond to the diastolic phase of the cardiac cycle, all
the waves can be seen in Fig. 2. (Scarborough & Talbot 1956).
In addition to a number of clinical studies that have been performed with BCG, specialized
BCG instruments, including beds (Jensen et al., 1991), chairs (Junnila et al., 2008) and weight
scale (Inan et al., 2008), have been developed by different research groups. However, due to
the unrefined nature of the previous BCG signal acquisition technologies, the lack of
interpretation algorithms, and the lack of practical devices, the current health care systems
do not use BCG for clinical purposes.
Fig. 2.
Simulaneous BCG, ECG and Phonocardiograph signals (Scarborough & Talbot 1956)
2.1.2 Seismocardiogram (SCG)
Seismocardiography is a technique used for analyzing the vibrations generated by the heart
and it is recorded from the surface of the body using accelerometers. The
seismocardiography was first introduced to clinical medicine by J. Zanetti (earthquake
seismologist) and D. Salerno (cardiologist) in 1987. They borrowed the technology used in
seismology to record the cardiac induced vibration from the surface of the body (Salerno &
Zanetti, 1990a). This signal was also given the name Sternal Ballistocardiography as it was
recorded from the sternum and had similarities to the ballistocardiogram (Mckay et al.,
1999) (Tavakolian et al., 2008b). A cycle of synchronous SCG and ECG is shown in Fig. 3.
It was shown later on that changes in SCG after exercise was more sensitive for detection of
moderate coronary artery stenosis than ECG. Later, the same claim was proven on more
number of patients, 505, that the qualitative seismocardiography was more accurate, both in
sensitivity and specificity, than electrocardiography for detection of coronary artery
stenosis. This was true for severe, multivessle disease as well as for moderate disease and
also for presence or absence of myocardial infarction (Salerno et al., 1990b).
There are two different subgroups of signals that have been introduced so far as
seismocardiogram. In the first group, which consists the majority of the papers, the signal is
recorded by positioning of an accelerometer on the sternum while in the second group other
places on the torso such as left clavicle (Castiglioni et al. 2007) or hip (Trefny, 2005) were
used. Thus, in a wider sense seismocardiogram is recording of cardiac induced vibrations on
the upper part of the body while in a particular definition given by Salerno and his group
seismocardiogram, is just limited to the vibration signals recorded from the sternum.
The first commercial SCG instrument was a failure as it required a heavy and bulky
seismology sensor on the sternum which was cumbersome to tolerate for a long time. New
sensor technologies have provided new possibilities for portable and wireless sensors that
can be worn under clothing to record the SCG signal during daily activities. A new line of
research has emerged aiming to re-introduce SCG as a clinical instrument that can be used
to noninvasively and inexpensively diagnose cardiac abnormalities (Akhbardeh et al., 2007)
(Castiglioni et al. 2007) (Tavakolian et al. 2008b).
Fig. 3. A cycle of ECG (top) and SCG signals, from the second author, and the sequence of
cardiac events assigned to it based on Salerno’s research (Crow et al. 1994)
Contact-lessAssessmentofIn-vivoBodySignalsUsingMicrowaveDopplerRadar 243
function of the heart as a pump. As a result of his valuable research, clinicians and medical
experts for almost three decades studied the effects of different heart malfunctions using
BCG and proved that these malfunctions can be related to typical patterns on the BCG signal
morphology (Starr & Noordergraaf, 1967).
Most types of BCG involve a platform upon which a subject lies supinely. BCG systems
were categorized by their natural frequency with respect to the heart‘s own natural
frequency of about 1 Hz. Those BCG apparatuses with higher natural frequencies of 10 Hz
to 15 Hz are high frequency BCG (HF-BCG). Those with natural frequencies of
approximately 1 Hz are low frequency (LF-BCG) and those lower than 1 Hz are ultra-low
frequency (ULF-BCG). Binding and dampening of the BCG apparatus can be thought of as
filtering its resultant signal such that frequencies below its natural frequency are removed.
Thus, HF-BCG removes more of the low frequency spectrum, and so it reflects forces,
whereas ULF-BCG measures displacement better. The physical basis of these BCG
apparatuses is examined in elegant detail by Noordergraaf (Starr & Noordergraaf, 1967).
The ideal BCG waveform consists of seven waveforms peaks labeled G through N as
defined by the American Heart Association. H is the first upward deflection after
electrocardiograph (ECG) R-wave on the acceleration BCG when recorded simultaneously.
The letter I is the downward wave immediately after H, and lastly the letter J is the upward
wave after I. The L, M and N waves correspond to the diastolic phase of the cardiac cycle, all
the waves can be seen in Fig. 2. (Scarborough & Talbot 1956).
In addition to a number of clinical studies that have been performed with BCG, specialized
BCG instruments, including beds (Jensen et al., 1991), chairs (Junnila et al., 2008) and weight
scale (Inan et al., 2008), have been developed by different research groups. However, due to
the unrefined nature of the previous BCG signal acquisition technologies, the lack of
interpretation algorithms, and the lack of practical devices, the current health care systems
do not use BCG for clinical purposes.
Fig. 2.
Simulaneous BCG, ECG and Phonocardiograph signals (Scarborough & Talbot 1956)
2.1.2 Seismocardiogram (SCG)
Seismocardiography is a technique used for analyzing the vibrations generated by the heart
and it is recorded from the surface of the body using accelerometers. The
seismocardiography was first introduced to clinical medicine by J. Zanetti (earthquake
seismologist) and D. Salerno (cardiologist) in 1987. They borrowed the technology used in
seismology to record the cardiac induced vibration from the surface of the body (Salerno &
Zanetti, 1990a). This signal was also given the name Sternal Ballistocardiography as it was
recorded from the sternum and had similarities to the ballistocardiogram (Mckay et al.,
1999) (Tavakolian et al., 2008b). A cycle of synchronous SCG and ECG is shown in Fig. 3.
It was shown later on that changes in SCG after exercise was more sensitive for detection of
moderate coronary artery stenosis than ECG. Later, the same claim was proven on more
number of patients, 505, that the qualitative seismocardiography was more accurate, both in
sensitivity and specificity, than electrocardiography for detection of coronary artery
stenosis. This was true for severe, multivessle disease as well as for moderate disease and
also for presence or absence of myocardial infarction (Salerno et al., 1990b).
There are two different subgroups of signals that have been introduced so far as
seismocardiogram. In the first group, which consists the majority of the papers, the signal is
recorded by positioning of an accelerometer on the sternum while in the second group other
places on the torso such as left clavicle (Castiglioni et al. 2007) or hip (Trefny, 2005) were
used. Thus, in a wider sense seismocardiogram is recording of cardiac induced vibrations on
the upper part of the body while in a particular definition given by Salerno and his group
seismocardiogram, is just limited to the vibration signals recorded from the sternum.
The first commercial SCG instrument was a failure as it required a heavy and bulky
seismology sensor on the sternum which was cumbersome to tolerate for a long time. New
sensor technologies have provided new possibilities for portable and wireless sensors that
can be worn under clothing to record the SCG signal during daily activities. A new line of
research has emerged aiming to re-introduce SCG as a clinical instrument that can be used
to noninvasively and inexpensively diagnose cardiac abnormalities (Akhbardeh et al., 2007)
(Castiglioni et al. 2007) (Tavakolian et al. 2008b).
Fig. 3. A cycle of ECG (top) and SCG signals, from the second author, and the sequence of
cardiac events assigned to it based on Salerno’s research (Crow et al. 1994)
BiomedicalEngineering244
Fig. 4. Right: Positioning of different layers of tissues that the radar signal will go through.
Left: two cycles of the R-SCG, SCG and ECG signals (Tavakolian et al., 2008a).
2.1.3 Radar seismocardiogram (R-SCG) and its Medical Relevance
Radar seismocardiogram also known as radarcardiogram (Geisheimer & Greneker, 1999)
and mechanocardiogram (Tavakolian et al., 2008a) reflects the mechanical dynamics of the
heart recorded by contactless methods. While monitoring the heart away from the chest the
signal passes through only a few layers of different tissues between the sternum and the
heart which can be seen in Fig.4. The tissue layers between the sensor and heart muscle
include: skin, sternum, lung and pleural tissue, pericardium and pericardial space. From the
sternum position these tissue layers are thinner compared to the other positions. Therefore,
the best position to record the heart's R-SCG signal is from the sternum. R-SCG signal has
close relationship to SCG signal as can be seen in Fig 4. In other words, proper processing of
the radar signal reflected from the chest will enable us to extract a signal (R-SCG) which is
very similar in morphology to SCG thus, a better understanding of SCG mechanism helps us
understand R-SCG signal as well.
Some hemodynamic parameters can be extracted from either the amplitute or timings of R-
SCG signal as can be seen in Fig. 5. The amplitute of R-SCG is an indication of the cardiac
contractility thus, it is correlated with stroke volume and cardiac output (Mckay et al. 1999).
The time intervals between the R-SCG peaks is correlated with cardiac intervals such as
isovolumic contraction and relaxation times and ventricular ejection time. Calculation of
these three cardiac intervals from R-SCG will provide us with the possibility of noninvasive
calculation of a combined myocardial performance index called Tei-index.
Tei index equals isovolumic contraction time plus isovolumic relaxation time divided by
ejection time
. Congestive heart failure is related to contraction and relaxation abnormalities
of the ventricle. Isolated analysis of either mechanism may not be reective of overall cadiac
dysfunction. Tei-index has been described to be more effective for analysis of global cardiac
dysfunction than systolic and diastolic measures alone. Tei-Index is evaluated against
invasive examinations and proved to be a sensitive indicator of overall cardiac dysfunction
in patients with mild-to-moderate congestive heart failure (Brush et al., 2000).
Fig. 5. Possible extraction of clinical parameters from R-SCG.
Vital signs are measures of various physiological statistics in order to monitors the most
basic body functions. There are four standard vital signs: heart rate, respiratory rate, blood
pressure and body temprature. Blood pressure is the pressure of the blood in the arteris and
is created by the contraction of the heart. In clincs the blood presure is normally reported by
two numbers. The higher number correponds to the systolic blood presure and is measured
after the heart contracts and the other one is diastolic blood pressure and is measured befor
the heart contraction.
Using R-SCG heart and breathing rates, can be reliably estimated. Further improvement of
the current technolgy can enable us to estimate blood pressure from the R-SCG signal in
future. The interval between the openning of aorta to the point of maximum systolic ejection
is inversely proportional to the blood presure and can be used for the estimation of systolic
blood pressure. In a novel study, from BCG signals acquired from bathroom scale, the
interval between the R wave of ECG signal to the rapid ejection point of BCG was used for
this estimation (Kim et al. 2006). Thus, except for temprature R-SCG can enable us to
monitor three of the four vital signs as mentioned above.
2.1.4. Comparison Study of Infrasonic Cardiac Signals
As mentioned before, BCG signal is the most studied signal in the field of infrasonic cardiac
signals and has been around for about a century. BCG is different compared to R-SCG and
SCG as it reflects the movement of the center of gravity of the whole body and its support
while the SCG and R-SCG signals reflect the mechanical vibration of the upper part of the
body as recorded from its surface. Fig. 1. shows the differnt setups that were used for the
acquistion of these signals.
The SCG and R-SCG signals are recorded from positions closer to the heart thus, there are
less mechanical damping of the cardiac vibration compared to classical BCG in which, the
Contact-lessAssessmentofIn-vivoBodySignalsUsingMicrowaveDopplerRadar 245
Fig. 4. Right: Positioning of different layers of tissues that the radar signal will go through.
Left: two cycles of the R-SCG, SCG and ECG signals (Tavakolian et al., 2008a).
2.1.3 Radar seismocardiogram (R-SCG) and its Medical Relevance
Radar seismocardiogram also known as radarcardiogram (Geisheimer & Greneker, 1999)
and mechanocardiogram (Tavakolian et al., 2008a) reflects the mechanical dynamics of the
heart recorded by contactless methods. While monitoring the heart away from the chest the
signal passes through only a few layers of different tissues between the sternum and the
heart which can be seen in Fig.4. The tissue layers between the sensor and heart muscle
include: skin, sternum, lung and pleural tissue, pericardium and pericardial space. From the
sternum position these tissue layers are thinner compared to the other positions. Therefore,
the best position to record the heart's R-SCG signal is from the sternum. R-SCG signal has
close relationship to SCG signal as can be seen in Fig 4. In other words, proper processing of
the radar signal reflected from the chest will enable us to extract a signal (R-SCG) which is
very similar in morphology to SCG thus, a better understanding of SCG mechanism helps us
understand R-SCG signal as well.
Some hemodynamic parameters can be extracted from either the amplitute or timings of R-
SCG signal as can be seen in Fig. 5. The amplitute of R-SCG is an indication of the cardiac
contractility thus, it is correlated with stroke volume and cardiac output (Mckay et al. 1999).
The time intervals between the R-SCG peaks is correlated with cardiac intervals such as
isovolumic contraction and relaxation times and ventricular ejection time. Calculation of
these three cardiac intervals from R-SCG will provide us with the possibility of noninvasive
calculation of a combined myocardial performance index called Tei-index.
Tei index equals isovolumic contraction time plus isovolumic relaxation time divided by
ejection time
. Congestive heart failure is related to contraction and relaxation abnormalities
of the ventricle. Isolated analysis of either mechanism may not be reective of overall cadiac
dysfunction. Tei-index has been described to be more effective for analysis of global cardiac
dysfunction than systolic and diastolic measures alone. Tei-Index is evaluated against
invasive examinations and proved to be a sensitive indicator of overall cardiac dysfunction
in patients with mild-to-moderate congestive heart failure (Brush et al., 2000).
Fig. 5. Possible extraction of clinical parameters from R-SCG.
Vital signs are measures of various physiological statistics in order to monitors the most
basic body functions. There are four standard vital signs: heart rate, respiratory rate, blood
pressure and body temprature. Blood pressure is the pressure of the blood in the arteris and
is created by the contraction of the heart. In clincs the blood presure is normally reported by
two numbers. The higher number correponds to the systolic blood presure and is measured
after the heart contracts and the other one is diastolic blood pressure and is measured befor
the heart contraction.
Using R-SCG heart and breathing rates, can be reliably estimated. Further improvement of
the current technolgy can enable us to estimate blood pressure from the R-SCG signal in
future. The interval between the openning of aorta to the point of maximum systolic ejection
is inversely proportional to the blood presure and can be used for the estimation of systolic
blood pressure. In a novel study, from BCG signals acquired from bathroom scale, the
interval between the R wave of ECG signal to the rapid ejection point of BCG was used for
this estimation (Kim et al. 2006). Thus, except for temprature R-SCG can enable us to
monitor three of the four vital signs as mentioned above.
2.1.4. Comparison Study of Infrasonic Cardiac Signals
As mentioned before, BCG signal is the most studied signal in the field of infrasonic cardiac
signals and has been around for about a century. BCG is different compared to R-SCG and
SCG as it reflects the movement of the center of gravity of the whole body and its support
while the SCG and R-SCG signals reflect the mechanical vibration of the upper part of the
body as recorded from its surface. Fig. 1. shows the differnt setups that were used for the
acquistion of these signals.
The SCG and R-SCG signals are recorded from positions closer to the heart thus, there are
less mechanical damping of the cardiac vibration compared to classical BCG in which, the
BiomedicalEngineering246
heart moves the whole body and the recording system (Bed, chair and weight scale). This
finds more importance in the sense that, being close to the heart, SCG and R-SCG are able to
trace valvular activities while these tiny movements gets dampen out by the classical BCG
beds. Thus, in terms of evaluation of timings of valvular events SCG and R-SCG are a better
reference compared to BCG.
Fig. 6. The two main factors determining the R-SCG and SCG morphology and the possible
tools for investigating them.
On the other hand, as BCG is a record of the sum of all the cardiovascular forces exerted on
the body thus, its amplitude is a more faithful representation of the force of cardiac system
compared to SCG and R-SCG which reflect a portion of this force that affects the upper body
thus, BCG is a better candidate to estimate stroke volume and cardiac output compared to
SCG. The old BCG instruments were quite bulky and required the patients to lie down on
beds suspended from the ceiling while SCG and R-SCG facilitate signal recording and thus,
provide alternative possibilities that BCG was inherently unable to.
Using R-SCG, on the other hand, provides a unique advantage, over other infrasoinc cardiac
signals, that it does not require any mechanical contact to the body. Thus, in applications
such as monitoring new born babies, to avoid sudden infant death syndrome (SIDS), R-SCG
contactless recording is an advantage.
2.2. The Genesis of R-SCG waves
As mentioned previously the R-SCG morphology has close resemblance to SCG and it
basically signals the same events in the cardiac cycle as SCG does. Thus, in this section, we
briefly introduce different methods used for understanding of the genesis of SCG waves,
assuming that this knowledge can be transferred to the R-SCG field as well.
The waves observed on R-SCG and SCG signals originate from two main cardiovascular
phenomenons of myocardial contraction and arterial circulation. In other words, some
components of the R-SCG are due to vibration waves directly created by the heart
contractions and transferred to the surface of the body, and some other components are
because of the recoil created by the circulation of blood in the arteries.
In a study conducted by Salerno the SCG signal was simultaneously recorded together with
echocardiograph images for 39 subjects and it was shown that aortic and mitral valve
opening and closures could be corresponded to peaks and valleys on the SCG signal (Crow
et al. 1994). An example of SCG traces recorded in CiBER and annotated based on Salerno’s
work can be seen in Fig. 3. After the P wave on ECG and during the QRS complex there is a
local maximum correponding to the Mitral valve closure (MC) the interval between this
point and the next maximum (The aortic valve opening) is the iso-volumic contraction
interval. Rapid systolic ejection point (RE) is the next maximum after that, as it can also be
identified in the Doppler echocardiogram on the left side of Fig.7 At the end of the sytole the
aorta closes (AC) followed by the opening of the Miral valve (MO). The interval between AC
and MO is defined as iso-volumic relaxation time.
The simultaneous echocardiogram and SCG and ECG signal used for investigation of
cardiac events as recorded on the SCG signal can be seen in Fig. 7. On the left side of the
figure by using Doppler echocardiogram and SCG; point of rapid systolic ejection is shown
by a vertical red line in two consecutive cycles. On the right side of Fig. 7 the M-mode
echocardiogram is shown and the aortic valve opening time is shown by a vertical green line
and the aortic valve closure with a dotted blue line. The Echocardiograms were recorded in
Burnaby General Hospital, Canada, using a GE vivid 7 system.
Echocardiograph is still the gold standard for investigation of the origin of the waves
observed on R-SCG and SCG signals but there are two reasons to investigate for alternative
solutions besides echocardiography. Firstly, echocardiography has limitations: being
operator dependant, being dependant on the position of the transducer, and being limited to
a few numbers of beats. Secondly, by using the Echo images alone we still do not clearly
know how the underlying cardiac events create the waves observed on the signal recorded
from the chest. The reason is the fact that these cardiac events superimpose on each other
and sometimes amplify or decrease each other’s effects. Thus, as can be seen in Fig. 6, other
methodologies such as Cine-MRI and 3D, finite element, electromechanical model of the
heart have been proposed to study the effect of cardiac contraction (Akhbardeh et al. 2009)
and, on the other hand, classical BCG and Doppler echocardiogram have been proposed to
study the effects of blood circulation on the SCG morphology (Ngai et al. 2009).
Phonocardiogram can also be used to study the effects of cardiac vibrations on the R-SCG
morphology as can be seen in Fig. 10. The heart sounds as observed on phonocardiogram
can be used to study the effects of valvular events on the morphology of the signal. Two
cycles of synchronous radar R-SCG, Phonocardiograph and ECG signal showing the
correlation of cardiac cycle events to R-SCG signal. Systolic and diastolic complexes can be
identified in the radar R-SCG signal corresponding to S1 and S2 of heart sounds.
Contact-lessAssessmentofIn-vivoBodySignalsUsingMicrowaveDopplerRadar 247
heart moves the whole body and the recording system (Bed, chair and weight scale). This
finds more importance in the sense that, being close to the heart, SCG and R-SCG are able to
trace valvular activities while these tiny movements gets dampen out by the classical BCG
beds. Thus, in terms of evaluation of timings of valvular events SCG and R-SCG are a better
reference compared to BCG.
Fig. 6. The two main factors determining the R-SCG and SCG morphology and the possible
tools for investigating them.
On the other hand, as BCG is a record of the sum of all the cardiovascular forces exerted on
the body thus, its amplitude is a more faithful representation of the force of cardiac system
compared to SCG and R-SCG which reflect a portion of this force that affects the upper body
thus, BCG is a better candidate to estimate stroke volume and cardiac output compared to
SCG. The old BCG instruments were quite bulky and required the patients to lie down on
beds suspended from the ceiling while SCG and R-SCG facilitate signal recording and thus,
provide alternative possibilities that BCG was inherently unable to.
Using R-SCG, on the other hand, provides a unique advantage, over other infrasoinc cardiac
signals, that it does not require any mechanical contact to the body. Thus, in applications
such as monitoring new born babies, to avoid sudden infant death syndrome (SIDS), R-SCG
contactless recording is an advantage.
2.2. The Genesis of R-SCG waves
As mentioned previously the R-SCG morphology has close resemblance to SCG and it
basically signals the same events in the cardiac cycle as SCG does. Thus, in this section, we
briefly introduce different methods used for understanding of the genesis of SCG waves,
assuming that this knowledge can be transferred to the R-SCG field as well.
The waves observed on R-SCG and SCG signals originate from two main cardiovascular
phenomenons of myocardial contraction and arterial circulation. In other words, some
components of the R-SCG are due to vibration waves directly created by the heart
contractions and transferred to the surface of the body, and some other components are
because of the recoil created by the circulation of blood in the arteries.
In a study conducted by Salerno the SCG signal was simultaneously recorded together with
echocardiograph images for 39 subjects and it was shown that aortic and mitral valve
opening and closures could be corresponded to peaks and valleys on the SCG signal (Crow
et al. 1994). An example of SCG traces recorded in CiBER and annotated based on Salerno’s
work can be seen in Fig. 3. After the P wave on ECG and during the QRS complex there is a
local maximum correponding to the Mitral valve closure (MC) the interval between this
point and the next maximum (The aortic valve opening) is the iso-volumic contraction
interval. Rapid systolic ejection point (RE) is the next maximum after that, as it can also be
identified in the Doppler echocardiogram on the left side of Fig.7 At the end of the sytole the
aorta closes (AC) followed by the opening of the Miral valve (MO). The interval between AC
and MO is defined as iso-volumic relaxation time.
The simultaneous echocardiogram and SCG and ECG signal used for investigation of
cardiac events as recorded on the SCG signal can be seen in Fig. 7. On the left side of the
figure by using Doppler echocardiogram and SCG; point of rapid systolic ejection is shown
by a vertical red line in two consecutive cycles. On the right side of Fig. 7 the M-mode
echocardiogram is shown and the aortic valve opening time is shown by a vertical green line
and the aortic valve closure with a dotted blue line. The Echocardiograms were recorded in
Burnaby General Hospital, Canada, using a GE vivid 7 system.
Echocardiograph is still the gold standard for investigation of the origin of the waves
observed on R-SCG and SCG signals but there are two reasons to investigate for alternative
solutions besides echocardiography. Firstly, echocardiography has limitations: being
operator dependant, being dependant on the position of the transducer, and being limited to
a few numbers of beats. Secondly, by using the Echo images alone we still do not clearly
know how the underlying cardiac events create the waves observed on the signal recorded
from the chest. The reason is the fact that these cardiac events superimpose on each other
and sometimes amplify or decrease each other’s effects. Thus, as can be seen in Fig. 6, other
methodologies such as Cine-MRI and 3D, finite element, electromechanical model of the
heart have been proposed to study the effect of cardiac contraction (Akhbardeh et al. 2009)
and, on the other hand, classical BCG and Doppler echocardiogram have been proposed to
study the effects of blood circulation on the SCG morphology (Ngai et al. 2009).
Phonocardiogram can also be used to study the effects of cardiac vibrations on the R-SCG
morphology as can be seen in Fig. 10. The heart sounds as observed on phonocardiogram
can be used to study the effects of valvular events on the morphology of the signal. Two
cycles of synchronous radar R-SCG, Phonocardiograph and ECG signal showing the
correlation of cardiac cycle events to R-SCG signal. Systolic and diastolic complexes can be
identified in the radar R-SCG signal corresponding to S1 and S2 of heart sounds.
BiomedicalEngineering248
Fig. 7. left: Doppler echocardiogram and SCG; right: M-mode echocardiogram
2.3 Doppler Based Radar System
Radio detection and ranging (Radar) systems are used to identify the range, direction, or
speed of both moving and fixed objects such as aircrafts, vehicles and terrains. These
systems are usually comprised of an RF/Microwave transceiver to transmit the
Electromagnetic signal to the object under test and receive the reflected wave carrying the
required data. Depending on the application, this data is further processed using basic or
advanced signal processing techniques. Microwave Doppler radar-based systems are one of
the most common applications of radar in everyday life. These systems will be discussed in
detail in Section 3.
A class of radars utilize Doppler Effect to measure the velocity of moving objects. This kind
of approach has long been used to estimate the velocity of moving vehicles for speed control
and other purposes. The Doppler principle has been used in different modalities including
microwave, laser and ultrasound. Doppler radars are commercially used in air defence, air
traffic control, sounding satellites, and even police speed guns.
Microwave electromagnetic waves can propagate through the body and are reflected at the
interfaces between different tissue layers. By the Doppler Effect for Microwave radar, if a
radio frequency wave is transmitted to a moving surface, the reflected wave undergoes a
frequency shift proportional to the surface velocity. If the surface has periodic motion, like
that of the heart and chest, this can also be seen as a phase shift proportional to the surface
displacement. If this displacement is small compared to the wavelength, a low-frequency
component can be extracted from downconversion and filtering (removing the high-
frequency component) the reflected wave that is directly proportional to the object
displacement.
The Doppler Effect can be written as (Skolnik, 1990):
)1(
0
Cos
c
v
r
(1)
where ω
r
corresponds to the reflected wave frequency, ω
0
corresponds to the transmitted
wave frequency, v corresponds to the relative speed, c corresponds to the prorogation speed
of the wave (in this case, the Electromagnetic wave speed which is 3×10
8
m/s in free space)
and finally, α corresponds to the angle of the reflected wave versus the moving object. If the
transmitter and the moving object are approaching each other, then the reflected wave
frequency is higher than the transmitted wave frequency (ω
r
> ω
0
) and if they are departing
from each other, then the reflected wave is lower than the transmitted wave frequency
(ω
r
<ω
0
). Assuming the transmitted wave direction to be along the movement direction of the
object under test (α=0), the Doppler Effect for a return way can be re-written as:
)
2
1(
00
c
v
Dr
(2)
Therefore, the speed of the moving object can be calculated. The operation of the Microwave
radar based systems will be further analysed in Section 3.3.
2.4 The Ultra-wideband (UWB) Radar for Biomedical Applications
In 2002, the Federal Communications Commission (FCC) allocated the 3.1 to 10.6GHz band
to ultra-wideband (UWB) communication systems in which the systems have a bandwidth
greater than 500MHz and a maximum equivalent isotropic radiated power (EIRP) spectral
density of −41.3dBm/MHz (FCC, 2002). This broad definition has encouraged a variety of
UWB variants for different applications including UWB Doppler radar for vital signal
sensing (Staderini, 2002a). UWB power levels are very low and therefore reduce the risk of
molecular ionization (Jauchem et al., 1998). In addition, advances in modern silicon
integration technologies with high cutoff frequencies allow for small, low-power
implementation of UWB sensors. Time-gating of short radar UWB pulses allows for
additional power efficiency; however, as explained in section 3.2., new design challenges on
the control of sampling at the receiver is introduced.
Doppler radar-based systems for cardiovascular and respiratory measurements date back to
the late 1970’s and early 1980’s for the X-band (around 10GHz) (Lin, 1975; Lin, 1979; Chen et
al., 1986). In mid-1980s, a frequency-modulated-continuous wave (FM-CW) system was
developed to detect the vital signs of a wounded soldier in live fire situations at distances of
up to 100 meters (Greneker, 1997). Despite its severe limitations such as sensitivity to
surrounding objects, this device was the first of the many later developed radar vital signs
monitor (RVSM) devices (Thansandote et al., 1983).
RVSM devices are capable of detecting human heart beat and respiration rate in a contact-
less manner, by transmitting a radio frequency signal to the subject and measuring the
phase shift in the reflected signal based on the Doppler Effect. During the 1996 Olympics, a
variant of the RVSM, developed by Georgia Tech Research Institute (GTRI), (Greneker,
1997), was developed for assessment of the performance of the athletes in the archery and
rifle competitions. Human heartbeat and respiration signals were measured at ranges
exceeding 10 meters using this RVSM that was mounted onto a 0.6m parabolic dish antenna
and transmitted an output power of 30mW at 24.1 GHz. Other suggested applications for
these devices include home telemedicine monitoring systems and security applications.
Major problems with these devices include sensitivity to surroundings due to weak signal
processing and their high cost due to bulkiness.
In (Thansandote et al., 1983), a microwave Doppler radar system was reported for
continuously monitoring time-varying biological impedances. The radar compares the
phase of the signal scattered from the biological tissue with that of the transmitted signal.
Contact-lessAssessmentofIn-vivoBodySignalsUsingMicrowaveDopplerRadar 249
Fig. 7. left: Doppler echocardiogram and SCG; right: M-mode echocardiogram
2.3 Doppler Based Radar System
Radio detection and ranging (Radar) systems are used to identify the range, direction, or
speed of both moving and fixed objects such as aircrafts, vehicles and terrains. These
systems are usually comprised of an RF/Microwave transceiver to transmit the
Electromagnetic signal to the object under test and receive the reflected wave carrying the
required data. Depending on the application, this data is further processed using basic or
advanced signal processing techniques. Microwave Doppler radar-based systems are one of
the most common applications of radar in everyday life. These systems will be discussed in
detail in Section 3.
A class of radars utilize Doppler Effect to measure the velocity of moving objects. This kind
of approach has long been used to estimate the velocity of moving vehicles for speed control
and other purposes. The Doppler principle has been used in different modalities including
microwave, laser and ultrasound. Doppler radars are commercially used in air defence, air
traffic control, sounding satellites, and even police speed guns.
Microwave electromagnetic waves can propagate through the body and are reflected at the
interfaces between different tissue layers. By the Doppler Effect for Microwave radar, if a
radio frequency wave is transmitted to a moving surface, the reflected wave undergoes a
frequency shift proportional to the surface velocity. If the surface has periodic motion, like
that of the heart and chest, this can also be seen as a phase shift proportional to the surface
displacement. If this displacement is small compared to the wavelength, a low-frequency
component can be extracted from downconversion and filtering (removing the high-
frequency component) the reflected wave that is directly proportional to the object
displacement.
The Doppler Effect can be written as (Skolnik, 1990):
)1(
0
Cos
c
v
r
(1)
where ω
r
corresponds to the reflected wave frequency, ω
0
corresponds to the transmitted
wave frequency, v corresponds to the relative speed, c corresponds to the prorogation speed
of the wave (in this case, the Electromagnetic wave speed which is 3×10
8
m/s in free space)
and finally, α corresponds to the angle of the reflected wave versus the moving object. If the
transmitter and the moving object are approaching each other, then the reflected wave
frequency is higher than the transmitted wave frequency (ω
r
> ω
0
) and if they are departing
from each other, then the reflected wave is lower than the transmitted wave frequency
(ω
r
<ω
0
). Assuming the transmitted wave direction to be along the movement direction of the
object under test (α=0), the Doppler Effect for a return way can be re-written as:
)
2
1(
00
c
v
Dr
(2)
Therefore, the speed of the moving object can be calculated. The operation of the Microwave
radar based systems will be further analysed in Section 3.3.
2.4 The Ultra-wideband (UWB) Radar for Biomedical Applications
In 2002, the Federal Communications Commission (FCC) allocated the 3.1 to 10.6GHz band
to ultra-wideband (UWB) communication systems in which the systems have a bandwidth
greater than 500MHz and a maximum equivalent isotropic radiated power (EIRP) spectral
density of −41.3dBm/MHz (FCC, 2002). This broad definition has encouraged a variety of
UWB variants for different applications including UWB Doppler radar for vital signal
sensing (Staderini, 2002a). UWB power levels are very low and therefore reduce the risk of
molecular ionization (Jauchem et al., 1998). In addition, advances in modern silicon
integration technologies with high cutoff frequencies allow for small, low-power
implementation of UWB sensors. Time-gating of short radar UWB pulses allows for
additional power efficiency; however, as explained in section 3.2., new design challenges on
the control of sampling at the receiver is introduced.
Doppler radar-based systems for cardiovascular and respiratory measurements date back to
the late 1970’s and early 1980’s for the X-band (around 10GHz) (Lin, 1975; Lin, 1979; Chen et
al., 1986). In mid-1980s, a frequency-modulated-continuous wave (FM-CW) system was
developed to detect the vital signs of a wounded soldier in live fire situations at distances of
up to 100 meters (Greneker, 1997). Despite its severe limitations such as sensitivity to
surrounding objects, this device was the first of the many later developed radar vital signs
monitor (RVSM) devices (Thansandote et al., 1983).
RVSM devices are capable of detecting human heart beat and respiration rate in a contact-
less manner, by transmitting a radio frequency signal to the subject and measuring the
phase shift in the reflected signal based on the Doppler Effect. During the 1996 Olympics, a
variant of the RVSM, developed by Georgia Tech Research Institute (GTRI), (Greneker,
1997), was developed for assessment of the performance of the athletes in the archery and
rifle competitions. Human heartbeat and respiration signals were measured at ranges
exceeding 10 meters using this RVSM that was mounted onto a 0.6m parabolic dish antenna
and transmitted an output power of 30mW at 24.1 GHz. Other suggested applications for
these devices include home telemedicine monitoring systems and security applications.
Major problems with these devices include sensitivity to surroundings due to weak signal
processing and their high cost due to bulkiness.
In (Thansandote et al., 1983), a microwave Doppler radar system was reported for
continuously monitoring time-varying biological impedances. The radar compares the
phase of the signal scattered from the biological tissue with that of the transmitted signal.
BiomedicalEngineering250
The phase variations of the scattered signal are indicate the net impedance changes in the
test region due to physiological processes, e.g. movements of blood vessels during the
cardiac cycle. The system operation at both frequencies of 3GHz and 10.5GHz was tested
with healthy human subjects. The 3GHz operation frequency for the Doppler radar system
was shown to have significantly greater penetration in tissues but was less sensitive to
changes of the biological impedance than the 10.5GHz system.
A simple add-on module was reported in (Lubecke et al., 2002) that allows the Doppler
radar based detection of human respiration and heart activity using the 2.4 GHz cordless
telephone system without requiring modifications in the existing telephone infrastructure.
This module includes an inverted F-type antenna combined with a Schottky diode as the
mixing element. The implemented module is very small in size but does not implement the
complete system and the receiver baseband section is implemented on a digitizing
oscilloscope.
A digital signal processor was described in (Lohman et al., 2002) for the determination of
respiration and heart rates in Doppler radar measurements for remote monitoring. The
processor can reliably calculate both rates for a subject at distances of 2m. Several
enhancement techniques such as autocorrelation and center clipping are used. The
calculated heart rates agree for over 88% of the cases, within a 2% margin, for all datasets.
The first single-chip radios for the remote sensing of vital signs using direct-conversion
radars integrated in low-cost silicon technologies were implemented in (Droitcour et al.,
2001). Two Doppler radar systems operating at 1.6GHz were fabricated using
CMOS/BiCMOS technologies with more than 83% agreement with references. Despite the
high phase noise of the integrated oscillators, heart and respiration rates were detected
remotely, using phase noise reduction through range correlation (Droitcour et al., 2001).
In (Thijs et al., 2005), the data obtained from a commercially available continuous-wave
Doppler radar sensor (KMY24) was compared to an ICG device using a Cardiac Output
Monitor (Medis Niccomo). The obtained data was shown to be clearer on the captured radar
signal than on the ICG, for example, the opening of the atrium and the mitral valve (Thijs et
al., 2005).
An infant vital sign monitor device is reported in (Li et al., 2009). This device operates at 5.8
GHz and monitors the existence of the infant’s heart and respiration rate. Therefore, the
signal processing required for this device is simplified.
Several UWB Microwave Doppler radar based implementations have also been reported in
the literature based on (McEwan, 1994). A bread-board UWB prototype is implemented in
(Michahelles et al., 2004) that can determine the heart-rate at a distance of up to 15cm with a
relative error of 5% compared to oximeter measurements.
Another UWB prototype was developed in (Staderini, 2002b) using a dipole antenna that
emits 2ns pulses with a mean pulse repetition frequency (PRF) of 2MHz. This prototype is
used to measure the HRV signal. Using fast Fourier transform (FFT), the spectral content of
the radar captured signal is compared to an ECG-derived HRV signal and good correlations
are confirmed.
UWB radar systems have also been reported to detect human beings behind walls
Meyerhoff, 2007), or as lie detectors (Staderini, 2002b), or as human activity monitoring, e.g.,
detection of walking, running, sleeping, etc., (Dutta et al., 2006; Such et al., 2006; Chia et al.,
2005) using the body signals.
A system-on-chip (SoC) implementation of a UWB vital signal sensor is in progress funded
by the European Union (Zito et al., 2007; Zito et al., 2008). In this project, a wearable UWB
radar wireless sensor for detection of heart and breath rates is to be implemented using
CMOS 90nm technology. Short pulses of 200-300ps duration with a PRF of 1-10 MHz are
used (Zito et al., 2008). An IEEE 802.15.4 ZigBee (ZigBee Alliance, 2004) low-power radio
interface is used for wireless data communication.
3. The Microwave Doppler-Based Radar System Blocks and Specifications
A block diagram depicting the main blocks of the Microwave Doppler-based radar system is
shown in Fig. 8. As shown in this figure, these devices are generally composed of two main
stages: The RF stage and the baseband signal processing stage. The RF stage includes an
RF/UWB transceiver block to transmit the radar wave and receive the reflected wave. The
received wave includes the frequency shift due to the motion/velocity of the target (e.g.
thorax, blood flow). The received signal is down-converted and low-pass filtered to extract
the baseband shifting data. This baseband signal is further amplified, digitized, and
processed in the baseband stage. The digital signal processing techniques can be
implemented in hardware or software.
In this section, the Doppler based Radar system is analyzed, the main stages as shown in
Fig. 8 are reviewed, and some major reported ideas for on-board and CMOS integrated
implementation of these blocks are discussed.
3.1 The RF Stage
As shown in Fig. 1, on the transmit side, the RF stage includes a pulse generator (Gaussian
pulse, in case of UWB system), a mixer (LO) to modulate the pulse, a power amplifier (PA)
to radiate the modulated pulse, and finally a transmitting antenna. The transmitted signal
can be a continuous wave monochrome (single frequency) non-modulated sinusoidal radar
signal. In this case the system is simplified to the non-dashed blocks and only the signal
generated at the LO is transmitted (no pulse generator or mixer stage required).
On the receive side, the reflected beams are captured by the receiving antenna, followed by
a low-noise amplifier (LNA), a downconversion mixer, and a low-pass filter. The
downconversion mixer multiplies the received signal by a replica (a delayed replica if time-
gating is used) of the same signal as the one at the transmit side to demodulate it. The signal
is then filtered to extract the low frequency component that includes the shift depending on
the object motion data. Similar to the transmit side, if monochrome radar is used, no
downconversion mixer stage is required.
The choice of a proper frequency is a compromise and depends on the test objectives, as a
higher frequency enables a larger Doppler shift and therefore a higher resolution, but also
results in a lower tissue penetration depth. In many reported works, the 2.45GHz frequency
is chosen to exploit the commercially available components, e.g. (Lubecke et al., 2002). The
frequency of the transmitted beam is adjusted by the mixer signal provided by the local
oscillator (LO) block. The LO signal can be a voltage controlled oscillator (VCO) or simply a
crystal oscillator. In the case of UWB radar systems, a short Gaussian monopulse is
generated with a pulse-width in the order of magnitude of a few nanoseconds. Several short
pulse generators have been reported in the literature. For example, digital pulse generators
Contact-lessAssessmentofIn-vivoBodySignalsUsingMicrowaveDopplerRadar 251
The phase variations of the scattered signal are indicate the net impedance changes in the
test region due to physiological processes, e.g. movements of blood vessels during the
cardiac cycle. The system operation at both frequencies of 3GHz and 10.5GHz was tested
with healthy human subjects. The 3GHz operation frequency for the Doppler radar system
was shown to have significantly greater penetration in tissues but was less sensitive to
changes of the biological impedance than the 10.5GHz system.
A simple add-on module was reported in (Lubecke et al., 2002) that allows the Doppler
radar based detection of human respiration and heart activity using the 2.4 GHz cordless
telephone system without requiring modifications in the existing telephone infrastructure.
This module includes an inverted F-type antenna combined with a Schottky diode as the
mixing element. The implemented module is very small in size but does not implement the
complete system and the receiver baseband section is implemented on a digitizing
oscilloscope.
A digital signal processor was described in (Lohman et al., 2002) for the determination of
respiration and heart rates in Doppler radar measurements for remote monitoring. The
processor can reliably calculate both rates for a subject at distances of 2m. Several
enhancement techniques such as autocorrelation and center clipping are used. The
calculated heart rates agree for over 88% of the cases, within a 2% margin, for all datasets.
The first single-chip radios for the remote sensing of vital signs using direct-conversion
radars integrated in low-cost silicon technologies were implemented in (Droitcour et al.,
2001). Two Doppler radar systems operating at 1.6GHz were fabricated using
CMOS/BiCMOS technologies with more than 83% agreement with references. Despite the
high phase noise of the integrated oscillators, heart and respiration rates were detected
remotely, using phase noise reduction through range correlation (Droitcour et al., 2001).
In (Thijs et al., 2005), the data obtained from a commercially available continuous-wave
Doppler radar sensor (KMY24) was compared to an ICG device using a Cardiac Output
Monitor (Medis Niccomo). The obtained data was shown to be clearer on the captured radar
signal than on the ICG, for example, the opening of the atrium and the mitral valve (Thijs et
al., 2005).
An infant vital sign monitor device is reported in (Li et al., 2009). This device operates at 5.8
GHz and monitors the existence of the infant’s heart and respiration rate. Therefore, the
signal processing required for this device is simplified.
Several UWB Microwave Doppler radar based implementations have also been reported in
the literature based on (McEwan, 1994). A bread-board UWB prototype is implemented in
(Michahelles et al., 2004) that can determine the heart-rate at a distance of up to 15cm with a
relative error of 5% compared to oximeter measurements.
Another UWB prototype was developed in (Staderini, 2002b) using a dipole antenna that
emits 2ns pulses with a mean pulse repetition frequency (PRF) of 2MHz. This prototype is
used to measure the HRV signal. Using fast Fourier transform (FFT), the spectral content of
the radar captured signal is compared to an ECG-derived HRV signal and good correlations
are confirmed.
UWB radar systems have also been reported to detect human beings behind walls
Meyerhoff, 2007), or as lie detectors (Staderini, 2002b), or as human activity monitoring, e.g.,
detection of walking, running, sleeping, etc., (Dutta et al., 2006; Such et al., 2006; Chia et al.,
2005) using the body signals.
A system-on-chip (SoC) implementation of a UWB vital signal sensor is in progress funded
by the European Union (Zito et al., 2007; Zito et al., 2008). In this project, a wearable UWB
radar wireless sensor for detection of heart and breath rates is to be implemented using
CMOS 90nm technology. Short pulses of 200-300ps duration with a PRF of 1-10 MHz are
used (Zito et al., 2008). An IEEE 802.15.4 ZigBee (ZigBee Alliance, 2004) low-power radio
interface is used for wireless data communication.
3. The Microwave Doppler-Based Radar System Blocks and Specifications
A block diagram depicting the main blocks of the Microwave Doppler-based radar system is
shown in Fig. 8. As shown in this figure, these devices are generally composed of two main
stages: The RF stage and the baseband signal processing stage. The RF stage includes an
RF/UWB transceiver block to transmit the radar wave and receive the reflected wave. The
received wave includes the frequency shift due to the motion/velocity of the target (e.g.
thorax, blood flow). The received signal is down-converted and low-pass filtered to extract
the baseband shifting data. This baseband signal is further amplified, digitized, and
processed in the baseband stage. The digital signal processing techniques can be
implemented in hardware or software.
In this section, the Doppler based Radar system is analyzed, the main stages as shown in
Fig. 8 are reviewed, and some major reported ideas for on-board and CMOS integrated
implementation of these blocks are discussed.
3.1 The RF Stage
As shown in Fig. 1, on the transmit side, the RF stage includes a pulse generator (Gaussian
pulse, in case of UWB system), a mixer (LO) to modulate the pulse, a power amplifier (PA)
to radiate the modulated pulse, and finally a transmitting antenna. The transmitted signal
can be a continuous wave monochrome (single frequency) non-modulated sinusoidal radar
signal. In this case the system is simplified to the non-dashed blocks and only the signal
generated at the LO is transmitted (no pulse generator or mixer stage required).
On the receive side, the reflected beams are captured by the receiving antenna, followed by
a low-noise amplifier (LNA), a downconversion mixer, and a low-pass filter. The
downconversion mixer multiplies the received signal by a replica (a delayed replica if time-
gating is used) of the same signal as the one at the transmit side to demodulate it. The signal
is then filtered to extract the low frequency component that includes the shift depending on
the object motion data. Similar to the transmit side, if monochrome radar is used, no
downconversion mixer stage is required.
The choice of a proper frequency is a compromise and depends on the test objectives, as a
higher frequency enables a larger Doppler shift and therefore a higher resolution, but also
results in a lower tissue penetration depth. In many reported works, the 2.45GHz frequency
is chosen to exploit the commercially available components, e.g. (Lubecke et al., 2002). The
frequency of the transmitted beam is adjusted by the mixer signal provided by the local
oscillator (LO) block. The LO signal can be a voltage controlled oscillator (VCO) or simply a
crystal oscillator. In the case of UWB radar systems, a short Gaussian monopulse is
generated with a pulse-width in the order of magnitude of a few nanoseconds. Several short
pulse generators have been reported in the literature. For example, digital pulse generators
BiomedicalEngineering252
have been suggested in (Wentzeloff & Chandrakasan, 2006), for on-chip or on-board
implementation based on a short delay between two NAND gates.
Fig. 8. The Microwave Doppler Radar-based system block diagram
The modulated signal is amplified by the PA and propagated by the transmitting antenna.
In (Zito et al., 2008), a system-on-chip UWB sensor is implemented using a shaper block for
the mixer and an integrator to sample and low-pass filter the received signal. In (Prak et al,
2007), quadrature mixers are used for the modulation/demodulation stages to increase
accuracy and arctangent demodulation and dc-cancellation methods are used.
3.2 Time-Gating
To reduce power, in particular where battery-operated wireless handheld devices are
implemented, the same antenna and mixing stage can be time-gated between the
transmitting and the receiving stage. For example, by assigning a 50% duty cycle to a
generated square pulse, the system can transmit the illuminating monochrome signal for the
first half of the pulse width and receive the reflected signal for the second half of the pulse
width. Note that in this case the dashed blocks are used in Fig. 1. A switch or a circulator
can be used to implement the time-gating with the desired time-span.
UWB short-pulse systems are usually implemented using this structure and pulses as short
as a few nanoseconds are used. As shown in Fig. 1, the pulse generator also activates a delay
line block. This block controls proper sampling of the received signals from the object. The
receiver only samples at short time intervals triggered by the delay line block. Proper timing
of this triggering is essential to ensure sampling only when the received signals from a
certain distance are received, for example, only when echoes of the heart-wall are expected
(Michahelles et al., 2004). Intuitively, this delay should be equal to the flight time of the
pulse from the radar to the heart and then from the heart to the radar. Note that time gating
and adjusting the sampling time increases the signal-to-noise-ratio at the receiver as less
interference signals due to body movements and other moving objects are sampled.
Therefore, the effect of the interferences is less pronounced.
Time-gating is specified by the pulse repetition frequency (PRF). The PRF is defined as the
number of pulses transmitted per second. It should be noted that depending on the velocity
Pulse
Generator
Cos ω
0
t
Antenna
Antenna
v
z
Cos ω
0
t
Mixer
LPF
ADC
DSP/
Software
LNA
LO
PA
Magnified
Vessel
The Baseband Signal Processing Stage
delay
Moving object
under test
The RF Stage
of the object under test and the application, a minimum PRF should be met that depends on
the radar range and the speed of the radar waves (in this case, c, for electromagnetic waves).
To avoid ambiguity and increase the velocity measurement accuracy, sufficient observation
time is required, which is possible by choosing proper PRF (Skolnik, 1990).
3.3 Analysis
For simplicity and without loss of generalization, assume a monochrome continuous RF-
modulated signal, x(t), is chosen as the radar transmitting signal:
x(t)=A· Cos(ω
0
t)
(3)
The reflected signal captured at the receive side will include the transmitted signal provided
by the signal generator, with a frequency shift, ω
d
, that is proportional to the velocity of the
blood flow. The received signal will therefore include a term:
y(t)=A· Cos[(ω
0
+ ω
d
)t]
(4)
plus some noise terms, where,
c
v
d
0
2
(5)
where ω
0
is the mixer frequency, c is the speed of light, and v is the velocity of the moving
object under test; for example blood-flow velocity in arteries and veins, or the heart wall.
The frequency displacement resulting from the motion of the object under test can also be
modelled as a phase shift, Φ(t), that depends on the velocity: (Thijs et al., 2005; Thansandote
et al., 1983; Lohman et al., 2002)
)(
4
)(
2
)(
0
tsdvt
t
(6)
where λ is the wavelength and s(t) is the movement amplitude. Therefore, the vital signals
such as the movement of the Thorax can be sensed.
In the case of UWB radar, the transmitted signal would be the product of a narrow Gaussian
pulse by the mixer signal:
0
2
2
0
2
)(
exp).()(
n
p
nTt
tCostx
(7)
and the reflected, received signal will include the Doppler shifted component,
2
0
2
0
( )
( ) ( ) exp
2
p
d
n
t nT
y t Cos t
(8)
where ω
0
is angular frequency of UWB modulation signal, ω
d
is the Doppler shift frequency,
μ represents Gaussian envelope phase, σ represents the pulse width and T
p
is the pulse
repetition period (corresponding to the PRF). Here, the added noise components not taken
into account.
Contact-lessAssessmentofIn-vivoBodySignalsUsingMicrowaveDopplerRadar 253
have been suggested in (Wentzeloff & Chandrakasan, 2006), for on-chip or on-board
implementation based on a short delay between two NAND gates.
Fig. 8. The Microwave Doppler Radar-based system block diagram
The modulated signal is amplified by the PA and propagated by the transmitting antenna.
In (Zito et al., 2008), a system-on-chip UWB sensor is implemented using a shaper block for
the mixer and an integrator to sample and low-pass filter the received signal. In (Prak et al,
2007), quadrature mixers are used for the modulation/demodulation stages to increase
accuracy and arctangent demodulation and dc-cancellation methods are used.
3.2 Time-Gating
To reduce power, in particular where battery-operated wireless handheld devices are
implemented, the same antenna and mixing stage can be time-gated between the
transmitting and the receiving stage. For example, by assigning a 50% duty cycle to a
generated square pulse, the system can transmit the illuminating monochrome signal for the
first half of the pulse width and receive the reflected signal for the second half of the pulse
width. Note that in this case the dashed blocks are used in Fig. 1. A switch or a circulator
can be used to implement the time-gating with the desired time-span.
UWB short-pulse systems are usually implemented using this structure and pulses as short
as a few nanoseconds are used. As shown in Fig. 1, the pulse generator also activates a delay
line block. This block controls proper sampling of the received signals from the object. The
receiver only samples at short time intervals triggered by the delay line block. Proper timing
of this triggering is essential to ensure sampling only when the received signals from a
certain distance are received, for example, only when echoes of the heart-wall are expected
(Michahelles et al., 2004). Intuitively, this delay should be equal to the flight time of the
pulse from the radar to the heart and then from the heart to the radar. Note that time gating
and adjusting the sampling time increases the signal-to-noise-ratio at the receiver as less
interference signals due to body movements and other moving objects are sampled.
Therefore, the effect of the interferences is less pronounced.
Time-gating is specified by the pulse repetition frequency (PRF). The PRF is defined as the
number of pulses transmitted per second. It should be noted that depending on the velocity
Pulse
Generator
Cos ω
0
t
Antenna
Antenna
v
z
Cos ω
0
t
Mixer
LPF
ADC
DSP/
Software
LNA
LO
PA
Magnified
Vessel
The Baseband Signal Processing Stage
delay
Moving object
under test
The RF Stage
of the object under test and the application, a minimum PRF should be met that depends on
the radar range and the speed of the radar waves (in this case, c, for electromagnetic waves).
To avoid ambiguity and increase the velocity measurement accuracy, sufficient observation
time is required, which is possible by choosing proper PRF (Skolnik, 1990).
3.3 Analysis
For simplicity and without loss of generalization, assume a monochrome continuous RF-
modulated signal, x(t), is chosen as the radar transmitting signal:
x(t)=A· Cos(ω
0
t)
(3)
The reflected signal captured at the receive side will include the transmitted signal provided
by the signal generator, with a frequency shift, ω
d
, that is proportional to the velocity of the
blood flow. The received signal will therefore include a term:
y(t)=A· Cos[(ω
0
+ ω
d
)t]
(4)
plus some noise terms, where,
c
v
d
0
2
(5)
where ω
0
is the mixer frequency, c is the speed of light, and v is the velocity of the moving
object under test; for example blood-flow velocity in arteries and veins, or the heart wall.
The frequency displacement resulting from the motion of the object under test can also be
modelled as a phase shift, Φ(t), that depends on the velocity: (Thijs et al., 2005; Thansandote
et al., 1983; Lohman et al., 2002)
)(
4
)(
2
)(
0
tsdvt
t
(6)
where λ is the wavelength and s(t) is the movement amplitude. Therefore, the vital signals
such as the movement of the Thorax can be sensed.
In the case of UWB radar, the transmitted signal would be the product of a narrow Gaussian
pulse by the mixer signal:
0
2
2
0
2
)(
exp).()(
n
p
nTt
tCostx
(7)
and the reflected, received signal will include the Doppler shifted component,
2
0
2
0
( )
( ) ( ) exp
2
p
d
n
t nT
y t Cos t
(8)
where ω
0
is angular frequency of UWB modulation signal, ω
d
is the Doppler shift frequency,
μ represents Gaussian envelope phase, σ represents the pulse width and T
p
is the pulse
repetition period (corresponding to the PRF). Here, the added noise components not taken
into account.
BiomedicalEngineering254
To extract the velocity of the object under test from the received signal, y(t) is
downconverted by Cos(ω
0
t), as (ignoring the mismatch errors)
2
0 0
2
0
( )
( ) (( ) ) ( ) exp
2
p
d
n
t nT
y t Cos t Cos t
(9)
That can be rewritten as:
0
2
2
0
2
)(
exp)())2(()(
n
p
dd
nTt
tCostCosty
(10)
Therefore, the high frequency component can be filtered and the remaining baseband term
that includes the shift data, i.e.,
2
2
0
( )
( ) ( ) exp
2
p
d
n
t nT
y t Cos t
(11)
is transferred to the following baseband signal processing stage.
3.4 The Baseband Stage
The baseband signal processing stage is the last stage in the Microwave Doppler radar-
based system. In this stage, the frequency shift data and therefore the velocity/motion rate
of the object under test is extracted from the signal received at the output of the lowpass
filtering stage. Depending on the application, the received signal is processed through
various digital signal processing (DSP) techniques. Usually, the received signal at the
baseband stage is first amplified and converted into digital by an analog-to-digital converter
stage (ADC) and then processed by further DSP techniques in the digital domain, where
more flexible, simpler, and potentially lower cost implementations are possible. DSP
techniques in the time-domain or frequency-domain such as fast Fourier transform (FFT),
autocorrelation and noise cancellation methods, as well as several digital filtering stages can
be used to increase coherency, attenuate the noise terms (such as echo), cancel motion
artefacts due to other movements in the body and surrounding objects, and extract the
target data.
The DSP techniques can be implemented in hardware (board-level or integrated), or in
software, using a PC (e.g. MatLab™ DSP toolbox), or both, depending on the application.
The DSP blocks can be implemented in hardware, on an FPGA, or on a DSP module,
depending on their complexity. Also, several DSP prototype development boards are
available by Texas Instruments Inc., and Altera Co. that can accommodate various
applications.
In order to select proper hardware for a specific application, requirements on the maximum
measurement frequency and resolution should be decided. Body signal such as blood flow
rate or heart rate are usually not high frequency and therefore the requirements are not
tight. However, some applications may require better resolutions. The Nyquist-rate
requirement for proper sampling by the ADC is specified as:
max
2 ff
s
(12)
where f
max
is the maximum measurement frequency and f
s
is the sampling frequency of the
ADC. Oversampling can help increase the signal-to-noise-ratio (SNR) and therefore the
resolution of the digitized signal (Northworthy et al., 1996). Note that these two parameters
are related as (Northworthy et al., 1996):
6.02 1.76
SNDR n dB
(13)
where n is the effective number of bits (ENOB) of an ADC, known as the resolution of the
ADC. As an example, in case of the heart signals measurements, a baseband signal of less
than 30 Hz is expected at the output of the RF stage, therefore a sample rate of 80-100Hz for
the ADC would be required.
4. The Developed R-SCG System and Measurement Results
The principal design of the radar-based R-SCG device is shown in the block diagram of Fig
9. The antenna mounted on the device is HFMD24 by Siemens and contains a transmitter
and a receiver in the same housing. The operating frequency is 2.45GHz. The transmitter
transmits continuous wave radio frequency energy towards subject body. The output signal
from the receiver is filtered and amplified, signal conditioning block. The cut-off frequencies
for the band-pass filter are 1Hz and 100Hz and the gain of the amplifier is around 800. After
filtering and amplifying, the R-SCG signal is sent to the A/D unit and then to the ATMEL
CPU for further processing. The CPU is connected to a thin-film transistor (TFT) display via
its SPI (Serial Peripheral Interface) port. The R-SCG device operates with two AA batteries
(2.45V) (Tavakolian et al, 2008a).
Considering that the R-SCG device has its own CPU and monitor, it can be used stand alone
to acquire and process the R-SCG signal. There is also another option of sending the data to
a personal computer for more advanced processing of the data using Matlab. To have this
option on our device, the digitized R-SCG signal is transformed to packets and sent through
UART to the USB and finally to the host personal computer for possible further processing.
Fig. 9. Block diagram of the R-SCG device
The R-SCG signal was acquired by the sensor, 10cm away from the subject chest. The data
acquisition involved the measurement of ECG and respiration signals too. RF signal with
the carrier frequency of 2.45 GHz was transmitted toward the subject’s chest and the
reflected signal was band-passed filtered between 0.5 to 25 Hz. The filtered signal was
differentiated and then band-pass filtered again between 4 Hz to 20 Hz. The comparison of
the processed R-SCG signal to the SCG signal recorded simultaneously from the sternum
can be seen in Fig. 4 together with the synchronized ECG signal.
Contact-lessAssessmentofIn-vivoBodySignalsUsingMicrowaveDopplerRadar 255
To extract the velocity of the object under test from the received signal, y(t) is
downconverted by Cos(ω
0
t), as (ignoring the mismatch errors)
2
0 0
2
0
( )
( ) (( ) ) ( ) exp
2
p
d
n
t nT
y t Cos t Cos t
(9)
That can be rewritten as:
0
2
2
0
2
)(
exp)())2(()(
n
p
dd
nTt
tCostCosty
(10)
Therefore, the high frequency component can be filtered and the remaining baseband term
that includes the shift data, i.e.,
2
2
0
( )
( ) ( ) exp
2
p
d
n
t nT
y t Cos t
(11)
is transferred to the following baseband signal processing stage.
3.4 The Baseband Stage
The baseband signal processing stage is the last stage in the Microwave Doppler radar-
based system. In this stage, the frequency shift data and therefore the velocity/motion rate
of the object under test is extracted from the signal received at the output of the lowpass
filtering stage. Depending on the application, the received signal is processed through
various digital signal processing (DSP) techniques. Usually, the received signal at the
baseband stage is first amplified and converted into digital by an analog-to-digital converter
stage (ADC) and then processed by further DSP techniques in the digital domain, where
more flexible, simpler, and potentially lower cost implementations are possible. DSP
techniques in the time-domain or frequency-domain such as fast Fourier transform (FFT),
autocorrelation and noise cancellation methods, as well as several digital filtering stages can
be used to increase coherency, attenuate the noise terms (such as echo), cancel motion
artefacts due to other movements in the body and surrounding objects, and extract the
target data.
The DSP techniques can be implemented in hardware (board-level or integrated), or in
software, using a PC (e.g. MatLab™ DSP toolbox), or both, depending on the application.
The DSP blocks can be implemented in hardware, on an FPGA, or on a DSP module,
depending on their complexity. Also, several DSP prototype development boards are
available by Texas Instruments Inc., and Altera Co. that can accommodate various
applications.
In order to select proper hardware for a specific application, requirements on the maximum
measurement frequency and resolution should be decided. Body signal such as blood flow
rate or heart rate are usually not high frequency and therefore the requirements are not
tight. However, some applications may require better resolutions. The Nyquist-rate
requirement for proper sampling by the ADC is specified as:
max
2 ff
s
(12)
where f
max
is the maximum measurement frequency and f
s
is the sampling frequency of the
ADC. Oversampling can help increase the signal-to-noise-ratio (SNR) and therefore the
resolution of the digitized signal (Northworthy et al., 1996). Note that these two parameters
are related as (Northworthy et al., 1996):
6.02 1.76
SNDR n dB
(13)
where n is the effective number of bits (ENOB) of an ADC, known as the resolution of the
ADC. As an example, in case of the heart signals measurements, a baseband signal of less
than 30 Hz is expected at the output of the RF stage, therefore a sample rate of 80-100Hz for
the ADC would be required.
4. The Developed R-SCG System and Measurement Results
The principal design of the radar-based R-SCG device is shown in the block diagram of Fig
9. The antenna mounted on the device is HFMD24 by Siemens and contains a transmitter
and a receiver in the same housing. The operating frequency is 2.45GHz. The transmitter
transmits continuous wave radio frequency energy towards subject body. The output signal
from the receiver is filtered and amplified, signal conditioning block. The cut-off frequencies
for the band-pass filter are 1Hz and 100Hz and the gain of the amplifier is around 800. After
filtering and amplifying, the R-SCG signal is sent to the A/D unit and then to the ATMEL
CPU for further processing. The CPU is connected to a thin-film transistor (TFT) display via
its SPI (Serial Peripheral Interface) port. The R-SCG device operates with two AA batteries
(2.45V) (Tavakolian et al, 2008a).
Considering that the R-SCG device has its own CPU and monitor, it can be used stand alone
to acquire and process the R-SCG signal. There is also another option of sending the data to
a personal computer for more advanced processing of the data using Matlab. To have this
option on our device, the digitized R-SCG signal is transformed to packets and sent through
UART to the USB and finally to the host personal computer for possible further processing.
Fig. 9. Block diagram of the R-SCG device
The R-SCG signal was acquired by the sensor, 10cm away from the subject chest. The data
acquisition involved the measurement of ECG and respiration signals too. RF signal with
the carrier frequency of 2.45 GHz was transmitted toward the subject’s chest and the
reflected signal was band-passed filtered between 0.5 to 25 Hz. The filtered signal was
differentiated and then band-pass filtered again between 4 Hz to 20 Hz. The comparison of
the processed R-SCG signal to the SCG signal recorded simultaneously from the sternum
can be seen in Fig. 4 together with the synchronized ECG signal.