báo cáo hóa học:" Quantitation of glucose uptake in tumors by dynamic FDG-PET has less glucose bias and lower variability when adjusted for partial saturation of glucose transport" potx
Bạn đang xem bản rút gọn của tài liệu. Xem và tải ngay bản đầy đủ của tài liệu tại đây (782.96 KB, 31 trang )
This Provisional PDF corresponds to the article as it appeared upon acceptance. Fully formatted
PDF and full text (HTML) versions will be made available soon.
Quantitation of glucose uptake in tumors by dynamic FDG-PET has less glucose
bias and lower variability when adjusted for partial saturation of glucose
transport
EJNMMI Research 2012, 2:6 doi:10.1186/2191-219X-2-6
Simon-Peter Williams ()
Judith E Flores-Mercado ()
Ruediger E Port ()
Thomas Bengtsson ()
ISSN 2191-219X
Article type Original research
Submission date 21 September 2011
Acceptance date 1 February 2012
Publication date 1 February 2012
Article URL />This peer-reviewed article was published immediately upon acceptance. It can be downloaded,
printed and distributed freely for any purposes (see copyright notice below).
Articles in EJNMMI Research are listed in PubMed and archived at PubMed Central.
For information about publishing your research in EJNMMI Research go to
/>For information about other SpringerOpen publications go to
EJNMMI Research
© 2012 Williams et al. ; licensee Springer.
This is an open access article distributed under the terms of the Creative Commons Attribution License ( />which permits unrestricted use, distribution, and reproduction in any medium, provided the original work is properly cited.
1
Quantitation of glucose uptake in tumors by dynamic FDG-PET has less glucose
bias and lower variability when adjusted for partial saturation of glucose transport
Simon-Peter Williams*
1
, Judith E Flores-Mercado
1
, Ruediger E Port
2
, and Thomas
Bengtsson*
3
1
Department of Biomedical Imaging, Genentech, Inc., South San Francisco, CA, 94080,
USA
2
Department
of Pharmacokinetics and Pharmacodynamics, Genentech, Inc., South San
Francisco, CA, 94080, USA
3
Department of Biostatistics, Genentech, Inc., South San Francisco, CA, 94080, USA
*Corresponding authors: ;
Email addresses:
S-PW:
JEF-M:
REP:
TB:
Abstract
Background: A retrospective analysis of estimates of tumor glucose uptake from 1,192
dynamic 2-deoxy-2-(
18
F)fluoro-D-glucose-positron-emission tomography [FDG-PET]
scans showed strong correlations between blood glucose and both the uptake rate
constant [K
i
] and the metabolic rate of glucose [MRGluc], hindering the interpretation of
PET scans acquired under conditions of altered blood glucose. We sought a method to
reduce this glucose bias without increasing the between-subject or test-retest variability
and did this by considering that tissue glucose transport is a saturable yet unsaturated
process best described as a nonlinear function of glucose levels.
Methods: Patlak-Gjedde analysis was used to compute K
i
from 30-min dynamic PET
scans in tumor-bearing mice. MRGluc was calculated by factoring in the blood glucose
level and a lumped constant equal to unity. Alternatively, we assumed that glucose
consumption is saturable according to Michaelis-Menten kinetics and estimated a
hypothetical maximum rate of glucose consumption [MRGluc
MAX
] by multiplying K
i
and
(K
M
+ [glucose]), where K
M
is a half-saturation Michaelis constant for glucose uptake.
Results were computed for 112 separate studies of 8 to 12 scans each; test-retest statistics
were measured in a suitable subset of 201 mice.
Results: A K
M
value of 130 mg/dL was determined from the data based on minimizing
the average correlation between blood glucose and the uptake metric. Using MRGluc
MAX
resulted in the following benefits compared to using MRGluc: (1) the median correlation
with blood glucose was practically zero, and yet (2) the test-retest coefficient of variation
[COV] was reduced by 13.4%, and (3) the between-animal COVs were reduced by15.5%.
2
In statistically equivalent terms, achieving the same reduction in between-animal COV
while using the traditional MRGluc would require a 40% increase in sample size.
Conclusions: MRGluc appeared to overcorrect tumor FDG data for changing glucose
levels. Applying partial saturation correction using MRGluc
MAX
offered reduced bias,
reduced variability, and potentially increased statistical power. We recommend further
investigation of MRGluc
MAX
in quantitative studies of tumor FDG uptake.
Keywords: variability; glucose correction; MRGluc
MAX
; blood glucose; partial saturation
correction; dynamic FDG-PET.
Background
We considered 2-deoxy-2-(
18
F)fluoro-D-glucose-positron-emission tomography [FDG-
PET] as a pharmacodynamic marker of antitumor activity during treatments that alter
systemic blood glucose levels, for example the Akt inhibitors [1], and sought a metric of
tumor glucose uptake that had minimal glucose bias. Inverse correlations of blood
glucose with tumor FDG uptake have been demonstrated in multiple settings (see Figures
1 and 2, [2-6]), and this effect was to be expected based on the biochemistry of glucose
(and tracer) transport and trapping [7].
We undertook a large series of tumor imaging studies in mice using the metabolic rate of
glucose [MRGluc] from Patlak analysis as our preferred estimate of the tumor glucose
uptake rate, expecting it to be relatively unbiased with respect to blood glucose. When we
undertook a retrospective review of 1,192 such scans performed in study groups of 8 to
12 mice, we observed that our MRGluc data were, in fact, strongly correlated with blood
glucose even though individual studies were often underpowered to convincingly show
this (see Figure 2B).
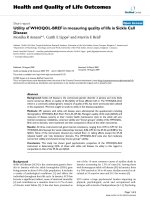
We presumed that this correlation caused additional variability in the uptake
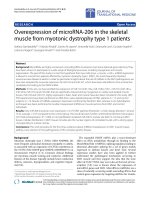
measurements. Even in the absence of any active treatment, blood glucose levels were
not entirely constant in our studies (see Figure 3), so we sought to apply a rational
glucose correction to the MRGluc data, noting that the bias reduction benefit must
outweigh the cost of the statistical noise introduced by the blood glucose measurements
[8].
The original formulations of quantitative glucose uptake measurements using radioactive
uptake assays were described comprehensively 35 years ago in the seminal work of
Sokoloff et al. [7]. The importance of glucose transport processes based on saturable
Michaelis-Menten kinetics has been demonstrated in biochemical studies of glucose
transporter 1 [GLUT-1], the dominant glucose transporter in tumors (and erythrocytes
and the blood-brain barrier), which have shown that glucose transport into cells can be
characterized as a saturable process with a half-maximal-rate Michaelis constant [K
M
] of
approximately 40 mg/dL [9]; it is the transport step that dominates the overall uptake and
trapping rate in many situations [10, 11]. Studies in intact animals suggested that the
3
apparent half-saturation constant, K
M
, for the GLUT-1-dominated blood-to-brain tissue
transport was approximately 5 [12] to 7.3 mM [13], equivalent to 100 to 130 mg/dL.
We reasoned that tissue glucose levels are often neither far below K
M
(where the glucose
transport rate would be approximately proportional to blood glucose level) nor far above
K
M
(where the glucose transport rate would be saturated and independent of blood
glucose level). Consequently, tissue glucose uptake rates are likely to show an
intermediate, nonlinear dependence on blood glucose levels.
We tested this hypothesis using a form of the MRGluc calculation that employs the
Michaelis-Menten relationship to compute the hypothetical maximal uptake rate
[MRGluc
MAX
] based on an empirical half-saturation K
M
of 130 mg/dL (see ‘Results’
section). This approach should reflect the relatively constant glucose uptake capacity of
the tissue rather than the instantaneous uptake rate, more or less independent of variations
in blood glucose. We refer to this glucose correction method as partial saturation
correction.
In this paper, we review 112 separate tumor studies of 8 to 12 dynamic FDG scans each,
all analyzed with the Patlak-Gjedde simplified tracer kinetic modeling methods [14-17]
yielding the uptake rate constant [K
i
] (per second) and the MRGluc (in micromoles per
minute per 100 cm
3
). We compared the glucose bias, test-retest, and between-animal
variability of K
i
, MRGluc, and MRGluc
MAX
.
Materials and methods
Data enrollment
The data retrospectively analyzed here came from 11 different xenograft models of
human cancers that we have employed in recent projects. Each model is a unique
combination of a mouse strain and a tumor line. Included were (1) scans from mice
studied at baseline prior to any treatment and (2) any subsequent scans from mice
enrolled in control groups not receiving any drug substance. Table 1 describes the 585
mice and 1,192 scans that were included. The mice were studied as cohorts of 8 to 12
individuals. Each member of a cohort had the same gender, age, strain, and tumor type,
and they were raised and inoculated at the same time. The average tumor volume in a
cohort was 250 to 400 mm
3
at the beginning of an imaging experiment. A study is
defined here as the imaging of one cohort at one timepoint.
Imaging
All studies were conducted with the approval of Genentech's AALAC-accredited
institutional animal care and use committee. Briefly, animals were fasted overnight with
free access to water prior to PET imaging. Sevoflurane in air [18] was used to induce and
maintain anesthesia sufficient to restrain the animals while they were scanned prone on
the bed of an Inveon MM scanner (Siemens Preclinical Solutions, Knoxville, TN, USA).
PET scans lasted 30 min. X-ray CT scans provided attenuation correction. List mode data
were typically reconstructed into images with 128 × 128 in-plane voxels of 0.4 × 0.4 mm
4
and 0.8 mm through-plane voxel thickness using vendor-provided iterative OP-MAP
implementation with the beta hyperparameter set to 0.05 [19]. The resolution
(approximately 1.5 mm), sensitivity, and other performance characteristics of this scanner
have been described previously [20]. Body temperature was maintained at 37°C by warm
air flows under feedback control. When animals were re-scanned on the second or
subsequent days, they were imaged on the same scanner and at the same time of the day
as for their first scan. The mice received an FDG tracer dose of approximately 200 µCi
by infusion through a tail vein catheter.
Blood glucose measurements
At every scan, blood glucose measurements were taken twice: once approximately 5 min
before and once shortly after the scan approximately 35 min later. The glucose value used
in calculations is the mean of the pre- and post-scan measurements. Data were collected
with the commercially available Contour glucometer (Bayer Healthcare, Tarrytown, NY,
USA). Test-retest reproducibility measurements according to Equation 5 were conducted
using this instrument in 20 mice and showed a coefficient of variation of 3.7%.
Image analysis
Regions of interest [ROIs] were drawn using the image analysis software IRW from
Siemens. For any given tumor model, all scans for all animals were analyzed by a single
observer following a standard procedure: Tumor ROIs were defined as voxels exceeding
a threshold percentage of the maximal tumor signal measured in the last 10 min of the
scan; this excluded necrotic or otherwise hypointense regions from the analysis. Mean
signal values from the ROIs were used for analysis. Image-derived signal from an ROI in
the liver was used as an input function reference region in the Patlak analysis, a technique
described in mice by Green et al. [21]. This method is well suited to high-resolution
whole-body scans that minimize partial volume artifacts [20, 22], such as those used here.
Time-activity curves and Patlak plots
The Patlak and subsequent statistical analyses were performed with the statistical
programming language R [23]. For each tumor model described in Table 1, examples of
the time-activity curves and the resultant Patlak plots are presented in Additional file 1 to
11. K
i
was measured from Patlak plots of dynamic FDG-PET data [15, 16, 24]. The linear
portion of the plot (beginning approximately 5 min into the time-activity curves) was
used for fitting and visually verified: the correlation coefficient r
2
in each case was at
least 0.99.
Kinetic modeling and partial saturation correction
MRGluc was estimated as K
i
× [glucose] × LC, where LC is the lumped kinetic constant
(set to unity) and [glucose] is the blood glucose measurement. Some literature denotes
this form of MRGluc where LC = 1 as ‘MRFDG’ [25, 26]; we will use ‘MRGluc’ for its
semantic emphasis on glucose (rather than FDG or glutamate) uptake. Although the LC
scales the absolute value of the K
i
data, it is important to note that the choice of LC has
no bearing on the subsequent analysis of glucose correlation, between-animal coefficient
of variation [COV], or test-retest reproducibility.
5
MRGluc and its basic dependence on blood glucose levels were modeled according to
Equation 1, a form of the Michaelis-Menten relationship [27, 28]:
MAX
M
MRGluc [glucose]
MRGluc =
[glucose]
K +
. (1)
MRGluc
MAX
is the hypothetical maximal value of glucose uptake rate, approached
asymptotically as the glucose concentration increases to saturating levels. If it were
physically possible, the glucose uptake rate measured along the horizontal asymptote
would be expected to show zero correlation with the glucose concentration. The
curvature parameter K
M
is the Michaelis constant that represents the blood glucose
concentration at which the glucose uptake rate is half the maximal (glucose-saturated)
rate.
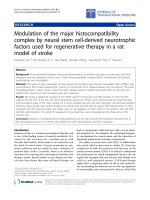
To see if our data plausibly followed the Michaelis-Menten model, we transformed the
measurements into the linear double-reciprocal form of Equation 2 and generated the
corresponding Lineweaver-Burk plots (some examples are shown in Figure 4):
M
MAX MAX
1 1 1
MRGluc MRGluc [glucose] MRGluc
K
= + . (2)
Computation of MRGluc
MAX
We divide both sides of Equation 1 by [glucose] and see that
MAX
i
M
1
MRGluc
[glucose]
K
K
=
+
. (3)
A further rearrangement allows the computation of MRGluc
MAX
for each individual
animal:
(
)
MAX
i M
MRGluc [glucose]
K K= + . (4)
All the data presented in this paper were computed using Equation 4, and group mean
data were calculated by sample averaging the results for individual animals within a
given study.
Estimation of K
M
by minimizing the correlation between blood glucose and
MRGluc
MAX
We computed estimates of MRGluc
MAX
with a range of K
M
values from 40 to 200 mM
and selected the K
M
that gave the smallest nonnegative value of the median Pearson's
correlation coefficient between MRGluc
MAX
and [glucose] across all 112 studies. As an
exploratory analysis, we also separately estimated K
M
for each of the 11 tumor models.
6
Variability and reproducibility
Between-animal variability was measured as the COV, calculated as standard error of the
estimate divided by the estimate, and expressed as a percentage. Test-retest
reproducibility statistics were calculated for 19 studies with the 201 mice that were
scanned at day 0 and again at day 3. This was the most common test-retest interval in our
data. The COVs were calculated using Equation 5, as described by Weber et al. [29]:
i
i (baseline) i (day 3)
0
study
i
i (baseline) i (day 3)
0
(Measurement Measurement )
COV
(Measurement + Measurement )
2
−
=
∑
∑
. (5)
Results
Both K
i
and MRGluc are correlated with blood glucose levels
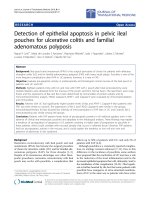
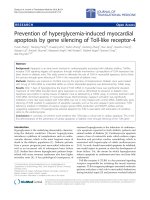
In some studies, correlations between blood glucose levels and the FDG-PET estimates
of glucose uptake rate were readily apparent. Two of these are illustrated in Figure 1:
panel A for K
i
and panel B for MRGluc. As expected, many individual cohorts of 8 to 12
mice were statistically underpowered to show such a relationship.
More important, and remarkable, was the consistent presence and strength of this
relationship between blood glucose and tissue uptake rates when seen in the meta-
analysis of our large sample of studies. Figure 2 illustrates this using a box plot of
Pearson's correlation coefficients between blood glucose and (A) K
i
, and (B) MRGluc for
all 1,192 scans from the 112 studies. The data are grouped into one box for each of the 11
tumor models, with the median for each box shown as a horizontal line. Data for each
tumor model comprised 4 to 30 studies; the open circles within a box show individual
studies for full disclosure.
Blood glucose levels were negatively correlated with K
i
in 90 studies (Figure 2A). The
median correlation coefficient (dashed line) was −0.4. With MRGluc as the metric of
tumor glucose uptake rate, 104 studies now showed a positive correlation with a median
correlation coefficient of 0.55 (Figure 2B), indicating that factoring in the glucose did not
eliminate the bias, but rather changed it from negative to positive.
In this meta-analysis of 112 studies, it is possible to compute for each tumor model
confidence interval around the correlation coefficients reported in Figure 2. The statistical
methodology and results are presented for the interested reader in Additional file 2.
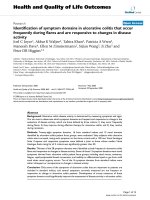
Lineweaver-Burk plots
A preliminary analysis of our data simply looked for positive correlations between
MRGluc and blood glucose levels in the double-reciprocal Lineweaver-Burk plots that
are characteristic of a Michaelis-Menten relationship [27, 28]. Thirteen of the first 20
tumor studies we examined had some correlation, judging by eye, encouraging further
7
consideration of the Michaelis-Menten model in our data. It was also apparent that the
data were inherently noisy such that individual studies were perhaps underpowered to
demonstrate a relationship. No quantitative inferences were drawn from these analyses,
however. Four such studies are shown in Figure 4.
When K
M
= 130 mg/dL, MRGluc
MAX
shows zero glucose bias, on average
Figure 2C shows the correlation between MRGluc
MAX
and blood glucose when K
M
= 130
mg/dL. At this value of K
M
, the median correlation coefficient for all 112 studies was
practically equal to zero, <0.0004 (dashed line in Figure 2C). Of the 112 studies, 55
showed a positive correlation, 55 showed a negative correlation, and 2 had practically
zero correlation (<0.003). Increasing values of K
M
beyond 130 mg/dL resulted in
progressively more negative median correlation coefficients.
Individual blood glucose often varies between scans
Blood glucose levels recorded at scan time for individual mice on multiple measurement
days are presented in Figure 3. Each box contains a different cohort of mice studied on
multiple days. Differences in group means and fluctuations over time are apparent despite
consistency of handling.
Between-animal variability
From Figure 5A, we observe that there was typically a reduction in the COV of
MRGluc
MAX
with respect to the COV of the same scans quantified using MRGluc. Most
of the points lie below the identity line; 87 of the 112 studies analyzed showed some
improvement. The average reduction in COV was measured as 15.5% from the value of
the fitted regression line slope of 0.845 shown as the dashed line in Figure 5A.
Our hypothesis was that we could reduce variability by extrapolating the tumor glucose
uptake rate measurement to a hypothetical asymptote where glucose is under saturating
conditions, and our data seem to support this. Mathematically, the improvement in COV
appears to come from the fact that MRGluc
MAX
is greater than MRGluc by definition.
Specifically, because K
M
= 130 mg/dL and the glucose measurements are near 100
mg/dL, we observe that, on the average, MRGluc
MAX
values approximately double those
of MRGluc. The standard error in MRGluc
MAX
is also greater than that in MRGluc, but
proportionately less so, and so we get an overall reduction in COV of 15.5%.
Power estimation and sample size calculation
An overall reduction in COV of 15.5% could translate (statistically equivalently) into
either a need for fewer subjects per study or into the ability to detect smaller effect sizes.
Generally speaking, the standard error of sample means (and of maximum likelihood
estimators in general) is inversely proportional to the square root of the sample size: this
implies that to achieve the same between-animal COV when using MRGluc would
require an increased sample size of 40% (i.e., 100 × 1 / (1 − 0.155)
2
) compared when
using MRGluc
MAX
.
8
Test-retest reproducibility
For the 19 studies examined, the median test-retest reproducibility COV results were
22.0% for K
i
, 23.1% for MRGluc, and 20.0% for MRGluc
MAX
. Figure 6 illustrates the
distribution of COV values for each of the three PET metrics.
Sensitivity analysis for the between-animal COV as a function of K
M
Varying the value of K
M
in the range of 40 to 200 mg/dL did not change the nature of the
results: MRGluc
MAX
gave lower between-animal variability than MRGluc. The reduction
in the average COV/K
M
correspondence was 10% (40 mg/dL), 15% (100 mg/dL), 15.5%
(130 mg/dL), and 16% (200 mg/dL).
Discussion
Correlations between blood glucose levels and MRGluc
Figure 2B shows that, in our setting with anesthetized mice, there is undoubtedly a strong
and persistent positive correlation between blood glucose and MRGluc across a variety of
tumor models and mouse strains. It is possible to calculate confidence intervals for the
correlation coefficients; these reinforce our conclusions since only one of eleven models
had a 95% confidence interval that included zero (−0.01 to 0.42). These calculations and
results are presented in Additional file 2 for the interested reader.
Use and applicability of MRGluc
Rigorous methods for estimating the MRGluc utilization were developed over 30 years
ago and continue to be successfully applied [7, 12, 26, 30, 31], not least in tumors [2, 4,
17, 32-36]. However, capturing the rate of glucose uptake in the instant of the scan leads
to MRGluc reflecting changes in blood glucose whether or not they are functionally
significant to the tissue. For malignant tumors, which are highly glucose-addicted,
glucose uptake capacity may well be a more important tissue characteristic to consider
than the glucose uptake rate. MRGluc
MAX
reduces glucose bias by emphasizing capacity
rather than rate.
Fundamental problem with nonlinear regression estimates of K
M
and MRGluc
MAX
It may be surprising to some readers that we do not employ a nonlinear regression model
to simultaneously estimate MRGluc
MAX
and K
M
from measurements of K
i
and [glucose].
Although considerable care must be taken, this approach is known to work [37-39] for
enzymatic data collected in vitro with minimal statistical noise in the measurements.
However, it proved to be impossible with our data from living subjects: the objective
function was difficult to optimize and subject to very large estimation errors.
Mathematically, this is due to maximum likelihood estimates of K
M
and MRGluc
MAX
being highly linearly codependent, and it requires a wide range of glucose values to
confidently distinguish the effects of changing K
M
and changing MRGluc
MAX
, at least
when faced with relatively noisy real-world K
i
measurements. This argument is presented
in Appendix 1 for the interested reader along with simulations.
9
Use of a fixed value of K
M
The use of an apparent K
M
value derived in separate experiments and used within a
physiologically reasonable range has the mathematical advantage that it reduces the
number of parameters we need to estimate from the scan data and thus avoids the use of
underpowered determinations made on a case-by-case basis. We used a large sample of
studies to determine the K
M
at which there was, on average, no net correlation between
MRGluc
MAX
and blood glucose levels (K
M
= 130 mg/dL). We regard this as an upper
limit; the lower limit might be set by studies on isolated cells where the measurement can
be made with full knowledge of the extracellular glucose concentration (K
M
= 40 mg/dL,
[9]).
A biological advantage is that we are better able to fix the K
M
as a constant property of a
certain tissue or tumor type under given conditions which are largely dictated by the
discrete nature of the molecular determinants, such as the isotype of the glucose
transporter, GLUT-1 versus GLUT-3, for example.
The importance of tissue glucose and blood glucose
Of particular importance should be how the (mechanistically relevant) tissue glucose
relates to the (conveniently measured) blood glucose levels [40]. Ideally, we should know
the interstitial glucose concentration in the tumor microenvironment, and while the
relationship between blood and tissue glucose is of intense interest and active study, it is
still not trivial to measure [41-43]. For normal tissues, interstitial glucose may be
modeled, but in tumors with all their heterogeneity and variability, this is likely to remain
challenging, and this will likely continue to present a significant source of variability in
data that depend on tissue glucose but measure blood glucose.
In some tumors, the glucose utilization is so great and the perfusion so poor that the true
tissue glucose may be close to zero [44], leaving tissue glucose transport far from being
saturated yet also decoupled from blood glucose levels. We have seen from our data is
possible, but not typical. More common are cases where the FDG uptake rate does
correlate with blood glucose levels, implying some degree of saturation and thus nonzero
tissue glucose levels.
Mathematical expectation of a correlation between K
i
× [glucose] and [glucose]
Here, we report an empirical correlation between glucose as it is commonly measured (in
the blood) and MRGluc as it is commonly defined and described in the literature (K
i
×
[glucose], based on blood glucose measurements). Although it is not widely remarked
upon in the literature, this correlation appears to be almost inevitable, a natural
consequence of the relationship between K
i
, MRGluc, and [glucose]. Given the widely
described result that tissue FDG uptake rates (K
i
) and FDG uptake levels (standardized
uptake value [SUV]) are affected by [glucose] [2-6, 45-48], truly incredible
circumstances must prevail to have zero correlation between MRGlu and [glucose] under
all circumstances. A more extensive mathematical analysis of this problem is presented
for the interested reader in the Appendix 2.
10
Applicability of K
M
values across multiple tumor types
Model-specific K
M
values might be expected to have some benefit and were tested as an
exploratory measure. They made it possible to bring the blood glucose correlation with
MRGluc
MAX
close to zero for each tumor model independently. However, there was no
additional improvement in the between-animal variability. Employing a global value of
130 mg/dL seemed adequate for these exploratory studies given that the benefits of using
MRGluc
MAX
are not critically dependent on using a precise value of K
M
.
Alternative linear regression method for estimation of MRGluc
MAX
with a fixed K
M
Having adopted the use of a fixed value for K
M
, we note that a least-squares linear
regression method to compute MRGluc
MAX
is readily apparent from Equation 3 by
plotting K
i
as a function of (1 / (K
M
+ [glucose]), giving a straight line with MRGluc
MAX
as the slope when the regression line is forced through the origin. Estimation of the group
mean by linear regression may perform better than averaging individual values (c.f.,
Section II.5 in the book by Christensen [49]). However, when we tested this alternative
calculation, we found that it made no appreciable difference to the results. We note that
linear regression should offer the greatest benefit where the data contain a wide spread of
glucose concentrations; as we noted above, this is not the case for our living-subject data
with its relatively narrow range of physiological blood glucose values and relatively high
noise level.
Variability and statistical power of MRGluc
MAX
compared to MRGluc
As noted, a 40% increase in sample size would be required to achieve a 15.5% reduction
in COV. However, translating a reduction in COV to improve statistical power requires
additional assumptions, e.g., regarding the potential treatment effect [50]. To make a
preliminary estimate, we assume that the relative treatment effect is the same for
MRGluc
MAX
and MRGluc when expressed as a percentage change from baseline (a
conservative assumption since MRGluc
MAX
is an asymptote). In this case, the reduction
in the required sample size while maintaining the same error rates (i.e., the same
statistical power) is 28.6% (equal to 100 × (1 − (1 − 0.155)
2
)) (see Equation 2 in van
Belle and Martin [50]). The actual sample size savings achieved in practice are likely to
be smaller than this because assumptions will not hold exactly. In particular, glucose
uptake is only approximated by Michaelis-Menten kinetics; K
M
is not known exactly; and
the error distribution may be neither Gaussian nor perfectly homoscedastic.
No doubt there are many sources of physiological noise contributing to the total observed
variability in K
i
[51], and blood glucose may be only a small part of that. Nevertheless, a
15.5% reduction in between-animal COV is not trivial and could well become important
over the course of many studies or in marginal cases. Also, this improvement should not
be considered in isolation, but seen as one step in the evolution of PET methodology over
the years.
Glucose normalization and bias
Although biologically appealing, mixed results have come from previous studies of linear
glucose normalizations applied to FDG-PET data [3-5]. Multiplying K
i
by blood glucose
(or normalized glucose, i.e., [glucose] / 100 mg/dL) did not eliminate bias in our data.
11
Some have found that this normalization actually increased variability and was unhelpful
[8, 52, 53], possibly because of the noise introduced by the glucose assay. However,
glucose bias was significantly reduced with the nonlinear MRGluc
MAX
function, while
simultaneously achieving reductions in between-animal and test-retest COVs compared
to both K
i
and MRGluc. This is very encouraging and warrants further investigation.
Other nonlinear glucose corrections
Given the significant biological noise that remains in FDG-PET data even after various
corrections are applied, other line equations that approximate the Michaelis-Menten
equation should fit the data and give broadly similar bias reductions and improvements in
glucose-derived variability. For example, Wong et al. have demonstrated that using a
square-root function of the glucose concentration allowed their clinical SUV data to
better classify indolent and aggressive lymphomas [54]. They also suggested, referring to
Langen et al. [2], that this correction would not be necessary with dynamic scans
quantified with MRGluc.
Applicability to SUV data
Our preliminary observations confirm that tumor SUV values correlate highly with our K
i
data, showing a negative correlation with blood glucose across hundreds of mice and
dozens of studies. However, our SUV values were derived from time-activity curves at
no more than 30 min after injection of FDG, and with only 5 min of acquisition time,
making them statistically noisy compared to purposeful SUV data. We expect that partial
saturation correction will have similar benefits with SUV data, but more appropriate
experimental data will be required before this can be properly explored. However,
applying the square root of glucose SUV correction of Wong et al. [54] to our tumor data
did reduce glucose bias and variability compared to MRGluc, almost as much as
MRGluc
MAX
. The converse should also be true, suggesting that multiplying SUV by (K
M
+ [glucose]) would be effective in the clinical lymphoma setting, while the mechanistic
foundation of this correction may make it possible to rationally optimize K
M
in different
tissues or tumor types.
Outliers and blood glucose changes during the scan
Individual outliers often exhibited large differences between their pre-scan and post-scan
blood glucose levels. We tested some exclusion criteria which censored out data from
scans where there had been a 75% or greater change in blood glucose level during the
course of the scan. This helped reduce the between-animal variability in some studies.
However, a more attractive alternative may be to track and account for the changes in
blood glucose occurring during a scan as proposed by Dunn et al. [55]. It would be
interesting to evaluate a combination of partial saturation correction and the method of
Dunn et al. [55] to better account for both between-scan and intra-scan blood glucose
changes.
Conclusions
Measured in a very large sample of 1,192 nonclinical dynamic FDG-PET scans, it was
clear that the rate of tumor glucose uptake estimated by MRGluc was, in most studies,
12
positively correlated with blood glucose levels. This gave an unwanted bias and
additional variability in our estimates of tumor glucose uptake rates.
By assuming a Michaelis-Menten relationship, the simple use of K
M
+ [glucose] in place
of [glucose] as the glucose correction factor had several benefits: the hypothetical
glucose-saturated MRGluc
MAX
was less correlated with blood glucose, had lower
between-animal variability, and had lower test-retest variability compared to MRGluc.
Future directions
This reduced bias and reduced variability may translate into a significant reduction in
sample size (up to 28%) for nonclinical treatment studies. Further performance
comparisons of MRGluc and MRGluc
MAX
applied to detect confirmed treatment
responses in our nonclinical tumor models have been completed and will be described
separately.
It will be very interesting, and straightforward, to see if these findings can be translated to
studies of clinical trial data where saturation-corrected SUV data could be calculated by
multiplying SUV by (100 mg/dL + [glucose]), rather than the more commonly reported
glucose-normalized SUV employing ([glucose] / 100 mg/dL). In the clinical trial setting,
even modest reductions in variability can translate to tangible savings in money, time,
and patient enrollment.
Competing interests
The authors declare that they have no competing interests.
Authors' contributions
S-PW designed the studies and wrote the manuscript, JEF-M programmed the data
analyses and prepared the figures, REP guided the discussion, and TB guided the data
analysis and statistics. All authors read and approved the final manuscript.
Appendices
Appendix 1
On the problem of linearly dependent ML estimates of
m
K
and
max
V
from noisy
Michaelis-Menten observations
If an adequate probabilistic framework can be specified for a sample data set, maximum
likelihood [ML] typically provides an efficient approach for parameter estimation.
Equivalently, for data which are conditionally Gaussian-distributed, one may also use
nonlinear least squares. However, due to the functional form of the Michaelis-Menten
[MM] relationship,
m
K
and
max
V
are not uniquely estimable (from each other) from noisy
MM observations. This problem is further exacerbated when the MM process is observed
in a narrow glucose range (as is the case in our work). The problem can be understood by
13
studying the information matrix for
m
K
and
max
V
, but we use a first-order expansion of
the ML score function to heuristically verify that the ML parameter estimates of
m
K
and
max
V
are strongly co-linear.
Let the true values of
m
K
and
max
V
be given by
o
K
and
o
V
, respectively. For
= 1, ,
j n
,
let
i o o
= / ( [ ] )
j j j
K V K glc
ε
+ +
be the
j
:th observed rate constant where
j
ε
is
independently sampled from a zero-mean Gaussian distribution with standard deviation
σ
. Let
(
)
2
2
max m i max m
( , , ) = / ( [ ] )
j j
j
S V K K V K glc
σ σ
−
− +
∑
be the ML score function to
be minimized. The ML estimates are given by
max m
max m max m
, ,
ˆ ˆ
ˆ
{ , , } = ( , , ).
min
V K
V K S V K
σ
σ σ
We note that estimation of
σ
does not affect estimates of
max
V
and
m
K
,
and its
consideration is henceforth eschewed.
For reasonably large sample sizes, at convergence, the ML estimates
max m
ˆ ˆ
,
V K
satisfy
2
max m o max o o o m o
ˆ ˆ ˆ ˆ
( , ) (( ) 2 / ( [ ] )[( ) / ( [ ] )( )]
j j j j
j
S V K K glc V V V K glc K K
ε ε
≈ − + − − + −
∑
2 2
o max o o o m o
ˆ ˆ
1/ ( [ ] ) [( ) / ( [ ] )( )] .
j j
K glc V V V K glc K K+ + − − + −
Taking expectations over the noise process,
j
ε
yields that on the average, the score is
minimized approximately when
max o o o m o
ˆ ˆ
( ) = / ( [ . ])( )
V V V K m glc K K
− + − , where
[ . ]
m glc
represents the mean glucose measurement. The result holds when the glucose
measurements have low spread but can be shown to hold approximately even as the
spread around
[ . ]
m glc
increases. Thus,
max
ˆ
V
is linear in
m
ˆ
K
with a slope equal to
o o
/ ( [ . ]).
V K m glc
+
To illustrate, we ran 400 simulations with the following parameters:
max o m o
= = 40, = = 100, = .025
V V K K
σ
, where glucose was randomly sampled from a
Gaussian distribution with the mean
[ . ] = 100
m glc and standard deviation of 20. Each
such simulation used a total of
= 20
n observations. These parameter settings were
chosen to simulate data which closely mimics the previously presented data. The R
function
()
nls
was used for ML estimation. Figure 7 shows pairs of estimates of
max
V
(i.e.,
max
ˆ
V
on the y-axis) and
m
K
(
m
ˆ
K
on the x-axis) from these 400 simulations. As can
be seen, the ML estimates are highly linearly dependent and have a slope of 0.2072, very
near to that derived by
o o
/ ( [ . ]) = .20
V K m glc+ . Further, the sample correlation in this
plot is
.995
, indicating that estimates are not uniquely identifiable from the data.
14
Although slightly improved, simulations verify that the above problem persists even as
the spread in
[ ]
glc
is greatly increased. Figure 8 sheds some intuition on the overall
problem. Along with the black MM curve used to generate 20 sample data points
(denoted by black 'x') are the MM curves for four other parameter settings (see figure
legend for parameter values). As is evident, the sample data cannot be expected to
'choose' efficiently among the depicted candidate models as increases in
m
K
are 'traded'
for increases (and vice versa) in
max
V
at the rate of .2. This estimation issue remains even
as the sample size is increased albeit with decreasing overall sample variability at a rate
of
1/ ( ).
sqrt n
Appendix 2
On the correlation between
MRgluc
and
[ ]
glc
As noted, several authors have described studies where the observed rates
i
K
were
negatively correlated with the glucose measurements
[ ]
glc
. We show that when such a
negative correlation exists, the correlation between
MRgluc
, defined as the product
between
i
K
and
[ ]
glc
, and
[ ]
glc
cannot uniformly equal zero. Indeed, lack of correlation
occurs but in a few special cases.
Since
i
> 0
K and
[ ] > 0
glc are negatively correlated, there exist constants
> 0
α
and
< 0
β
such that the form
i
[ ]
K glc
α β ε
≈ + +
describes the correlation between
i
K
and
[ ]
glc
. Here,
ε
is a zero-mean error process independent of
[ ]
glc
with variance
2
ε
σ
.
Then, with
k
g
µ
denoting the
k
:th raw moment of
[ ]
glc
and with
2
g
σ
its variance,
straightforward algebra shows that the covariance between
MRgluc
and
[ ]
glc
equals
2 3 2
( ,[ ]) = ( ).
g g g g
cov MRgluc glc
ασ β µ µ µ
+ −
Thus, for
( ,[ ]) = 0
cov MRgluc glc
,
we must have
2 3 2
= ( )
g g g g
ασ β µ µ µ
− − or
2 3 2
/ = ( ) / .
g g g g
α β µ µ µ σ
− This equality can clearly not hold uniformly across a broad
range of realistic parameter choices of
2 3
{ , , , , }
g g g
α β µ µ µ
.
We illustrate the result by simulations. Our setting assumes that
i
K
follows the MM form
with constants
m
K
and
max
V
and that the observed rate is corrupted by noise. That is,
i max m
= / ( [ ]) ,
K V K glc
ε
+ +
where
ε
is the random Gaussian with zero-mean and
standard deviation
σ
. As is common, we further assume that the rate constant is
observed (sampled) in a glucose range between 60 and 140. We note that when
i
K
is
observed in a limited range around some glucose midpoint
[ . ]
m glc
,
2 2
i max m max m max m
( / ( [ . ]) ([ . ] ) / ( [ . ]) ) / ( [ . ]) [ ]
K V K m glc m glc V K m glc V K m glc glc
ε
≈ + + + − + +
, i.e.,
i
K
is approximately linear in
[ ]
glc
.
15
The left panel in Figure 9 shows 400 simulated observations drawn from a MM model
with
max m
= 40, = 100, = .025
V K
σ
,
where glucose was randomly sampled from a
Gaussian distribution with a mean of 100 and a standard deviation of 15. As can be seen,
in the sampled range,
i
K
is approximately linear in
[ ]
glc
. The right panel shows a scatter
plot of
[ ]
glc
vs.
MRgluc
. Consistent with our derivations, the sample correlations in the
two plots are −.48 and .53, respectively. For the chosen parameter choices and glucose
distribution, based on the above arguments, the sample correlation between
[ ]
glc
and
MRgluc
should be near to its theoretically predicted value of .51. (For this data, the
sample correlation between
[ ]
glc
and
i m
= ( [ ])
MAX
MRgluc K K glc
+ is .01.)
Acknowledgments
The authors gratefully acknowledge the contributions of Annie Ogasawara, Alex
Vanderbilt, Jeff Tinianow, Herman Gill, Leanne McFarland, and Karissa Peth who
helped execute the imaging studies analyzed here.
References
1. Crouthamel MC, Kahana JA, Korenchuk S, Zhang SY, Sundaresan G, Eberwein DJ,
Brown KK, Kumar R: Mechanism and management of AKT inhibitor-induced
hyperglycemia. Clin Cancer Res: Official J Am Assoc Cancer Res 2009, 15:217-225.
2. Langen KJ, Braun U, Rota Kops E, Herzog H, Kuwert T, Nebeling B, Feinendegen
LE: The influence of plasma glucose levels on fluorine-18-fluorodeoxyglucose
uptake in bronchial carcinomas. J Nucl Med 1993, 34:355-359.
3. Lindholm P, Minn H, Leskinen-Kallio S, Bergman J, Ruotsalainen U, Joensuu H:
Influence of the blood glucose concentration on FDG uptake in cancer - a PET
study. J Nucl Med 1993, 34:1-6.
4. Huang SC: Anatomy of SUV. Standardized uptake value. Nucl Med Biol 2000,
27:643-646.
5. Keyes JW: SUV: standard uptake or silly useless value? J Nucl Med 1995, 36:1836-
1839.
6. Diederichs C, Staib L, Glatting G, Beger H, Reske S: FDG PET: elevated plasma
glucose reduces both uptake and detection rate of pancreatic malignancies. J Nucl
Med 1998, 39:1030-1033.
7. Sokoloff L, Reivich M, Kennedy C, Des Rosiers MH, Patlak CS, Pettigrew KD,
Sakurada O, Shinohara M: The [14C]deoxyglucose method for the measurement of
local cerebral glucose utilization: theory, procedure, and normal values in the
conscious and anesthetized albino rat. J Neurochem 1977, 28:897-916.
8. Hallett WA, Marsden PK, Cronin BF, O'Doherty MJ: Effect of corrections for blood
glucose and body size on [18F]FDG PET standardised uptake values in lung
cancer. Eur J Nucl Med 2001, 28:919-922.
9. Kasahara M, Hinkle PC: Reconstitution and purification of the D-glucose
transporter from human erythrocytes. J Biol Chem 1977, 252:7384-7390.
16
10. Rivenzon-Segal D, Rushkin E, Polak-Charcon S, Degani H: Glucose transporters
and transport kinetics in retinoic acid-differentiated T47D human breast cancer
cells. Am J Physiol Endocrinol Metab 2000, 279:E508-519.
11. Rodriguez-Enriquez S, Marin-Hernandez A, Gallardo-Perez JC, Moreno-Sanchez R:
Kinetics of transport and phosphorylation of glucose in cancer cells. J Cell
Physiol 2009, 221:552-559.
12. Van Zijl PC, Davis D, Eleff SM, Moonen CT, Parker RJ, Strong JM: Determination
of cerebral glucose transport and metabolic kinetics by dynamic MR
spectroscopy. Am J Physiol 1997, 273:E1216-1227.
13. Cornford EM, Young D, Paxton JW, Hyman S, Farrell CL, Elliott RB: Blood-brain
glucose transfer in the mouse. Neurochem Res 1993, 18:591-597.
14. Lammertsma AA, Hoekstra CJ, Giaccone G, Hoekstra OS: How should we analyse
FDG PET studies for monitoring tumour response? Eur J Nucl Med Mol Imaging
2006, 33:16-21.
15. Patlak CS, Blasberg RG, Fenstermacher JD: Graphical evaluation of blood-to-
brain transfer constants from multiple-time uptake data. J Cerebral Blood Flow
Metab 1983, 3:1-7.
16. Patlak CS, Blasberg RG: Graphical evaluation of blood-to-brain transfer
constants from multiple-time uptake data. Generalizations. J Cereb Blood Flow
Metab 1985, 5:584-590.
17. Cheebsumon P, Velasquez LM, Hoekstra CJ, Hayes W, Kloet RW, Hoetjes NJ, Smit
EF, Hoekstra OS, Lammertsma AA, Boellaard R: Measuring response to therapy
using FDG PET: semi-quantitative and full kinetic analysis. Eur J Nucl Med Mol
Imaging 2011, 38:832-842.
18. Flores JE, Mcfarland LM, Vanderbilt A, Ogasawara AK, Williams S-P: The effects
of anesthetic agent and carrier gas on blood glucose and tissue uptake in mice
undergoing dynamic FDG-PET imaging: sevoflurane and isoflurane compared
in air and in oxygen. Mol Imaging Biol 2008, 10:192-200.
19. Li Q, Leahy R: Statistical modeling and reconstruction of randoms precorrected
PET data. IEEE Trans Med Imaging 2006, 25:1565-1572.
20. Bao Q, Newport D, Chen M, Stout DB, Chatziioannou AF: Performance evaluation
of the inveon dedicated PET preclinical tomograph based on the NEMA NU-4
standards. J Nucl Med 2009, 50:401-408.
21. Green L, Gambhir S, Srinivasan A, Banerjee P, Hoh C, Cherry S, Sharfstein S, Barrio
J, Herschman H, Phelps M: Noninvasive methods for quantitating blood time-
activity curves from mouse PET images obtained with fluorine-18-
fluorodeoxyglucose. J Nucl Med 1998, 39:729-734.
22. Meyer PT, Circiumaru V, Cardi CA, Thomas DH, Bal H, Acton PD: Simplified
quantification of small animal [18F]FDG PET studies using a standard arterial
input function. Eur J Nucl Med Mol Imaging 2006, 33:948-954.
23. R Development Core Team: R: A Language and Environment for Statistical
Computing. Vienna: R Foundation for Statistical Computing; 2011.
24. Logan J: Graphical analysis of PET data applied to reversible and irreversible
tracers. Nucl Med Biol 2000, 27:661-670.
25. Doot RK, Dunnwald LK, Schubert EK, Muzi M, Peterson LM, Kinahan PE, Kurland
BF, Mankoff DA: Dynamic and static approaches to quantifying 18F-FDG
17
uptake for measuring cancer response to therapy, including the effect of
granulocyte CSF. J Nucl Med 2007, 48:920-925.
26. Krohn KA, Mankoff DA, Muzi M, Link JM, Spence AM: True tracers: comparing
FDG with glucose and FLT with thymidine. Nucl Med Biol 2005, 32:663-671.
27. Cornish-Bowden A: Fundamentals of Enzyme Kinetics. London: Portland Press;
2004.
28. Michaelis L, Menten ML: Die kinetik der invertinwirkung. Biochemische
Zeitschrift 1913, 49:333-369.
29. Weber WA, Schwaiger M, Avril N: Quantitative assessment of tumor metabolism
using FDG-PET imaging. Nucl Med Biol 2000, 27:683-687.
30. Phelps ME, Huang SC, Hoffman EJ, Selin C, Sokoloff L, Kuhl DE: Tomographic
measurement of local cerebral glucose metabolic rate in humans with (F-18)2-
fluoro-2-deoxy-d-glucose: validation of method. Ann Neurol 1979, 6:371-388.
31. Phelps ME, Schelbert HR, Hoffman EJ, Huang SC, Kuhl DE: Positron tomography
of the heart. Prog Nucl Med 1980, 6:183-209.
32. de Geus-Oei L-F, Visser EP, Krabbe PFM, van Hoorn BA, Koenders EB, Willemsen
AT, Pruim J, Corstens FHM, Oyen WJG: Comparison of image-derived and
arterial input functions for estimating the rate of glucose metabolism in therapy-
monitoring 18F-FDG PET studies. J Nucl Med 2006, 47:945-949.
33. Eary JF, Conrad EU, Bruckner JD, Folpe A, Hunt KJ, Mankoff DA, Howlett AT:
Quantitative [F-18]fluorodeoxyglucose positron emission tomography in
pretreatment and grading of sarcoma. Clin Cancer Res 1998, 4:1215-1220.
34. Hawkins RA, Choi Y, Huang SC, Messa C, Hoh CK, Phelps ME: Quantitating
tumor glucose metabolism with FDG and PET. J Nucl Med 1992, 33:339-344.
35. Hunter GJ, Hamberg LM, Alpert NM, Choi NC, Fischman AJ: Simplified
measurement of deoxyglucose utilization rate. J Nucl Med 1996, 37:950-955.
36. Vriens D, De Geus-Oei LF, Van Laarhoven HWM, Van Der Heijden HFM, Krabbe
PFM, Visser EP, Oyen WJG: Comparison of two region of interest definition
methods for metabolic response evaluation with [18F]FDG-PET. Q J Nucl Med
Mol Imaging 2010, 54:677-688.
37. Dette H, Biedermann S: Robust and efficient designs for the Michaelis-Menten
model. J Am Stat Assoc 2003, 98:679-686.
38. Raaijmakers JGW: Statistical analysis of the Michaelis-Menten equation.
Biometrics 1987, 43:793-803.
39. Ruppert D, Cressie N, Carroll RJ: A transformation weighting model for
estimating Michaelis-Menten parameters. Biometrics 1989, 45:637-656.
40. Burrows RC, Freeman SD, Charlop AW, Wiseman RW, Adamsen TC, Krohn KA,
Spence AM: [18F]-2-fluoro-2-deoxyglucose transport kinetics as a function of
extracellular glucose concentration in malignant glioma, fibroblast and
macrophage cells in vitro. Nucl Med Biol 2004, 31:1-9.
41. Aussedat B, Dupire-Angel M, Gifford R, Klein JC, Wilson GS, Reach G: Interstitial
glucose concentration and glycemia: implications for continuous subcutaneous
glucose monitoring. Am J Physiol Endocrinol Metab 2000, 278:E716-728.
42. Thennadil SN, Rennert JL, Wenzel BJ, Hazen KH, Ruchti TL, Block MB:
Comparison of glucose concentration in interstitial fluid, and capillary and
18
venous blood during rapid changes in blood glucose levels. Diabetes Technol Ther
2002, 3:357-365.
43. Cengiz E, Tamborlane WV: A tale of two compartments: interstitial versus blood
glucose monitoring. Diabetes Technol Ther 2009, 11:S11-16.
44. Gullino PM, Clark SH, Grantham FH: The interstitial fluid of solid tumors. Cancer
Res 1964, 24:780-794.
45. Wahl R, Henry C, Ethier S: Serum glucose: effects on tumor and normal tissue
accumulation of 2-[F-18]-fluoro-2-deoxy-D-glucose in rodents with mammary
carcinoma. Radiology 1992, 183:643-647.
46. Torizuka T, Fisher S, Wahl R: Insulin-induced hypoglycemia decreases uptake of
2-[F-18]fluoro-2-deoxy-D-glucose into experimental mammary carcinoma.
Radiology 1997, 203:169-172.
47. Zhuang HM, Cortes-Blanco A, Pourdehnad M, Adam LE, Yamamoto AJ, Martinez-
Lazaro R, Lee JH, Loman JC, Rossman MD, Alavi A: Do high glucose levels have
differential effect on FDG uptake in inflammatory and malignant disorders?
Nucl Med Commun 2001, 22:1123-1128.
48. Gorenberg M, Hallett WA, O'Doherty MJ: Does diabetes affect [(18)F]FDG
standardised uptake values in lung cancer? Eur J Nucl Med Mol Imaging 2002,
29:1324-1327.
49. Christensen R: Plane Answers to Complex Questions: The Theory of Linear Models.
New York: Springer; 1987.
50. van Belle G, Martin DC: Sample size as a function of coefficient of variation and
ratio of means. Am Statistician 1993, 47:165-167.
51. Weber WA: Quantitative analysis of PET studies. Radiother Oncol 2010, 96:308-
310.
52. Dandekar M, Tseng J, Gambhir S: Reproducibility of 18F-FDG microPET studies
in mouse tumor xenografts. J Nucl Med 2007, 48:602-607.
53. Weber WA, Ziegler SI, Thodtmann R, Hanauske AR, Schwaiger M: Reproducibility
of metabolic measurements in malignant tumors using FDG PET. J Nucl Med
1999, 40:1771-1777.
54. Wong CY, Thie J, Parling-Lynch KJ, Zakalik D, Margolis JH, Gaskill M, Hill J, Qing
F, Fink-Bennett D, Nagle C: Glucose-normalized standardized uptake value from
(18)F-FDG PET in classifying lymphomas. J Nucl Med: Official Publ, Soc Nucl
Med 2005, 46:1659-1663.
55. Dunn JT, Anthony K, Amiel SA, Marsden PK: Correction for the effect of rising
plasma glucose levels on quantification of MR(glc) with FDG-PET. J Cereb Blood
Flow Metab 2009, 29:1059-1067.
Figure 1. Relationship between blood glucose concentrations and FDG-PET metrics
in two studies. (A) K
i
(red), the tracer uptake rate constant from Patlak analysis. (B)
MRGluc (blue), the product of K
i
and blood glucose. The lines represent the linear
regression fit to the data.
Figure 2. Pearson's correlation coefficients between blood glucose and K
i
(A),
MRGluc (B), and MRGluc
MAX
(C). The y-axis represents Pearson's correlation value
obtained in 112 studies (1,192 observations - see ‘Materials and methods’ section). The
19
x-axis indicates the 11 tumor models (see Table 1). Open circles represent correlation
coefficients of individual studies. Box plots show the 25th, 50th, and 75th percentiles of
correlation coefficient distributions for every animal model. The thick brown dashed lines
show the median for all data.
Figure 3. Individual mouse blood glucose levels (y-axis) on multiple scanning days
(x-axis). Mean scan-time glucose was calculated as the average of the pre-scan and post-
scan measurements. Each box corresponds to a different cohort of mice as noted.
Figure 4. Diagnostic double-reciprocal Lineweaver-Burk plots of MRGluc versus
blood glucose concentration for four different tumor models. Every point corresponds
to an individual mouse. The line represents the linear regression fit to the data.
Figure 5. COVs in 112 FDG studies of 8 to 12 scans. Each COV was calculated with
(MRGluc
MAX
) or without (MRGluc) partial saturation correction. For MRGluc
MAX
, a K
M
of 130 mg/dL was used. Each open circle represents the COV calculated for one study.
(A) Scatter plot of all 112 observations. The solid line represents the identity line. The
red dashed line below the identity line represents the linear regression fit to the data. (B)
Box plots showing the COV ratios grouped according to the 11 mouse models employed.
The red dashed horizontal line represents the median of all values.
Figure 6. Percentage test-retest COV. It was calculated according to Equation 5 for K
i
,
MRGluc, and MRGluc
MAX
in 19 studies encompassing 201 mice. Each study consists of
8 to 12 mice scanned at days 0 and 3.
Figure 7. Highly linearly dependent ML estimates of
m
ˆ
K
and
max
ˆ
V
from perfect
model simulations with
m max
{ = 100, = 40, = .025}
K V
σ
.
Figure 8. Plotted sample data can be expected to fit any of the five depicted MM
models.
Figure 9. Scatter plots of
[ ]
glc
vs.
i
K
(left) and
[ ]
glc
vs.
MRgluc
(right). The left
panel also shows the underlying MM process (dashed black line) from which the data
was sampled, along with theoretical (red solid) and fitted (black solid) regression lines.
20
Table 1. Data listed by mouse strains and tumor types
Model Tumor cell line/mouse strain
Tissue of
origin
Number of
mice
Number of
scans
A BT474MI in beige-scid nude Breast 44 76
B HCT116 in athymic nude Colon 124 339
C PC3 in athymic nude Prostate 48 116
D FaDu in C.B 17 scid Pharynx 20 50
E H292 in C.B 17 scid Lung 20 40
F H596 in huHGF transgenics Lung 46 81
G 537-MEL in athymic nude Skin 35 52
H A2058 in athymic nude Skin 144 236
I A375 in athymic nude Skin 40 75
J Colo205 in athymic nude Colon 24 58
K H2122 in athymic nude Lung 40 69
Total 585 1,192
Additional files
Additional file 1
Title: ROI data and corresponding Patlak plots from FDG-PET scans in each of the 11
tumor models A to K discussed in the text (see Table 1).
Description: In each plot, the data from one cohort (n = 14 to 36) of essentially identical
mice are superimposed. Left, in red: the liver-derived input function; center, in blue: the
tumor; right, in gray: the Patlak plot.
Additional file 2
Title: Confidence intervals for correlations between PET metrics and blood glucose.
Description: To obtain the 95% confidence limits for Pearson's correlation coefficient (r),
the Fisher transformation was applied to the sample correlation coefficients.
A
Glucose (mg/dL)
K
i
(1/min)
0.20
0.25
0.30
0.35
0.40
60 80 100 120 140
y = −0.002 x + 0.47
A2058 in nu/nu
0.20
0.25
0.30
0.35
0.40
y = −0.002 x + 0.44
HCT116 in nu/nu
B
Glucose (mg/dL)
MRGluc (µmol/100g/min)
20
25
30
60 80 100 120 140
y = 0.16 x + 10.71
A2058 in nu/nu
20
25
30
y = 0.07 x + 17.4
HCT116 in nu/nu
Figure 1
Glucose (mg/dL)
50
100
150
200
0 5 10 15 20
HCT116 in nu/nu
0 5 10 15 20
PC3 in nu/nu
0 5 10 15 20
PC3 in nu/nu
0 5 10 15 20
Colo205 in nu/nu
50
100
150
200
A2058 in nu/nu
HCT116 in nu/nu
BT474M1 in beige−scid nude
H596 in transgenic
50
100
150
200
A2058 in nu/nu
A375 in nu/nu
A2058 in nu/nu
A2058 in nu/nu
50
100
150
200
H292 in C.B−17 scid
BT474M1 in beige−scid nude
HCT116 in nu/nu
HCT116 in nu/nu
50
100
150
200
537−MEL in nu/nu
537−MEL in nu/nu
H2122 in nu/nu
FaDu in C.B−17 scid
Figure 3
1
Glucose
1
MRGluc
0.04
0.06
0.08
0.10
0.010 0.015 0.020
R
2
= 0.661
y=2.84x+0.021
537Mel in nu/nu
0.010 0.015 0.020
R
2
= 0.645
y=4.84x+0.01
BT474 in beige scid Nude
0.010 0.015 0.020
R
2
= 0.57
y=4.05x+0.007
Colo205 in nu/nu
0.010 0.015 0.020
R
2
= 0.363
y=7.16x+−0.009
H596 in transgenic
Figure 4