Aerospace Technologies Advancements Fig Part 15 pdf
Bạn đang xem bản rút gọn của tài liệu. Xem và tải ngay bản đầy đủ của tài liệu tại đây (620.66 KB, 24 trang )
MEMS Tunable Resonant Leaky-Mode Filters for Multispectral Imaging Applications
469
layered structures. Because of the plane-wave assumptions used, these codes run extremely
fast and are found to be highly reliable as verified by repeated comparisons with
experimental results. Additionally, coupled-wave field distributions, including resonant
leaky-mode amplitudes as illustrated in examples above, can be conveniently and efficiently
computed with RCWA and related methods.
Tunable Fabry-Perot filters — For context and to connect and contrast our methods with better
known technology, we address briefly the properties of MEMS-tunable Fabry-Perot (FP)
filters. Figure 7 shows the device details consisting of two quarter-wave Bragg stacks with 8
layers each surrounding a variable gap. Figure 8 shows the performance of the FP filter with
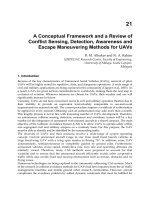
Fig. 7. A Fabry-Perot MEMS-tunable thin-film filter with variable gap operating in the in 8–
12 μm band.
8 8.5 9 9.5 10 10.5 11 11.5 12
0
0.1
0.2
0.3
0.4
0.5
0.6
0.7
0.8
0.9
1
λ
(
μ
m)
Transmittance
Fig. 8. FP filter transmission curve for example parameters that are θ = 0°, λ
0
= 10.0 µm,
d
H
= λ
0
/4n
H
= 0.731 µm, d
L
= λ
0
/4n
L
= 1.04 µm, and fixed air gap width of d = 5.0 µm.
Aerospace Technologies Advancements
470
representative parameters. Finally, Fig. 9 displays the tuning properties of the FP filter. Note
that for a given gap width, say d = 5 µm, two transmission peaks arise in the 8–12 µm
region. Thus, to eliminate extraneous transmissions, additional blocking (edge) filters are
needed. The net result is that tuning is restricted by the parasitic neighboring resonance
transmission channels as seen in the figure. In this example, spectral tuning across ~1 µm
with gap change of ~5 µm is possible with proper blocking filters. This is to be compared
with the tuning capability shown in Fig. 4 where a single resonance is encountered across a
wide spectral band. This yields resonance wavelength change of ~2.5 μm with a movement
of ~1.7 μm, which is considerably more effective.
Fig. 9. FP filter performance under tuning by varying the gap dimension, d. The red bands
define (d, λ) loci where the filter is highly transmissive.
4. Tunable membrane filter
In this section, a freestanding, tunable reflective pixel is introduced as a potential candidate
for multispectral imaging applications. The device has a membrane structure in which the
incident and substrate media are assumed to be air. The grating has four parts per period
like the structure in Fig. 1. Figure 10 shows the structure of this tunable element. For
simulating the action of the MEMS system for tuning the reflectance spectrum of the device,
the air part with filling factor of F
2
is considered as being variable. This imitates the
movement of the silicon part with filling factor F
3
by MEMS actuation as indicated in Fig. 10.
The tunable imaging pixel has been designed to operate in the 8–12 μm band. The
parameters of the device are as follows: Λ = 6.0 μm, d = 2.4 μm, F
1
= 0.15, F
3
= 0.1, and
n
H
= 3.42 (Si). Considering these parameters, Fig. 11 displays a color-coded map of R
0
(λ,F
2
)
illustrating the tuning of the resonance reflection spectrum. As seen in this figure, the pixel
is tunable over the 9–12.4 μm range while the mechanical displacement needed for this
tuning is ~0.373Λ = 2.24 μm. Therefore, the rate of tuning is ~1.52 (wavelength shift per
mechanical shift). Also, Fig. 12 shows example snapshots of the spectrum for various values
of F
2
. This figure quantifies the resonance peak line shape, line width, and side lobe levels
associated with this particular pixel.
MEMS Tunable Resonant Leaky-Mode Filters for Multispectral Imaging Applications
471
Fig. 10. Structure of a four-part GMR tunable membrane device. Λ, d are the period and
thickness of the grating, respectively.
Fig. 11. Color-coded map of R
0
(λ,F
2
) for the tunable MEMS pixel made with a silicon
membrane. The parameters of the device are as follows: Λ = 6.0 μm, d = 2.4 μm, F
1
= 0.15, F
3
= 0.1, and n
H
= 3.42 (Si).
To study the angular response of the tunable elements, the variation of the resonance peak
reflectance versus angle of incidence has been calculated and the result is shown in Figure
13. The center wavelength is 10.52 μm, and F
2
is chosen to be 0.1. It is seen that a favorable
Aerospace Technologies Advancements
472
numerical aperture is available for these devices. At ±2.5º angular deviation, the reflectance
of the resonance exceeds 0.9 and the FWHM of the spectrum is ~10º.
Since these elements work in reflection mode, practical arrangements are needed to suitably
direct the reflected beam to the detection system (for example, detector arrays). Figure 14
illustrates two possible schematic detection arrangements. In Fig. 14(a), a beamsplitter cube
is utilized to direct the reflected beam from the pixel element to the detector array. This
arrangement is useful if the element is designed to work under normal incidence conditions.
On the other hand, for pixel elements designed to work at oblique incidence, the
arrangement in Fig. 14(b) is more appropriate.
9 9.5 10 10.5 11 11.5 12
0
0.2
0.4
0.6
0.8
1
λ
(
μ
m)
R
0
F
2
= 0.05
F
2
= 0.1
F
2
= 0.15
F
2
= 0.2
Fig. 12. Snapshots of reflection spectra for various values of F
2
.
-30 -20 -10 0 10 20 30
0
0.1
0.2
0.3
0.4
0.5
0.6
0.7
0.8
0.9
1
Angle of incidence (Degree)
R
0
Fig. 13. Angular spectrum of the pixel element at λ = 10.52 μm and F
2
= 0.1.
MEMS Tunable Resonant Leaky-Mode Filters for Multispectral Imaging Applications
473
Fig. 14. Arrangements for reflected light detection from the tunable pixels under, (a) normal
incidence and (b) oblique incidence.
5. Conclusions
In this paper, MEMS-tunable leaky mode structures have been investigated for applications
in multispectral and hyperspectral imaging. It has been shown that high degrees of
tunability can be achieved without parasitic neighboring spectral channels. Numerous
computed examples of these devices have quantified their tunability relative to the
mechanical displacement as well as spectral bandwidths and associated sideband levels.
Particular example results for a silicon grating element with 6.0 μm period and 2.4 μm
thickness show MEMS tuning of ~3.4 μm in the ~9–12 μm band and ~100 nm spectral
resonance linewidth. We have previously studied analogous devices in the
telecommunications region around 1.55 μm wavelength (Magnusson & Ding, 2006) and in
the visible spectral region for use as display pixels (Magnusson & Shokooh-Saremi, 2007).
For resonance devices operating in the MWIR and LWIR bands, the structural features
increase in size relative to those in the short-wave regions, thereby relaxing fabrication
tolerances to some degree. Using photolithography and deep reactive-ion etching, these
filters can be fabricated in many common materials systems including silicon. Nevertheless,
the high aspect ratios encountered in some cases demand high precision in fabrication.
Aerospace Technologies Advancements
474
High aspect ratios are particularly associated with small filling factors in the basic resonance
gratings. Optimization in design to minimize aspect ratios while retaining high degrees of
tuning remains a chief challenge. Experimental realization and characterization of MEMS-
tuned LWIR multispectral elements is another interesting, future prospect.
6. References
Ding, Y. & Magnusson, R. (2004). Use of nondegenerate resonant leaky modes to fashion
diverse optical spectra. Opt. Express, Vol. 12, No. 9, (May 2004) pp. 1885-1891, ISSN
# 10944087
Ding, Y. & Magnusson, R. (2004). Resonant leaky-mode spectral-band engineering and
device applications. Opt. Express, Vol. 12, No. 23, (November 2004) pp. 5661-5674,
ISSN # 10944087
Gat, N. (April 2000). Imaging spectroscopy using tunable filters: A review, In: Wavelet
Applications VII, Harold H. Szu, Martin Vetterli, William J. Campbell, James R. Buss,
Eds., (Vol. 4056), pp. 50-64, SPIE, 0819436828, Bellingham, Wash
Gaylord, T. K. & Moharam, M. G. (1985). Analysis and applications of optical diffraction by
gratings. Proc. IEEE, Vol. 73, No. 5, (May 1985) pp. 894-937, 00189219
Janos Technology,
Magnusson, R. & Ding, Y. (2006). MEMS tunable resonant leaky mode filters. IEEE Photonics
Technol. Lett., Vol. 18, No. 13-16, (July 2006) pp. 1479-1481, 10411135
Magnusson, R. & Shokooh-Saremi, M. (2007). Widely tunable guided-mode resonance
nanoelectromechanical RGB pixels. Opt. Express, Vol. 15, No. 17, (August 2007) pp.
10903-10910, ISSN # 10944087
Magnusson, R. & Wang, S. S. (1993). Optical guided-mode resonance filter. U.S. patent
number 5,216,680, June 1, 1993
Nakagawa, W. & Fainman, Y. (2004). Tunable optical nanocavity based on modulation of
near-field coupling between subwavelength periodic nanostructures,” IEEE J.
Select. Topics Quantum Electron., Vol. 10, No. 3, (May/June 2004) pp. 478–483,
1077260X
Park, W. & Lee, J. B. (2004). Mechanically tunable photonic crystal structures. Appl. Phys.
Lett., Vol. 85, (November 2004) pp. 4845-4847, ISSN # 00036951
Peng, S. T.; Tamir, T. & Bertoni, H. L. (1975). Theory of periodic dielectric waveguides. IEEE
Trans. on Microwave Theory Tech., Vol. 23, No. 1, (January 1975) pp. 123-133,
00189480
Shokooh-Saremi, M. & Magnusson, R. (2007). Particle swarm optimization and its
application to the design of diffraction grating filters. Opt. Lett., Vol. 32, No. 8,
(April 2007) pp. 894-896, 01469592
Suh, W.; Yanik, M. F.; Solgaard, O. & Fan, S. (2003). Displacement-sensitive photonic crystal
structures based on guided resonances in photonic crystal slabs. Appl. Phys. Lett.,
Vol. 82, (March 2003) pp. 1999-2001, ISSN # 00036951
Vo-Dinh, T.; Stokes, D. L.; Wabuyele, M. B.; Martin, M. E.; Song, J. M.; Jagannathan, R.;
Michaud, E.; Lee, R. J. & Pan, X. (2004). A hyperspectral imaging system for in vivo
optical diagnostics. IEEE Engineering in Medicine and Biology Magazine, Vol. 23, No.
5, (September/October 2004) pp. 40-49, 07395175
Wang, S. S. & Magnusson, R. (1993). Theory and applications of guided-mode resonance
filters. Appl. Opt., Vol. 32, No. 14, (May 1993) pp. 2606-2613, 00036935
25
A Real Options Approach to Valuing the Risk
Transfer in a Multi-Year Procurement Contract
Scot A. Arnold and Marius S. Vassiliou
The Institute for Defense Analyses
The United States of America
1. Introduction
The purpose of this paper is to develop methods to estimate the option value inherent in a
multi-year government procurement (MYP), in comparison to a series of single-year
procurements (SYP). This value accrues to the contractor, primarily in the form of increased
revenue stability. In order to estimate the value, we apply real options techniques
1
.
The United States government normally procures weapons systems in single annual lots, or
single year procurements (SYP). These procurements are usually funded through a
Congressional Act (the annual National Defense Authorization Act or NDAA) one fiscal
year at a time. This gives Congress a great deal of flexibility towards balancing long and
short term demands. For defense contractors, however, the Government’s flexibility results
in unique difficulties forecasting future sales when demand is driven by both customer
needs and global politics.
Defense contractors face risks and advantages that set them apart from commercial
businesses. Within a contract, the contractor faces a range of execution cost risk: from none
in a cost plus fixed fee contract to high risk in a firm fixed price contract. The government
also provides interest-free financing that can greatly reduce the amount of capital a
contractor a contractor must raise through the capital markets. Additionally the government
provides direct investment and profit incentives to contractors to invest in fixed assets. The
net effect is that defense contractors can turn profit margins that may appear low when
compared to other commercial capital goods sectors, into relatively high return on invested
capital.
However, contractors have always faced high inter-contract uncertainty related to the short
term funding horizon of the government. While the United States Department of Defense
(DoD) has a multiyear business plan, in any given year, generating a budget entails delaying
acquisition plans to accommodate changing demands and new information. At the end of
the cold war, defense firms were allowed unprecedented freedom to consolidate. The
resulting industrial base is composed of five surviving government contractors: Boeing,
General Dynamics, Lockheed, Northrop Grumman, and Raytheon. By diversifying across a
large number of government customers, these giants with thousands of contracts each have
taken a giant step towards reducing inter-contract risk—no one contract is large enough to
1
E.g., Amram & Howe (2003)
Aerospace Technologies Advancements
476
seriously harm the companies if it were canceled for convenience. However, the uncertainty
around the likelihood of getting the next contract or how large it will be is still there and it is
particularly important for large acquisition programs. For example, while Lockheed is the
sole source for the F-22A, they always faced uncertainty in the number of units they will sell
in the future. For example both the F-22A and the B-2 were originally expected to sell many
more airplanes to the government than the actual number the government eventually
purchased.
Under Title 10 Subtitle A Part IV Chapter 137 § 2306b, the military services can enter into
multi-year procurement (MYP) contracts upon Congressional approval. There are six criteria
that must be satisfied, listed in Table 1. The chief benefit for the government has been the
“price break”, criterion 1, afforded through the operating efficiencies of a long term contract.
This benefit is readily passed to the government because it funds the necessary working
capital investments needed to optimize production. It is still possible for the government to
cancel the MYP contract; however, significant financial barriers such as a cancellation or
termination liability that make it undesirable to do so.
Criteria Descriptions
1 That the use of such a contract will result in substantial savings of the total
anticipated costs of carrying out the program through annual contracts.
2 That the minimum need for the property to be purchased is expected to remain
substantially unchanged during the contemplated contract period in terms of
production rate, procurement rate, and total quantities.
3 That there is a reasonable expectation that throughout the contemplated contract
period the head of the agency will request funding for the contract at the level
required to avoid contract cancellation.
4 That there is a stable design for the property to be acquired and that the technical
risks associated with such property are not excessive.
5 That the estimates of both the cost of the contract and the anticipated cost avoidance
through the use of a multiyear contract are realistic.
6 In the case of a purchase by the Department of Defense, that the use of such a contract
will promote the national security of the United States.
Table 1. The Six Criteria for a Multi-Year Procurement
2
The government reaps operational savings by negotiating a lower up-frontprocurement
price. These savings are achieved through more efficient production lot sizes and other
efficiencies afforded through better long-term planning not possible with SYP contracts. The
government can explicitly encourage additional savings by using a cost sharing contract. It
can implicitly encourage additional savings with a fixed price contract. In the latter case the
longer contract encourages the contractor to seek further efficiencies since it does not share
the savings with the government. In fact some might propose this last reason is the best
reason for a contractor to seek an MYP.
In addition to the cost savings achieved through more stable production planning horizon,
we see that the MYP provides the contractor with intrinsic value through the stabilization of
its medium term revenue outlook. Thus an MYP is also coveted by defense contractors
because it provides lower revenue risk. What about the possibility that a longer term firm
2
United States Code, Title 10, Subtitle A, Part IV, Chapter 137, Section 2306b
A Real Options Approach to Valuing the Risk Transfer in a Multi-Year Procurement Contract
477
fixed price contract exposes the contractor to higher cost risk? This risk is often eliminated
through economic pricing adjustment (EPA) clauses that provide a hedge against
unanticipated labor and material inflation. Furthermore, from the criteria in Table 1, MYP
contracts are only allowed for programs with stable designs that have low technical risk. As
stated above, it is more likely that the MYP offers the contractor the opportunity to exploit
the principle-agent information asymmetry and make further production innovations
unanticipated at contract signing
3
.
We believe that the lower risk MYP contract will allow investors to discount contractors’
cash flow with a lower cost of capital creating higher equity valuations. From the
contractors’ perspective, the MYP contract provides a hedge against revenue risk. We can
estimate the incremental value of the MYP versus the equivalent SYP sequence using option
pricing methods. Presently the government does not explicitly recognize this risk transfer in
its contracting profit policy. The government profit policy is to steadily increase the contract
margin as cost risk is transferred to the contractor. For example a cost plus fixed fee contract
might have a profit margin of 7% while a fixed price contract, where the contractor is fully
exposed to the cost-risk, of similar content could have a margin of 12%
4
. By limiting some of
the contractor’s cost-risk exposure, an EPA clause might result in a lower profit margin;
however, the profit policy makes no mention of an MYP contract, which reduces the
contractor’s inter-contract risk. And while most of the profit policy is oriented towards
compensating the contractor for exposing its capital to intra-contract risk and
entrepreneurial effort, there are provisions designed to provide some compensation for
exposing capital to inter-contract risk—e.g. the facilities capital markup. The implication is
that as long as the government does not explicitly price the reduction in cost-risk going from
a fixed price SYP contact to an MYP contract, the contractor is able to keep the “extra” profit.
In this paper we present a method to estimate the value an MYP creates for a defense
contractor in its improved revenue stability. The contractor can use this information in two
ways. First, the information provides guidance for how much pricing slack the contractor
can afford as it negotiates an MYP with the government whether or not the latter recognizes
that better revenue stability has discernable value. Second, if the government tries to reduce
the contractor’s price based on this transfer of risk, the contractor has a quantitative tool to
guide its negotiation with the government.
2. Financial structure and valuation of an MYP
In this paper, we will present how to estimate the value imbedded in the risk transfer from
the contractor to the government in an MYP contract using real options analysis. Table 2
lists recent MYP contracts. Note that while the table mostly shows aircraft the contract type
can be applied to other acquisitions. Since FY2000, MYP contracts have declined from about
18 percent of defense procurement to about 10 percent; however, over this period they have
totaled to about $10 billion per year. These contracts are 3 to 5 times larger than SYP
contracts and can represent an important portion of the contractor’s revenue.
3
Rogerson, W. P, The Journal of Economic Perspectives ,V. 8, No. 4, Autumn 1994, pp. 65-90
4
Generally the project with a cost plus contract has higher technical uncertainty than the
project with the fixed price contract. The government does not expect contractors to accept
high technical risk projects using a fixed price contract.
Aerospace Technologies Advancements
478
Program Period Amount ($ Billions) Type of System
Virginia Class
5
2009-2013 $ 14.0 Submarine
CH-47F
6
2008-2013 4.3 Aircraft
V-22
7
2007-2012 10.1 Aircraft
F-22A
5
2007-2010 8.7 Aircraft
F-18 E/F
5,7
2005-2009 8.8 Aircraft
DDG-51
8
2002-2005 5.0 Ship
AH-1 Apache
5,7
2001-2005 1.6 Aircraft
C-17A
5,9
1997-2003 14.4 Aircraft
Table 2. Recent Major Multi-Year Procurement Contracts
As an acquisition programmatures, the contractor implicitly receives an option on an MYP
that is not executable until authorized by the Congress and negotiated by the relevant
military service. If conditions are met and the option is exercised, the contractor transfers the
SYP revenue risk to the government, which commits to buying the predetermined number
of units. There are two financial instruments that approximate this transaction: a put and a
cash flow swap or exchange option. Both structures provide the protection buyer, i.e. the
contractor, insurance against losses in the underlying asset, i.e. the net present value of the
cash flow derived from the sales. For the duration of the MYP contract, the contractor
receives predictable revenue while the government forgoes the flexibility to defer or cancel
the procurement by agreeing to pay substantial cost penalties for canceling the MYP
contract. To value the MYP, we will employ the exchange option of Margrabe
10
. From this
analysis the government will be able to estimate the contractor’s value of transferring
revenue risk to the government as a function of the size of the contract and the volatility of
the contract’s value. Since the option is not actively traded, the ultimate negotiated price
could be heavily influenced by the government and contractor attitudes towards risk.
3. Real options
A put option is a common financial contract that gives the owner the right to sell an asset, such
as a company’s stock, for a pre-determined price on or before a predetermined date. Non-
financial contingent pay-offs that behave like financial options, but are not traded as separate
securities are called real options. Real options provide the holder of the asset similar risk
management flexibility though they are not yet sold separately from the underlying asset. For
example, oil drilling rights give the holder the option, but do not require, exploring, drilling, or
5
Internal publication from Northrop Grumman, “Navy Awards $14 Billion Contract for
Eight Virginia Class Submarines”, Currents, January 5-9, 2009
6
Graham Warwick, “Boeing Signs CH-47F Mulityear Deal”, Aviationweek.com, August 26,
2008
7
United States Government Accountability Office, Defense Acquisitions DoD’s Practices and
Processes for Multiyear Procurement Should be Improved, GAO-08-298, February, 2008, p. 9
8
U.S. Department of Defense Press Release, Office of the Assistant Secretary of Defense
(Public Affairs), No. 470-02, September 13, 2002.
9
Second of two multi-year contracts.
10
Margrabe, W., Journal of Finance, 33, 177-86 (1978)
A Real Options Approach to Valuing the Risk Transfer in a Multi-Year Procurement Contract
479
marketing the oil to customers. Patents are another example that can be viewed the same way:
the holder of the patent has the option but is not obliged to deploy the technology. Usually
these investment flexibilities come into play as contingent pay-offs: they allow the investor to
delay committing cash until positive pay-off is better assured. Real options capture the
capability of investors or managers to make valuable decisions in the future.
More generally, real options analysis captures some of the value of management’s capability
to make dynamic programmatic changes, based on new and better information, within the
levers and construct of a given business project. The real-options approach explicitly
captures the value of management’s ability to limit downside risk by stopping poorly
performing programs. It also captures the value inherent in the possibility that management
will exploit unexpected successes.
An MYP contract contains a real option allowing the contractor a choice to abandon the
uncertainty associated with relying on sequential SYP contracts to implement the
government’s acquisition strategy for a weapon system. For example an aircraft
manufacturer who is the single source for an air vehicle, such as the F-16 or F/A-18, has the
exclusive option to negotiate an MYP contract to sell the next four lots to the Air Force or
Navy. Given that most weapons acquisition programs buy fewer units than planned, the
contractor will exercise the option by entering into an MYP contract.
The contractor implicitly owns the MYP option as the sole source for the procurement.
Unlike a financial option which the buyer can choose from a selection of the strike prices
and tenors, an MYP option does not explicitly exist until the government and contractors
negotiate the terms of the contract. In negotiating the terms of the MYP, the contractor and
government are negotiating the option’s strike price—and up to that point it appears as
though the contractor received the option for free. Once negotiated it is usually executed
which is like exercising an at-the-money put option. We will define the option parameters
below, recognizing that they may not be explicitly defined until the option is exercised.
There are a number of techniques that may be used to value a real option. One way is to
adapt the framework developed by Black and Scholes
11
(BS) for financial options. Real-
options investments are not often framed as neatly as puts and calls on corporate equities
traded on the Chicago Board Options Exchange. However, if we can describe the real
options embedded in an MYP contract along the lines of the appropriate standard options
framework, we can try to employ the BS option pricing framework. Other alternatives
include the binomial method
12
, dynamic programming, simulation, and other numerical
methods to name a few.
4. Are real options really used by managers?
Real options have been a topic of vigorous academic research for decades. The published
literature abounds with theoretical papers, and with applications to a wide variety of
domains. These domains include, for example: the aerospace
13,14
, telecommunications
15
,
11
Black & Scholes (1973)
12
E.g., Copeland & Tufano (2004)
13
Richard L. Shockley, J. of Applied Corporate Finance, 19(2), Spring 2007
14
Scott Matthews, Vinay Datar, and Blake Johnson, J. of Applied Corporate Finance, 19 (2),
Spring 2007
15
Charnes et al. (2004)
Aerospace Technologies Advancements
480
oil
16
, mining
17
, electronics
18
, and biotechnology
19
industries; the valuation of new plants and
construction projects
20
; real estate
21
; the analysis of outsourcing
22
; patent valuation
23
; the
analysis of standards
24
; and the valuation of R&D and risky technology projects
25
.
There is some evidence that real-options thinking has permeated the real world in some
niches. The technique does appear to be used seriously in the oil industry, for example,
26
to
analyze new ventures. Perhaps one reason is that it is easier to track the value of the
underlying asset in that industry than in others. Reportedly, real options analysis has been
used at Genentech in all drug development projects since 1995, and Intel has used it to value
plant expansion
27
. Hewlett-Packard reportedly uses a set of risk management tools,
including real options analysis, in its procurement practices
28
. It is perhaps not surprising
that real options analysis has taken root in engineering and R&D-intensive industries
engaging in large and risky capital expenditures. The fact that many of these companies
have relatively high proportions of engineers and scientists in their management structures
may also be a contributing factor. There appears to be a perception that real options
analysis is inherently more “difficult” than other valuation methods, although this is not
necessarily the case
29
.
Real-options analysis is not as pervasive as conventional discounted cash flow analysis in
most corporate and government capital budgeting decisions. This alone does not invalidate
the analysis; it takes decades for analytical tools to take hold or to be changed. Financial
engineering has become entrenched in the financial services and consulting industries
30
. As
these tools evolve it will be natural to apply them to non-financial business problems.
Indeed the tools are not unique to the financial sector but were adapted from the
mathematical sciences. The relatively slow penetration of real-options analysis reflects the
difficulty for most organizations in articulating the risks faced in capital decisions.
The remainder of this paper will focus on explaining and applying options pricing methods
to valuing the portion of the MYP contract this is a risk management proposition.
5. Options theory
We will use closed form BS-type option pricing methods to estimate the contractor’s value
in an MYP contract. Financial options fit into the larger domain of derivatives or contingent
16
Cornelius et al. (2005)
17
Colwell et al. (2003)
18
Duan et al. (2003)
19
Ekelund (2005); Remer et al. (2001)
20
Ford et al (2004); Rothwell (2006)
21
Fourt (2004); Oppenheimer (2002)
22
Nembhard et al. (2003)
23
Laxman & Aggarwal (20030
24
Gaynor & Bradner (2001)
25
Paxson (2002); MacMillan et al. (2006)
26
Cornelius et al. (2005); IOMA (2001)
27
IOMA (2001)
28
Maumo (2005)
29
Amram & Howe (2003); Copeland & Tufano (2004)
30
Although with mixed results in structured finance and credit default swap applications.
A Real Options Approach to Valuing the Risk Transfer in a Multi-Year Procurement Contract
481
claims: financial instruments whose value derives from claims on pay-offs from event-
driven changes in the value of an underlying asset. There are two types of derivatives
buyers: hedgers who are naturally exposed to the underlying asset volatility and speculators
who seek exposure to this risk.
A simple example is an equipment manufacturer with occasional large foreign exchange
exposures when its machines are exported. The manufacturer could hedge the foreign
exchange risk by buying put options on the foreign currency he expects to receive upon the
sales transaction. The put option allows the manufacturer to exchange foreign currency for
dollars at a predetermined date and exchange rate and thus eliminates profit volatility. The
manufacturer is the hedger and the bank could be a speculator
31
.
Insurance is another example where the insurer (the speculator), sells coverage to insureds
(hedgers) for a premium. The insurer mitigates its position through many risk management
tools: setting up loss reserve accounts which are based on detailed loss histories; diligent
underwriting (i.e. pricing the coverage according to specific risks); avoiding certain risks (i.e.
correlated high exposure risks such as asbestos, floods, or mold damage); limiting correlated
risks (i.e. wind damage in Florida or earthquakes in California); hedging through
reinsurance; etc. The government is actually one of the largest insurers providing many
types of coverage against risks that many private insurers avoid: flood, nuclear; commercial
space launch, terrorism, aviation war and hijacking, etc.
Compared to most risks to which the government is exposed, absorbing a few years of SYP
volatility is a relatively tame risk transfer particularly in the context of the statutory
“underwriting” that must occur before Congress will authorize such a contract. In the MYP
contract, the defense contractor is the hedger, while the government is “speculating” that by
meeting the MYP criteria it should be able to benefit by accepting the contractor’s risk. The
MYP criteria in Table 1 are an effective underwriting tool for the government. By passing
the criteria, the government is actually absorbing little risk since by criteria 2 and 3 they
would have acquired all of the units even without the MYP.
It is important to note that not all hedges make good business sense. The rules as whether
or not to hedge are based entirely on the cost and benefits to shareholders who are free to
diversify some of the idiosyncratic risk away from their investment portfolio. The options
pricing models will not discern this trade-off for the contractors but it is likely to be the basis
for the contractor’s perspective in negotiating with the government. Regardless of the
contractors’ risk aversion, our goal is to elucidate the value created by the risk transfer. The
government is taking on new risk by entering into the MYP contract—this risk transfer
creates a significant benefit for the contractor counterparty whether or not they want to pay
for it.
6. MYP option analysis
A put option has the desired insurance-like structure of an MYP contract: with the
embedded risk transfer component of the MYP contract the contractor gains the right to sell
a fixed number of units at a pre-set price. However, the MYP, like many real options, does
not strictly eliminate the SYP risk; there is some risk that the government could cancel the
31
The bank may also hedge its foreign exchange exposure.
Aerospace Technologies Advancements
482
contract or change the number of units
32
. Thus an exchange option, which gives the holder
the right to exchange one cash flow for another on or before a given date, has advantages
over a put option since its cash flow corresponds more closely to the way an MYP would be
structured. The put and exchange options are closely related.
The key difference between the put and the exchange option is that on exercise, a put buyer
receives a certain cash settlement while with an exchange option the buyer obtains a “cash
flow” with different volatility. This property is ideal when in fact the MYP contract usually
has a flexibility clause for variations in quantity (VIQ).
Consider a put option for the sake of the simplicity of its properties. A put provides a payoff
to the option holder when it is exercised before the expiry and the exercise price is greater
than the market or spot price of the underlying asset. An option holder can buy the asset at
spot price S and sell it at the strike price X and receive a payoff X-S. Alternatively, an option
holder having a long position in an asset canhedge against losses with puts, much like an
insurance policy.
Fig. 1. Put Pay-off Diagram
Figure 1 depicts the payoff of a put option on or prior to the expiry. Once exercised, options
are zero-sum contracts: the writer “loses” and the holder gains or vice versa. If the option
expires unexercised, the holder’s only loss is the premium paid to the writer. If the put
option is held as a 1:1 hedge against a long position in the underlying stock, however, the
net pay-off is nil, ornegative once the option premium is included. In the same way a
contractor with an MYP contract is hedging against the uncertainty in the government’s
procurement decisions. The contractor net gain is neutral since the payoff depicted in Figure
1 is offset by the underlying losses in sales that would have happened if there were no MYP.
The MYP option pay-off is the protection against losses and the contractor will only observe
32
Canceling the contract usually would come with considerable cost to the government.
Put Option: right to sell
asset at X on or before
T
S=X
Asset Value (S)
Option value at some time t < T
Pa
y
of
f
A Real Options Approach to Valuing the Risk Transfer in a Multi-Year Procurement Contract
483
that it has stable, predictable cash flows. However, more predictable cash flows allow
investors to value the contractor’s equity higher. The government, on the other side, faces
the risk that it will be forced to manage future budget uncertainties by increasing taxes or
debt, cutting programs other than the MYP, or paying a higher termination fee if it cuts the
MYP.
7. Extending financial options to the MYP option
Ideally we would like to be able to use a formula, such as that of Black and Scholes, to
estimate the value of a MYP contract option. However, this is only reasonable if the
contingent pay-offs behave within the constraints and assumptions behind the BS model.
Though the basic BS formula applies to dividend protected European options in an arbitrage
free market, it could be applied to a real option if its value depends on: the underlying asset
value (S); the asset’s volatility (σ); and whether the option time frame resembles that of a
European option
33
.
The worth of the MYP contract option depends on the value of the underlying asset—i.e. the
net present value of future cash flow implied by the procurements. The uncertainty around
the size of these cash flows is also a key value driver: low risk SYP contracts have less risk to
be transferred to the government and lower the contractor’s need for an MYP. Later we will
discuss in more detail how to assess the volatility(the standard deviation of the market price
of an asset) of the value of a series SYP contracts. Unlike equity stocks, currencies, and other
traded securities, volatility in the case of a real option is difficult if not impossible to observe
so we need to find a suitable tracking asset. The option pricing models can still be used to
value the real option using the tracking asset’s volatility if there is sufficient correlation
between the tracking asset and the real option underlying asset valuation fluctuations.
The time frame of the MYP contract option is reasonably close to a European option, since it
can be exercised only when the contract is executed. Also inherent in the BS model is that
the return process of the underlying asset follows a Brownian motion process where the
returns have a lognormal distribution.
8. The Black-Scholes model
The value of the put option p on Company A’s stock at time t until expiration at time T can
be estimated using the BS model:
p(S,t) = Xe
− r(T-t)
N(-d
2
) - SN(-d
1
) (1)
S and X are A’s stock spot price at valuation and strike (at expiry T) per share respectively.
N(d
1
) and N(d
2
) are the cumulative normal distributions of d
1
and d
2
:
d
1
= (ln(S/X) + (r + σ
2
/2)(T-t))/ (σ (T-t)
1/2
)
d
2
= d
1
- σ (T-t)
1/2
33
European options can only be exercised on the expiration data while American options
can be exercised on or before expiry.
Aerospace Technologies Advancements
484
σ is the standard deviation or volatility of A’s stock price over the span of the option life
34
. r
is the interest rate of a risk-free bond with the tenor of the option expiry. Note that the thin
dotted curve in Figure 1 never goes below zero; an option has value until expiry even if it is
out of the money (i.e. for a put, S>X). This value is derived from the “time value” or
asymmetric opportunity value of the option which allows the holder the possibility that it
will come into the money prior to expiry without any risk of negative payoff.
The BS model assumes that the stock price changes are log-normally distributed, such that
over time, the logarithm of the price changes follows a Weiner process. With the use of Ito’s
theorem and several more assumptions, the put option price p, as a function of S, is
calculated using (1)
35
. In contrast to no-dividend European options assumed in (1) American
options can be exercised up to or on the expiry date greatly complicating the mathematics
behind their valuation. Most single equity options are American, while options on indices,
such as the S&P 500, are European.
Applying (1) to the MYP, S is the net present value (NPV) of the cash flow expected from a
series of SYP contracts; X is the price of the NPV of the MYP contract cash flows; and T is
last day the final lot could be changed under an SYP. σ would ideally be the volatility of the
NPV of the SYP cash flows, but since this volatility is virtually impossible to observe, it will
be estimated using the contractor’s stock as a tracking asset.
9. Exchange option
The exchange option allows the holder the right to swap cash flow x
2
(the risky SYP profit
stream) for cash flow x
1
(the less risky MYP profit stream). This option is more general and
better captures some of the flexibility the government has with actual MYP contract terms.
The BS-based formula to value an exchange option is:
w = e
− r(T-t)
x’
1
N(d
1
) − e
− r(T-t)
x’
2
N(d
2
) (2)
Again r is the risk-free rate, x’1 the strike price of asset 1 (MYP), x’2 the strike price of asset 2
(SYP), and N(d
1
) and N(d
2
) are the cumulative normal distributions of d
1
and d
2
:
d
1
= (ln(x
1
/x
2
)+(σ’
2
/2)(T-t))/ (σ’ (T-t)
1/2
)
d
2
= d
1
- σ’ (T-t)
1/2
σ’ = ( σ
1
2
+ σ
2
2
- 2 ρσ
1
σ
2
)
1/2
34
Technically it is the instantaneous volatility – something that is hard to measure.
35
p(S,t) is found by solving the following partial differential equation:
p
t
= ½ σ
2
S
2
p
SS
+ rSp
S
– rp
The equation is subject to the terminal condition: p=max[0,X-S], and to upper and lower
boundary conditions: p=Xe
-rT
for S=0 and p=0 for S→∞. S follows the Wiener process
through the following stochastic differential equation: dS = μSdt+σSdz. Here μ is the
average growth rate; σ is the standard deviation of this growth process; and r is the risk free
interest rate.
A Real Options Approach to Valuing the Risk Transfer in a Multi-Year Procurement Contract
485
Where σ
1
2
is the variance of x
1
, σ
2
2
is the variance of x
2
, and ρ is the correlation between x
1
and x
2
. Here ρ is likely to be close to 1 since x
1
and x
2
are essentially the same assets whose
risks are derived from the same source. In our base analysis, x
1
is assumed to be certain, i.e.
the MYP units are fixed in each lot and the government has no flexibility to cancel the MYP.
Thus σ’ = σ
2
since σ
1
= 0. If however, the MYP contract has some uncertainty, e.g. from a VIQ
clause or a low termination fee, σ
1
could be adjusted to reflect the relative risk between x
1
and x
2
.
The exchange option can also be thought of as a simultaneous call option on asset 1 with
strike price x
2
and a put option on asset 2 with a strike price x
1
. A call option is a contract
that gives the owner the right to buy an asset at a predetermined price on or before a
predetermined time. The main difference between the put and exchange options is that the
latter allows both assets to have price volatility. Furthermore the exchange option allows for
the upside volatility in the MYP, i.e. that more units than the original plan could be
purchased.
10. Estimating option pricing parameters
Consider as an example a major acquisition weapon system, “Program G,”, executed by the
contractor Company A. Program G and Company A do not correspond directly to any real-
life program or company, although the numbers discussed in this paper are constructed
from real examples. Program G’s base SYP net cash flows can be derived from the relevant
military service’s Selective Acquisition Report (SAR). Table 1 lists the profits associated with
Program G system lots 6 through 10
36
. Since lot 6 is the first year of both contract scenarios
its profits are omitted from the analysis since they will not depend on whether the MYP is
executed. The SYP uncertainty is only in lots 7 through 10. The profits are stated in “then
year” (nominal) terms and the net present value of the flows is discounted at Company A’s
cost of capital.
Lot 6 $ -
Lot 7 200
Lot 8 200
Lot 9 250
Lot 10 175
Total Profit $ 825
Present Value $ 630
Table 3. Contractor SYP Profit ($ Mils)
The present value total of $630 resents the projected total asset value (x
2
) of the last four lots
of the SYP. We initially restrict x
2
= x
1
, or that the option be “at the money”
37
.
36
We assume a dollar for dollar profit cash flow conversion.
37
This is a realistic assumption since the number of units in the MYP and SYP are assumed
to be the same in the standard business case analysis.
Aerospace Technologies Advancements
486
11. Volatility
For most non-traded assets, such as the profits of Program G, even the historical volatility is
difficult to measure
38
. To properly use the BS model to value Program G MYP option it is
imperative to find a traded tracking asset whose volatility is highly correlated to the implied
volatility of the asset underlying the embedded real option.
Fortunately, Company A’s equity is publicly traded. Company A is a moderately diversified
government contractor with two divisions, Defense and Non-Defense, that serve different
government sectors:. We find from their financial statements that Program G represents a
substantial share of the Defense Division’s earnings before interest and tax (EBIT). The EBIT
breakout by division is presented in Table 2. The Defense Division has contributed a
significant portion of the total profits, particularly in recent years. Comparing Tables 1 and 2
we can see that Program G represents over half of the Defense Division’s historical EBIT.
Year
Non-
Defense
Defense
Total Stock Price
EBIT
% Total
2001
$ 758 $ 242
24%
$ 1,000 $ 13
2002
564 92
14%
656 7
2003
522 128
20%
650 13
2004
652 123
16%
775 20
2005
679 167
20%
846 19
2006
552 257
32%
809 19
2007
443 335
43%
778 21
2008
742 370
33%
1,113 26
Table 2. A’s EBIT Breakdown by Division ($ Mils except for Stock Prices - $/Share)
Company A is a large enterprise, and while Program G contributes significant profits
towards to total corporate profit, it is not necessarily enough to drive the overall equity
performance. Before we can assign Company A’s equity volatility as a tracking asset for
Program G, we need to establish a closer linkage. Table 3 shows Company A’s earnings
growth and volatility by division as well as the market performance of its equity from 2000
to 2007. We see that the Defense Division tracks the overall stock performance better than
the Non-Defense Division, and better than the company as a whole. This may be because
Company A is often identified as a defense company and its stock price, which is forward
looking, trades on the trends in the overall defense industry.
Non-
Defense
Defense
Total Stock
Growth
0% 6% 2% 10%
Volatility (σ)
29% 36% 22% 37%
Table 3. A’s EBIT Growth and Volatility by Division 2001 to 2008
38
A crude estimate could be constructed by collecting the annual Selected Acquisition
Report estimates for the number of units funded through the life of the program.
A Real Options Approach to Valuing the Risk Transfer in a Multi-Year Procurement Contract
487
One more indication that Company A’s stock is a good tracking asset for Program G is the
correlation between the division’s EBIT and the stock price, as shown in Table 4. Defense
Division EBIT has a 72% correlation to the stock price—even higher than the company’s
total EBIT. Note that this is not to imply that the stock price drives Program G profit
volatility; but rather that the stock price mirrors the EBIT volatility of the Defense division
which is strongly driven by the program G business. Since we cannot measure Program G
EBIT volatility directly, we will use the stock price volatility as a proxy. We could use the
Defense division’s historical EBIT volatility (Table 3) to track Defense division volatility,
instead we prefer to use the forward-looking implied volatility estimated in Table 5.
ρ
Division,Stock Price
Non-
Defense
18%
Defense 72%
Total 59%
Table 4. Correlation between Stock Price and Division EBIT from 2001 to 2008
12. Time horizon
We have already hinted at the time horizon for the MYP option. It starts when congress
gives the services authority to enter into an MYP with A. It expires at the beginning of the
last year or lot of production (assuming one lot per fiscal year) since that would be the last
point at which the government could have reduced the number of units in an SYP contract.
Assume that the MYP authority is granted six months prior to negotiation. The total life of
the MYP is then five years and six months.
13. Interest rate
The risk free interest rate used in the analysis is the rate on a Treasury bill whose maturity
ties roughly to the expiry of the MYP option.
14. Option valuation
First we estimate the implied volatility of a Company A call option that expires close to the
MYP expiry. Unfortunately options beyond two years are rare, even for established
companies like A. Thus we use the Jan ’10 call option to estimate the implied volatility. The
parameters to estimate the implied volatility are listed in Table 6. S*, X*, T*, and c* are the
stock price, strike price, expiry, and option price for the A Jan ’10 $25 call. Using these
values in the BS call option formula we can calculate the implied asset volatility
39
. The asset
volatilities are then used in (2) to estimate the exchange option price for the MYP.
Table 6 summarizes the valuation of the MYP structured as an at-the-money exchange
option. Setting the strike value equal to the spot value gives an option value of $127 million
which the contractor would need to pay the government upon executing the MYP contract.
39
We use an algorithm based on the Newton-Raphson method to solve for the implied
volatility of a European option.
Aerospace Technologies Advancements
488
Much of this value is in the time to expiration or “time premium”. Just to illustrate, if the
option were for one month it would be worth $20 million and worth $4 million if it was for
one day—all else equal.
Risk Free Rate (r)
4.73%
Stock Price (S*)
$ 26.15
Exercise Price (X*)
$ 25.00
Expiry (years) (T*)
1 2/3
Option Price (c*)
$ 5.40
Asset Volatility
29%
Table 5. BS Parameters for A ($/Share)
($ Millions)
Present Value SYP (x
2
)
$ 630
Strike Value (x
1
)
630
Real Option Price
$ 127
Expiry (yr)
5.0
Table 6. MYP Evaluated as an Exchange Option – Risk on SYP Cash Flow Only
The analogy between MYP and insurance is a good one because, as anyone who has made a
claim might have discovered, the insurance pay-off is not certain. The MYP can have a
variation-in-quantity clause that allows the government to reduce the number of units by a
pre-determined number. For example, if the EPA clause is activated by unanticipated labor
and materials inflation, the government might reduce the quantity purchased to maintain its
bottom line budget. Thus there is some uncertainty around the MYP that must be
considered in our risk transfer pricing. This is where the exchange option framework has an
advantage over the plain put option structure. It can be used to value cash flow trades that
have different levels of uncertainty. For the valuation in Table 6 we set σ’ = σ
1
and σ
2
= 0.
Assume now the government and the contractor agree that the former could reduce the
number of Program G units by 2 each year or 10% of the number of units in each lot. We use
the exchange option structure to value the right to swap the SYP cash flow with volatility σ
1
for the MYP volatility of volatility σ
2
–see Table 7 for the valuation.
$ Millions
Present Value SYP (x
2
)
$ 630
Strike Value (x
1
)
$ 630
Real Option Price
$ 112
Combined Volatility (σ)
26%
SYP Volatility (σ
2
)
29%
MYP Volatility (σ
1
)
10%
SYP / MYP Volatility Correlation (ρ)
50%
Table 7. MYP Evaluated as an Exchange Option with Risk on Both Cash Flows
The price of the option falls from $127 million to $112 million. It would drop to $84 million
with 100% correlation; however, if there were no correlation between the two cash flows, the
A Real Options Approach to Valuing the Risk Transfer in a Multi-Year Procurement Contract
489
price would have increased to $134 million. This is due to the upside potential of the MYP
and SYP. The exchange option is essentially a put option with a stochastic strike price which
allows the protection buyer to capture more payoff if the MYP turns out to yield more units.
This assumes that the risk of the MYP is symmetric. There is no reason to believe otherwise,
since the government can always buy more units than planned, if they are needed.
15. Other real options embedded in an MYP
Within this chapter, we only have the scope to focus on a single real option example within
the MYP contract. However, there is at least one other real option available to the contractor
with a sole source production franchise such as a major aircraft, missile, ship, etc. This is
because defense contracts are incomplete leaving the contractor with residual control of cost
reduction innovations. While we will not estimate the value of this real option here, we
mention it because in some cases it is potentially worth far more than the revenue
stabilization discussed here.
Regulatory lag is an incentive concept that emerged from explicitly regulated industries
such as utilities. These industries’ profits are regulated directly through rate setting, e.g.
$/kWhr, or through rate of return settings by a regulatory authority. Between rate settings,
the utility is free to innovate and achieve higher profits. Upon the next regulatory oversight
review, the regulator discovers the new cost structure and adjusts the new rate accordingly
to a lower profit level-presumably slightly above the weighted average cost of capital for the
utility. Longer periods between regulatory oversight periods (i.e. higher regulatory lag),
mean greater opportunities for higher profits.
Similarly, a defense contractor with a sole source series of production contracts for a weapon
system has the incentive to achieve greater than expected efficiency innovations even if the
savings are passed on to the government in subsequent contracts. It turns out that there is a
substantial regulatory lag in defense contracts due to the length of time it takes for cost
reports to be submitted to the government. The regulatory lag increases substantially in a
MYP contract.
These innovations are real options since the contractor is not obligated to make the
necessary investment to achieve the cost savings. They can use real options valuation tool to
estimate the worth of these options before a program is executed by looking at prior history
of achieving cost reduction innovations as well as a forward looking assessment of the
opportunities in a specific weapon system. Unlike the revenue stabilization option, there is
considerable information asymmetry between the government and contractor with the
regulatory lag options. However, the government could look at prior programs and assess
the degree of regulatory lag driven innovation that occurred in past programs and roughly
estimate the value of this type of incentive on a new program. This valuation can provide
important insight into how aggressively contractors will compete to win a large sole source
program.
16. Conclusion: the cost implications of the MYP option
Options pricing analysis offers a way to systematically estimate value from the MYP
contract earned by the Government for which they have not previously been explicitly
compensated. This incremental value is the revenue risk transferred to the Government
from the contractor upon signing an MYP. The MYP does not eliminate the revenue risk for
Aerospace Technologies Advancements
490
the contractor associated with SYP contracts; rather it transfers it to the government and it
becomes budget risk. The Congress clearly values its budget flexibility, as evidenced by the
statutory criteria to judge the worth of an MYP proposal.
MYP cost savings are usually through operational efficiencies earned through process and
purchasing improvements funded by the Government’s “economic order quantity” advance
funding. The transfer of revenue risk to the Government is a cash flow hedge that provides
real value to the contractor just as any financial hedge does for currency, commodity, or
interest rate risks or property and casualty insurance does for operational risks. Lockheed
and Raytheon, for example, carry interest rate swaps that hedge interest rate risk for
notional $1 billion and $600 million respectively
40,41
. General Dynamics reported a currency
swap to hedge a Canadian denominated loan with a fair value of $42 million
42
. It also
reported embedded options in the terms of its long term labor and commodity contracts.
One can argue that just as public companies are expected to incur expenses as they pay for
insurance and financial hedges, they should pay the government when it reduces the
contractor’s risk.
The option methodology helps the government objectively quantify some of the cost in
relinquishing its budget flexibility with a relatively simple tool that has widespread use in
the financial community. We do not try to value the cost of transferring the risk from the
Government’s side because there is not a readily available tracking asset to estimate the
volatility of the revenue risk. It is possible to estimate the actuarial loss history of certain
procurements by looking at the Selected Acquisition Report over the span of past programs.
If such data were available, it might be desirable to use it in lieu of the equity volatility of
the contractor. One benefit of using the contractor’s volatility, however, is that it is more
closely coupled to the risk the contractor might be willing to hedge.
The option value of the MYP has not been explicitly paid to the government in the past.
Thus any method that helps rationalize the cost of this risk transfer is a benefit to the
government. Furthermore, the contractor will likely see the value of the MYP option if it is
evaluated in its own financial terms.
Strategically, the MYP option value represents a significant reduction in the contractor’s
profits. Given the skill and sophistication that contractors employ to manage their
government customers, they will likely argue that the MYP real option has limited value as
an earnings hedge. They could contend that financial hedges are only appropriate for risks
that are outside of managers’ control, such as interest and exchange rates, and cannot be
offset within the business. They might also contend that not only is their portfolio of
business well diversified among a broad scope of government elements but that they have
enough support on Capitol Hill to ensure that they will sell all the units in the SYP plan.
They would be arguing that the program is less risky than their business in total (i.e. their
equity volatility). This would be a difficult argument for most businesses. However, initially
it is unlikely the contractors will proactively volunteer to pay for it.
40
Lockheed Martin Corporation, Securities and Exchange Commission Form 10-K,
Commission file number 1-11437, Fiscal Year December 31, 2006, p.71.
41
Raytheon Company, Securities and Exchange Commission Form 10-K, Commission file
number 1-13699, Fiscal Year December 31, 2006, p. 74.
42
General Dynamics Corporation, Securities and Exchange Commission Form 10-K,
Commission file number 1-13671, Fiscal Year December 31, 2006, p. 49.
A Real Options Approach to Valuing the Risk Transfer in a Multi-Year Procurement Contract
491
However, the fact is that the lower earnings risk from an MYP has tangible value whether or
not the contractors wish to pay for it. The option has the same value no matter what the
contractors’ risk preference. If there is no risk hedge in an MYP, why do the contractors
routinely enter into this type of contract? In fact Lockheed readily acknowledged that the
value of the MYP is its long term stability
43
.
The options methodology allows the Government to build a logical business case for
reducing the profit on cost paid to contractors when switching from an SYP series to an
MYP contract. The exchange option model in particular allows the Government to quickly
estimate changes in the value of the contract as the details, e.g. the EPA and VIQ clauses,
become more complete.
17. References
Amram, M., and K. N. Howe (2003), “Real Options Valuations: Taking Out the Rocket
Science,” Strategic Finance, Feb. 2003, 10-13.
Baldi, F. (2005), “Valuing a Leveraged Buyout: Expansion of the Adjusted Present Value by
Means of Real Options Analysis,” J. Private Equity, Fall 2005, 64-81.
Barnett, M. L. (2005), “Paying Attention to Real Options,” R&D Management 35, 61-72.
Black, F. and M. Scholes (1973), “The Pricing of Options and Corporate Liabilities,” J.
Political Economy 81, 637-654.
Charnes, J. M., and B. R. Cobb (2004), “Telecommunications Network Evolution Decisions:
Using Crystal Ball and Optiquest for Real Options Valuation,” Proc. 2004 Crystal
Ball User Conference.
Colwell, D., T. Henker, J. Ho, and K. Fong (2003), “Real Options Valuation of Australian
Gold Mines and Mining Companies,” J. Alternative Investments, Summer 2003, 23-
38.
Copeland, T., and K. M. Howe (2002), “Real Options and Strategic Decisions,” Strategic
Finance, April 2002, 8-11.
Copeland, T., and P. Tufano (2004), “A Real-World Way to Manage Real Options,” Harvard
Business Review, March 2004, 90-99.
Cornelius, P., A. Van de Putte, and M. Romani (2005), “Three Decades of Scenario Planning
at Shell,” California Management Review 48, 92-109.
Duan, C. W., W. T. Lin, and C. F. Lee (2003), “Sequential Capital Budgeting as Real Options:
The Case of a New DRAM Chipmaker in Taiwan,” Rev. Pacific Basin Financial
Markets and Policies, 6, 1, 87-112.
Ekelund, A. (2005), “Valuating Biotech Project Portfolios Using Crystal Ball and Real
Options-Case: Natimmune,” Proc. 2005 Crystal Ball User Conference.
Ford, D. N., D. M. Lander, and J. Voyer (2002), “A Real Options Approach to Valuing
Strategic Flexibility in Uncertain Construction Projects,” Construction Management
and Economics 20, 343-351.
Fourt, R. (2004), Risk and Optimal Timing in a Real Estate Development Using Real Options
Analysis, Proc. 2004 Crystal Ball User Conference.
43
LMT-Q3 2006 Lockheed Martin Earnings Conference Call, Preliminary Transcript,
Thompson StreetEvents, Thompson Financial, October 24, 2006, 11:00AM ET
Aerospace Technologies Advancements
492
Gaynor, M. and S. Bradner (2001), “Using Real Options to Value Modularity in Standards,”
Knowledge, Technology and Policy 14, 2, 41-66.
Herath, H., and C. S. Park (2002), “Multi-Stage Capital Investment Opportunities as
Compound Real Options,” The Engineering Economist 47, 1-27.
IOMA (2001), “Real Options Analysis Creeps into Use at Intel, Genentech, and Texaco,”
IOMA’s Report on Financial Analysis, Planning & Reporting 01-12, 5-11.
Janney, J. and G. G. Dess (2004), “Can Real-Options Analysis Improve Decision-Making?
Promises and Pitfalls,” Academy of Management Executive, 18, 4, 60-75.
Kayali, M. M. (2006), “Real Options as a Tool for Making Strategic Investment Decisions,” J.
American Academy of Business 8, 282-286.
Laxman, P. R. and S. Aggarwal (2003), “Patent Valuation Using Real Options,” IIMB
Management Review, Dec. 2003, 44-51.
MacMillan, I., A. B. van Putten, R. G. McGrath, and J. D. Thompson (2006), Using Real
Options Discipline for Highly Uncertain Technology Investments,” Research-
Technology Management, Jan Feb. 2006, 29-37.
Maumo, D. A. (2005), “HP Applies Risk Management to Procurement,” Manufacturing and
Business Technology, Nov. 2005, 26-27.
Nembhard, H. B., L. Shi, and M. Aktan (2003), “A Real Options Design for Product
Outsourcing,” The Engineering Economist, 41, 3, 199-217.
Oppenheimer, P. H. (2002), “A Critique of Using Real Options Pricing Models in Valuing
Real Estate Projects and Contracts,” Briefings in Real Estate Finance 2, 3, 221-233.
Paxson, D. (2002) (ed.) “Real R&D Options,” Butterworth Heinemann, 333pp.
Remer, S., S. H. Ang, and C. Baden-Fuller (2001), “Dealing with Uncertainty in the
Biotechnology Industry: The Use of Real Options Reasoning,” J. Commercial
Biotechnology 8, 2, 95-105.
Rigby, D. (2001), “Management Tools 2001-Global,” Bain and Co., Boston, Massachusetts,
June, 2001.
Rigby, D. and B. Bilodeau (2005), “Management Tools and Trends 2005,” Bain and Co.,
Boston, Massachusetts.
Rothwell, G. (2006), “A Real Options Approach to Evaluating New Nuclear Power Plants,”
Energy Journal 27, 37-53.
Synergy Partners (2003), “Real Options Primer,” Synergy Partners, Greensboro, North
Carolina.
Teach, E. (2003), “Will Real Options Take Root?” CFO, July 2003, 73-76.
van Putten, A. B., and I. C. MacMillan (2004), “Making Real Options Really Work,” Harvard
Business Review, Dec. 2004, 134-141.