Basic recommendations for earthquake protection_1 docx
Bạn đang xem bản rút gọn của tài liệu. Xem và tải ngay bản đầy đủ của tài liệu tại đây (543.46 KB, 26 trang )
EARTHQUAKES, DISASTERS AND PROTECTION 9
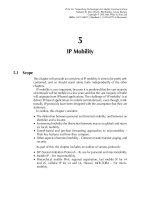
Figure 1.2 The collapse of masonry buildings is the cause of most of the deaths in
earthquakes around the world. The 1982 Dhamar Earthquake, Yemen Arab Republic
continuing changes in the types of buildings being constructed in many of the
countries most at risk. Modern building materials, commercialisation of the con-
struction industry and modernisation in the outlook of town and village dwellers
are bringing about rapid changes in building stock. Brick and concrete block are
common building materials in even the most remote areas of the world, and the
wealthier members of rural communities who 20 or 30 years ago would have
lived in weak masonry houses now live in reinforced concrete framed houses
and apartment blocks.
Unfortunately, many of the reinforced concrete framed houses and apartment
blocks built in the poorer countries are also highly vulnerable and, moreover,
when they do collapse, they are considerably more lethal and kill a higher per-
centage of their occupants than masonry buildings. In the second half of the
twentieth century most of the urban disasters involved collapses of reinforced
10 EARTHQUAKE PROTECTION
concrete buildings and Figure 1.1 shows that the proportion of deaths due to
collapse of reinforced concrete buildings is significantly greater than earlier in
the century.
1.2.3 The World’s Earthquake Problem is Increasing
On average, about 200 large-magnitude earthquakes occur in a decade – about
20 each year. Some 10% to 20% of these large-magnitude earthquakes occur in
mid-ocean, a long way away from land and human settlements. Those that occur
on land or close to the coast do not all cause damage: some happen deep in the
earth’s crust so that the dissipated energy is dispersed harmlessly over a wide
area before it reaches the surface. Others occur in areas only sparsely inhabited
and well away from towns or human settlements.
However, as the world’s population grows and areas previously with small
populations become increasingly densely settled, the propensity for earthquakes
to cause damage increases. At the start of the century, less than one in three of
large earthquakes on land killed someone. The number has gradually increased
throughout the century, roughly in line with the world’s population, until in
the twenty-first century, two earthquakes in every three now kill someone. The
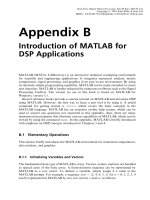
increasing frequency of lethal earthquakes is shown in Figure 1.3.
But the annual rate of earthquake fatalities does show some signs of being
reduced. Figure 1.1 shows that the total number of fatalities in the years
1950–1999 has averaged 14 000 a year – down from an average of 16 000 a
year in the previous 50 years. And the number of earthquake-related fatalities in
0
20
40
60
80
100
120
140
160
180
200
1900−
09
1910
− 19
1920
− 29
1930
− 39
1940
− 49
1950
− 59
1960− 69
1970− 79
1980− 89
1990
− 99
Decade
Number of events and number
of events causing >1000 casualties
No. of events
No. of events
causing >1000
casualties
Number of Fatal Earthquakes per Decade
Figure 1.3 Number of fatal earthquakes per decade. This number has been increasing
steadily over the last century. But the number per decade in which more than 1000 have
been killed has remained roughly constant
EARTHQUAKES, DISASTERS AND PROTECTION 11
the 1990s was 116 000, an average for the decade of 11 600 per year. Some of
this reduction is undoubtedly due to beneficial changes: the reduction in fatalities
from fire is largely due to changes in the Japanese building stock and successful
measures taken by Japan to avoid conflagrations in its cities. And changes in
building practices in some areas are making a significant proportion of buildings
stronger than they used to be.
Nevertheless the present worldwide rate of reduction in vulnerability appears
insufficient to offset the inexorable increase in population at risk. In the last
decade the world’s populationwas increasing by about 1.5% annually, i.e. dou-
bling every 50 years or so, so the average vulnerability of the world’s building
stock needs to be falling at a reciprocal rate, i.e. halving every 50 years, simply
for the average annual loss to be stabilised. The evidence suggests that although
the average vulnerability of building stock is falling, it is not falling that quickly,
so that the global risk of future fatalities is rising overall.
1.2.4 Urban Risk
Urban earthquake risk today derives from the combination of local seismi-
city – the likelihood of a large-magnitude earthquake – combined with large
numbers of poorly built or highly vulnerable dwellings. A detailed analysis of the
largest 800 cities in the world combining data on population, population growth
rates, housing quality and global distribution of seismic hazard enables us to
estimate the risks in all the large earthquake-prone cities, and compare them.
Table 1.3 lists some of the world’s most highly vulnerable cities and divides
them into risk categories. Risk is here measured by the numbers of housing units
which could be destroyed in the event of the earthquake with a 10% probability
of exceedance in 50 years (approximately the once in 500 years earthquake).
This assessment of loss is an indication of the overall risk, averaged out over a
long period of time. The actual pattern of loss is likely to consist of long periods
(a century or more) with small losses, with occasional catastrophic losses. Of the
29 cities in the three highest risk categories, only 8 cities (6 in Japan and 2 in
the United States) are in the high-income group of countries; the 21 others are
all in the middle- or low-income group of countries.
It is clear from both Table 1.1 and Table 1.3 that the risk today is polarising,
with industrialised countries obtaining increasing levels of safety standards in
their building stock while the increasing populations of developing countries
become more exposed to potential disasters. This polarisation is worth examining
in a little more detail.
1.2.5 Earthquake Vulnerability of Rich and Poor Countries
Earthquakes causing the highest numbers of fatalities tend to be those affecting
high densities of the most vulnerable buildings. In many cases, the most vulner-
able building stock is made up of low-cost, low-strength buildings. Some idea
12 EARTHQUAKE PROTECTION
Table 1.3 Cities at risk: the cities across the world with the highest numbers of dwellings
likely to be destroyed in the ‘500-year’ earthquake.
Name Country Population, 2002
(thousands)
Category A (over 25 000 dwellings destroyed in ‘500-year’ earthquake)
Guatemala City Guatemala 1 090
Izmir Turkey 2 322
Kathmandu Nepal 712
Kermanshah Iran 771
San Salvador El Salvador 496
Shiraz Iran 1 158
Tokyo Japan 8 180
Yokohama Japan 3 220
Category B (between 10 000 and 25 000 dwellings destroyed in ‘500-year’ earthquake)
Acapulco Mexico 632
Kobe Japan 1 517
Lima Peru 7 603
Mendoza Argentina 969
Mexicali Mexico 575
Piura Peru 359
San Juan Argentina 439
Trujillo Peru 600
Category C (between 5000 and 10 000 dwellings destroyed in ‘500-year’ earthquake)
Beijing China 7 127
Bogota Colombia 6 680
Chiba Japan 902
Izmit Turkey 262
Kawasaki Japan 1 271
Manila Philippines 10 133
San Francisco USA 805
San Jose USA 928
Sendai Japan 1 022
Tehran Iran 7 722
Tianjin China 4 344
Valparaiso Chile 301
Xi’an China 2 656
The figures are derived from several sources of data. The ‘500-year’ earthquake hazard for the city is based on
the zoning of the 10% probability of exceedance in 50 years in the GSHAP map ( />this is combined with recent population figures from the world gazetteer (www.world-gazetteer.com), and average
household sizes from UN data (UNCHS, 2001); estimates of the vulnerability of each city’s building stock are based
on information compiled by the authors from earthquake vulnerability surveys, recent earthquake loss experience
and a variety of local sources of information. The resulting estimates are very approximate.
EARTHQUAKES, DISASTERS AND PROTECTION 13
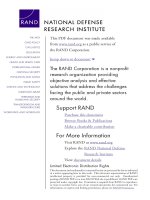
of the cost and quality of building stock involved in these fatal events can be
obtained by comparing the economic costs inflicted by the earthquakes (chiefly
the cost of destroyed buildings and infrastructure) with human fatalities. This is
presented in Figure 1.4, for the countries most affected by earthquakes in the
twentieth century.
4
The highest casualties are generally those affecting low-cost construction. In
Figure 1.4, the economic losses incurred range from $1000 of damage for every
life lost (China) to over $1 million worth of damage for every life lost (USA).
The location of individual countries on this chart is obviously a function of their
seismicity as well as the vulnerability to collapse of their building stock and
the degree of anti-seismic protection of their economic investment. The most
earthquake-prone countries will be found towards the top right-hand corner of
the chart, and the least towards the bottom left corner. Richer countries will lie
above the diagonal joining these corners, poorer countries below it.
In general, high-seismicity countries want to reduce both their total casualties
and their economic losses. In order to do this, those concerned with earthquake
100 1000 10000 100000 1000000
10
100
1000
10000
Monetary Loss ($US m)
Total Fatalities 1900−1979
Libya (1)
Lebanon (1)
New Zealand (3)
Puerto Rico (2)
San Salvador (3)
Afghanistan (8)
Algeria (6)
Burma (4)
Colombia (15)
Taiwan (21)
Mexico (19)
Jamaica (2)
Greece (26)
Argentina (4)
Albania (12)
Costa Rica (6)
Nepal (2)
India (9)
Pakistan (8)
Ecuador (17)
Indonesia (27)
Philippines (20)
Turkey (68)
Iran (62)
China (64)
Peru (31)
USSR (25)
Guatemala (7)
Rumania (2)
Nicaragua (4)
Chile (8)
Italy (25)
Japan (42)
Yugoslavia (10)
USA (40)
$1000
$10000
Damage per Fatality: $ 1 million $ 100000
Earthquake Losses by Country
Figure 1.4 Fatalities and economic loss in earthquakes by country (after Ohta et al.
1986)
4
After Ohta et al. (1986).
14 EARTHQUAKE PROTECTION
protection need first of all to understand some of the technical aspects of earth-
quake occurrence and the terminology associated with seismology, the study of
earthquakes. There are a large number of books that explain earthquake mechanics
in far greater detail than is possible here, and a number are listed in the sugges-
tions for further reading at the end of the chapter. But some of the principles of
earthquake occurrence are worth summarising here, to explain the terminology
which will appear in later chapters.
1.3 Earthquakes
1.3.1 Geographical Distribution of Earthquakes
The geographical distribution of earthquake activity in the earth’s crust is seen
from the global seismic hazard map shown in Plate I. The map shows the distribu-
tion of expected seismicity across the earth’s surface, measured by the expected
intensity of shaking over a given time.
5
The concentration of seismicactivity
in particular zones can be clearly seen. Two features of this map are worth
elaborating.
1. Running down the western side of the Pacific Ocean from Alaska in the north
to New Zealand in the south is a series of seismic island arcs associated with
the Aleutian Islands, Japan, the Philippines and the islands of South East Asia
and the South Pacific; a similar island arc runs through the Caribbean and
another surrounds Greece.
2. Two prominent earthquake belts are associated with active mountain building
at continental margins: the first is on the eastern shores of the Pacific stretching
the length of the Americas, and the second is the trans-Asiatic zone running
east–west from Myanmar through the Himalayas and the Caucasus Mountains
to the Mediterranean and the Alps.
In addition to these major sources of earthquake activity, through the middle of
each of the great oceans (but not shown on the map) there is a line of earthquakes,
which can be associated with underwater mountain ranges known as mid-ocean
ridges. Elsewhere, earthquakes do occur, but the pattern of activity is less dense,
and magnitudes are generally smaller.
Tectonic Earthquakes
Seismologists explain this complex mosaic of earthquake activity in terms of plate
tectonics. The continents on the earth’s surface consist of large areas of relatively
5
The expected intensity of shaking at each location is measured by the peak horizontal ground
acceleration with a 10% probability of exceedance in 50 years.
EARTHQUAKES, DISASTERS AND PROTECTION 15
cohesive plates, forming the earth’s structure, floating on top of the mantle,the
hotter and more fluid layer beneath them. Convection currents in the mantle cause
adjoining plates to move in different directions, resulting in relative movement
where the two plates meet. This relative movement at the plate boundaries is
the cause of earthquakes. The nature of the earthquake activity depends on the
type of relative movement. At the mid-ocean ridges, the plates are moving apart.
New molten rock swells up from below and forms new sea floor. These areas
are called spreading zones. At some plate boundaries, the plates are in head-on
collision with each other; this may create deep ocean trenches in which the rock
mass of one plate is thrust below the rock mass of the adjacent plate. The result is
mountain building associated with volcanic activity and large earthquakes which
tend to occur at a considerable depth; these areas are called subduction zones.
The ocean trenches associated with the island arcs and the western shores of
South America are of this type. Some collision zones occur in locations where
subduction is not possible, resulting in the formation of huge mountain ranges
such as the Himalayas.
There are also some zones in which plates are moving parallel and in opposite
directions to each other and the relative movement is primarily lateral. Examples
of these are the boundary between the Pacific plate and the North American plate
running through California, and the southern boundary of the Eurasian plate in
Turkey; in these areas large and relatively shallow earthquakes occur which can
be extremely destructive.
Subduction Zones
The mid-ocean ridges are the source of about 10% of the world’s earthquakes,
contributing only about 5% of the total seismic energy release. By contrast, the
trenches contribute more than 90% of the energy in shallow earthquakes and
most of the energy for deeper earthquakes as well. Most of the world’s largest
earthquakes have occurred in subduction zones.
Intra-plate Earthquakes
A small proportion of the energy release takes place in earthquakes located away
from the plate boundaries. Most of such intra-plateearthquakes occur in con-
tinental zones not very far distant from the plate boundaries and may be the
result of localised forces or the reactivation of old fault systems. They are more
infrequent but not necessarily smaller than inter-plate earthquakes. Some large
and highly destructive intra-plate earthquakes have occurred. The locations of
intra-plate earthquakes are less easy to predict and consequently they present a
more difficult challenge for earthquake protection.
An important consequence of the theory of plate tectonics is that the rate and
direction of slip along any plate boundary should on average be constant over
a period of years. In any given tectonic system, the total energy released in
16 EARTHQUAKE PROTECTION
earthquakes or other dissipations of energy is therefore predictable, which helps
to understand seismic activity and to plan protection measures. Likely locations
of future earthquakes may sometimes be identified in areas where the energy
known to have been released is less than expected. This seismic gap theory is a
useful means of long-term earthquake prediction which has proved valuable in
some areas. Earthquake prediction is discussed further in Chapter 3.
1.3.2 Causes of Earthquakes
Earthquakes tend to be concentrated in particular zones on the earth’s surface,
which coincide with the boundaries of the tectonic plates into which the earth’s
crust is divided. As the plates move relative to each other along the plate bound-
aries, they tend not to slide smoothly but to become interlocked. This interlocking
causes deformations to occur in the rocks on either side of the plate boundaries,
with the result that stresses build up. But the ability of the rocks to withstand
these stresses is limited by the strength of the rock material; when the stresses
reach a certain level, the rock tends to fracture locally, and the two sides move
past each other, releasing a part of the built-up energy by elastic rebound.
Once started, the fracture tends to propagate along a plane – the rupture
plane – until a region where the condition of the rocks is less critical has been
reached. The size of the fault rupture will depend on the amount of stress build-up
and the nature of the rocks and their faulting.
1.3.3 Surface Faulting
In most smaller earthquakes the rupture plane does not reach the ground
surface, but in larger earthquakes occurring at shallow depth the rupture
may break through at the earth’s surface producing a crack or a ridge – a
surface break – perhaps many kilometres long. A common misconception about
earthquakes is that they produce yawning cracks capable of swallowing people
or buildings. At the epicentre of a very large earthquake rupturing the surface
on land – quite a rare event – cracks in the earth do occur and the ground either
side of the fault can move a few centimetres, or in very large events a few
metres, up or along. This is, of course, very damaging for any structure that
is built straddling the rupture. During the few seconds of the earthquake, the
ground is violently shaken and any fault rupture is likely to open up several
centimetres in the shaking. There is a slight possibility that a person could
be injured in the actual fault rupture, but by far the worst consequences of
damage and injury come from the huge amounts of shaking energy released
by the earthquake affecting areas of hundreds of square kilometres. This energy
release may well cause landslides and ground cracking in areas of soft or unstable
ground anywhere in the affected area, which can be confused with surface fault
traces.
EARTHQUAKES, DISASTERS AND PROTECTION 17
1.3.4 Fault Mechanisms; Dip, Strike, Normal
According to the direction of the tectonic movements at the plate boundary the
fault plane may be vertical or inclined to the vertical – this is measured by the
angle of dip – and the direction of fault rupture may be largely horizontal, largely
vertical, or a combination of horizontal and vertical.
The different types of source characteristic do produce recognisably different
shock-wave pulses, notably in the different directional components of the first
moments of ground motion, but in terms of magnitude, intensity and spatial
attenuation the different source mechanisms can be assumed fairly similar for
earthquake protection planning.
1.3.5 Earthquake Waves
As the rocks deform on either side of the plate boundary, they store energy – and
massive amounts of energy can be stored in the large volumes of rock involved.
When the fault ruptures, the energy stored in the rocks is released in a few
seconds, partly as heat and partly as shock waves. These waves are the earth-
quake. They radiate outwards from the rupture in all directions through the earth’s
crust and through the mantle below the crust as compression or body seismic
waves. They are reflected and refracted through the various layers of the earth;
when they reach the earth’s surface they set up ripples of lateral vibration or
seismic waves which also propagate outwards along the surface with their own
characteristics. These surface waves are generally more damaging to structures
than the body waves and other types of vibration caused by the earthquake. The
body waves travel faster and in a more direct route so most sites feel the body
waves a short time before they feel the stronger surface waves. By measuring the
time difference between the arrival of body and surface waves on a seismogram
(the record of ground motion shaking some distance away) seismologists can
estimate the distance to the epicentre of a recorded earthquake.
1.3.6 Attenuation and Site Effects
As the waves travel away from the source, their amplitude becomes smaller and
their characteristics change in other complex ways. Sometimes these waves can
be amplified or reduced by the soils or rocks on or close to the surface at the site.
Theground motion which we feel at any point is the combined result of the source
characteristics of the earthquake, the nature of the rocks or other media through
which the earthquake waves are transmitted, and the interaction with the site effects.
A full account of earthquake waves and their propagation is outside the scope
of this book, but is well covered elsewhere.
6
The effect of site characteristics
on the nature and effects of earthquake ground motion is further discussed in
Chapter 7.
6
See e.g. Bolt (1999).
18 EARTHQUAKE PROTECTION
Not all earthquakes are tectonic earthquakes of the type described here. A
small but important proportion of all earthquakes occur away from plate bound-
aries. These include some very large earthquakes and are the main types of
earthquakes occurring in many of the medium- and low-seismicity parts of the
world. The exact mechanisms giving rise to such intra-plate earthquakes are still
not clearly established. It is probable that they too are associated with faulting,
though at depth; as far as their effects are concerned they are indistinguishable
from tectonic earthquakes.
Earthquakes can also be associated with volcanic eruptions, the collapse of
underground mine-workings, and human-made explosions. Generally earthquakes
of each of these types will be of very much smaller size than tectonic earth-
quakes, and they may not be so significant from the point of view of earth-
quake protection.
1.3.7 Earthquake Recurrence in Time
Given the nature of the large geological processes causing earthquakes, we can
expect that each earthquake zone will have a rate of earthquake occurrence asso-
ciated with it. Broadly, this is true, but as the rocks adjacent to plate boundaries
are in a constant state of change, a very regular pattern of seismic activity is rarely
observed. In order to observe the pattern of earthquake recurrence in a particular
zone, a long period of observation must be taken, longer in most cases than the
time over which instrumental records of earthquakes have been systematically
made. A statistical study of earthquake occurrence patterns, using both historical
data and recent data from seismological instruments, can enable us to determine
average return periods for earthquakes of different sizes (see Figure 1.5). This
is the approach which has been used to develop the global seismic hazard map
shown in Plate I and is discussed further in Chapter 7.
1.3.8 Severity and Measurement of Earthquakes
The size of an earthquake is clearly related to the amount of elastic energy
released in the process of fault rupture. But only indirect methods of measuring
this energy release are available, by means of seismic instruments or the effects
of the earthquake on people and their environment.
The terms magnitude and intensity tend to be confused by non-specialists in
discussing the severity of earthquakes. The magnitude of an earthquake is a
measure of its total size, the energy released at its source as estimated from
instrumental observations. The intensity of an earthquake is a measure of the
severity of the shaking of the ground at a particular location. ‘Magnitude’ is a
term applied to the earthquake as a whole whereas ‘intensity’ is a term applied to
a site affected by an earthquake, and any earthquake causes a range of intensities
at different sites.
EARTHQUAKES, DISASTERS AND PROTECTION 19
5.0
0.1
1
10
100
1000
10000
6.0 7.0 8.0 9.0
Number per Decade
Magnitude
Average Number of Earthquakes Occurring Each Decade
of Magnitude greater than or equal to M
Figure 1.5 Average recurrence rate of earthquakes of different magnitudes worldwide
(after B
˚
ath 1979)
1.3.9 Earthquake Magnitude
A number of magnitude scales are in use. The oldest is the Richter magnitude
(M
l
) scale, defined by Charles Richter in 1936. It is based on the logarithm of
the amplitude of the largest swing recorded by a standard seismograph. Because
earthquakes of different types cause different forms of seismic wave trains, more
detailed measurements include body wave magnitude (m
b
)andsurface wave mag-
nitude (M
s
), based on the amplitudes of different parts of the observed wave
train. In general, the definition of magnitude which best correlates with the sur-
face effects of earthquakes is the surface wave magnitude M
s
, since it is the
surface waves which are most destructive to buildings. There are a number of
correlations between the different magnitude definitions.
Because magnitude scales are derived from the logarithm of the seismograph
amplitude, the amount of energy released in an earthquake is not a simple function
of the magnitude – each unit on the Richter scale represents a 32-fold increase
in the energy released.
20 EARTHQUAKE PROTECTION
A guide to earthquake magnitude
Magnitude less than 4.5
Magnitude 4.5 represents an energy release of about 10
8
kilojoules and is the
equivalent of about 10 tonnes of TNT being exploded underground. Below about
magnitude 4.5, it is extremely rare for an earthquake to cause damage, although
it may be quite widely felt. Earthquakes of magnitude 3 and magnitude 2 become
increasingly difficult for seismographs to detect unless they are close to the
event. A shallow earthquake of magnitude 4.5 can generally be felt for 50 to
100 km from the epicentre.
Magnitude 4.5 to 5.5 – local earthquakes
Magnitude 5.5 represents an energy release of around 10
9
kilojoules and is the
equivalent of about 1000 tonnes of TNT being exploded underground. Earth-
quakes of magnitude 5.0 to 5.5 may cause damage if they are shallow and if
they cause significant intensity of ground shaking in areas of weaker buildings.
Earthquakes up to magnitudes of about 5.5 can occur almost anywhere in the
world – this is the level of energy release that is possible in normal non-tectonic
geological processes such as weathering and land formation. An earthquake of
magnitude 5.5 may well be felt 100 to 200 km away.
Magnitudes 6.0 to 7.0 – large magnitude events
Magnitude 6 represents an energy release of the order of 10
10
kilojoules and is the
equivalent of exploding about 6000 tonnes of TNT underground. A magnitude 6.3
is generally taken as being about equivalent to an atomic bomb being exploded
underground. A magnitude 7.0 represents an energy release of 10
12
kilojoules.
Large-magnitude earthquakes, of magnitude 6.0 and above, are much larger
energy release associated with tectonic processes. If they occur close to the
surface they may cause intensities at their centre of VIII, IX or even X, causing
very heavy damage or destruction if there are towns or villages close to their
epicentre. Some of these large-magnitude earthquakes, however, are associated
with tectonic processes at depth and may be relatively harmless to people on the
earth’s surface. There are about 200 large-magnitude events somewhere in the
world each decade. A magnitude 7.0 earthquake at shallow depth may be felt at
distances 500 km or more from its epicentre.
Magnitudes 7.0 to 8.9 – great earthquakes
A magnitude 8 earthquake releases around 10
13
kilojoules of energy, equivalent
to more than 400 atomic bombs being exploded underground, or almost as
much as a hydrogen bomb. The largest earthquake yet recorded, magnitude 8.9,
released 10
14
kilojoules of energy. Great earthquakes are the massive energy
releases caused by long lengths of linear faults rupturing in one break. If they
occur at shallow depths they cause slightly stronger epicentral intensities than
large-magnitude earthquakes but their great destructive potential is due to the
very large areas that are affected by strong intensities.
EARTHQUAKES, DISASTERS AND PROTECTION 21
Very sensitive instruments can record earthquakes with magnitudes as low
as −2, the equivalent of a brick being dropped from the table to the ground.
The energy released from an earthquake is similar to an explosive charge being
detonated underground, with magnitude being the measure of the energy released.
In the guide to magnitude (see box), an explosive equivalent of each magnitude
level is given as a rough guide. The destructive effects at the earth’s surface of the
energy released are also affected by the depth of the earthquake: energy released
close to the surface will be more destructive on the area immediately above it,
and a deep energy release will affect a wider area above, but the energy will be
more dissipated and the effects weaker.
1.3.10 Limits to Magnitude
The larger the area of fault that ruptures, and the bigger the movement that takes
place in one thrust, the greater the amount of energy released. The length of
the fault and its depth determine the area of its rupture: in practice the depth
of rupture is constrained by the depth of the earth’s solid crust, so the critical
parameter in determining the size of earthquake is the length of the fault rupture
that takes place. The tectonic provinces where long, uninterrupted fault lengths
exist are limited, and are by now fairly well defined. The limits to magnitude
appear to be the sheer length of fault that could possibly unzip in one single
rupture. The largest magnitude earthquake yet recorded measured 8.9, rupturing
over 200 continuous kilometres down the coast of Chile.
Because of this tendency for magnitude scales to saturate at about 9, seismol-
ogists have developed a new measure of the magnitude of an earthquake which
derives more directly from the source characteristics. Seismic moment is defined
by the rigidity of the rocks, multiplied by the area of faulting, multiplied by the
amount of the slip. Seismic moment can be inferred from instrument readings,
and for larger earthquakes checked by observations of the surface fault trace.
Basedonseismicmoment,amoment magnitude (M
w
) has been defined which
correlates well with other measures of magnitude over a range of magnitudes.
1.3.11 Intensity
Intensity is a measure of the felt effects of an earthquake rather than the earth-
quake itself. It is a measure of how severe the shaking was at any location.
For any earthquake, the intensity is strongest close to the epicentre and atten-
uates away with distance from the source of the earthquake. Larger magnitude
earthquakes produce stronger intensities at their epicentres. Intensity mapping
showing isoseismals, or lines of equal intensity, is normally carried out after
each damaging earthquake by the local geological survey. Isoseismal maps of
22 EARTHQUAKE PROTECTION
Towns classified as having
experienced MSK intensity:
X
IX
VIII-IX
VIII
VII-VIII
VI-VII
VII
VI
V-VI
V
0 50 km
X
IX
VIII
VII
VI
V
Isoseismal Map, Belice Earthquake, sicily, 16 January 1968
Figure 1.6 An example of an isoseismal map: the Belice earthquake, 1968, Sicily, Italy,
using the MSK intensity scale (after Cosentino and Mulone, in Barbano et al. 1980)
past events play an important part in the estimation of the probable occur-
rence of future earthquakes. An example of an isoseismal map is shown in
Figure 1.6.
Intensity is assessed by classifying the degree of shaking severity using an inten-
sity scale. The intensity level is assigned for a particular location from the visible
consequences left by the earthquake and from reports by those who experienced
the shaking. The level of intensity is identified by a Roman numeral commonly
on a scale from I to X (or even up to XII), indicating that the scale describes a
succession of states but is not numerical. An example of an intensity scale, the
definitions of the EMS 98 intensity scale, are given in the box. It may be worth
noting that intensities of degree X are rare, and the higher degrees, XI and XII,
have rarely, if ever, been scientifically verified.
The European Macroseismic Scale 1998: definitions of intensity
7
Note: the arrangement of the scale is: (a) effects on humans, (b) effects on objects
and on nature, (c) damage to buildings.
Intensity I: Not felt
(a) Not felt, even under the most favourable circumstances.
(b) No effect.
(c) No damage.
7
Based on Gr
¨
unthal (1998).
EARTHQUAKES, DISASTERS AND PROTECTION 23
Intensity II: Scarcely felt
(a) The tremor is felt only at isolated instances (<1%) of individuals at rest and in
a specially receptive position indoors.
(b) No effect.
(c) No damage.
Intensity III: Weak
(a) The earthquake is felt indoors by a few. People at rest feel a swaying or light
trembling.
(b) Hanging objects swing slightly.
(c) No damage.
Intensity IV: Largely observed
(a) The earthquake is felt indoors by many and felt outdoors only by very few.
A few people are awakened. The level of vibration is not frightening. The
vibration is moderate. Observers feel a slight trembling or swaying of the
building, room or bed, chair, etc.
(b) China, glasses, windows and doors rattle. Hanging objects swing. Light
furniture shakes visibly in a few cases. Woodwork creaks in a few cases.
(c) No damage.
Intensity V: Strong
(a) The earthquake is felt indoors by most, outdoors by few. A few people are
frightened and run outdoors. Many sleeping people awake. Observers feel a
strong shaking or rocking of the whole building, room or furniture.
(b) Hanging objects swing considerably. China and glasses clatter together.
Small, top-heavy and/or precariously supported objects may be shifted or fall
down. Doors and windows swing open or shut. In a few cases window panes
break. Liquids oscillate and may spill from well-filled containers. Animals
indoors may become uneasy.
(c) Damage of grade 1 to a few buildings of vulnerability class A and B.
Intensity VI: Slightly damaging
(a) Felt by most indoors and by many outdoors. A few persons lose their balance.
Many people are frightened and run outdoors.
(b) Small objects of ordinary stability may fall and furniture may be shifted. In a
few instances dishes and glassware may break. Farm animals (even outdoors)
may be frightened.
(c) Damage of grade 1 is sustained by many buildings of vulnerability class A and
B; a few of class A and B suffer damage of grade 2; a few of class C suffer
damage of grade 1.
Intensity VII: Damaging
(a) Most people are frightened and try to run outdoors. Many find it difficult to
stand, especially on upper floors.
(b) Furniture is shifted and top-heavy furniture may be overturned. Objects fall
from shelves in large numbers. Water splashes from containers, tanks and
pools.
24 EARTHQUAKE PROTECTION
(c) Many buildings of vulnerability class A suffer damage of grade 3, a few of
grade 4. Many buildings of vulnerability class B suffer damage of grade 2, a
few of grade 3. A few buildings of vulnerability class C sustain damage of
grade 2. A few buildings of vulnerability class D sustain damage of grade 1.
Intensity VIII: Heavily damaging
(a) Many people find it difficult to stand, even outdoors.
(b) Furniture may be overturned. Objects like TV sets, typewriters, etc., fall to the
ground. Tombstones may occasionally be displaced, twisted or overturned.
Waves may be seen on very soft ground.
(c) Many buildings of vulnerability class A suffer damage of grade 4, a few of
grade 5. Many buildings of vulnerability class B suffer damage of grade 3,
a few of grade 4. Many buildings of vulnerability class C suffer damage of
grade 2, a few of grade 3. A few buildings of vulnerability class D sustain
damage of grade 2.
Intensity IX: Destructive
(a) General panic. People may be forcibly thrown to the ground.
(b) Many monuments and columns fall or are twisted. Waves are seen on soft
ground.
(c) Many buildings of vulnerability class A sustain damage of grade 5. Many
buildings of vulnerability class B suffer damage of grade 4, a few of grade 5.
Many buildings of vulnerability class C suffer damage of grade 3, a few of
grade 4. Many buildings of vulnerability class D suffer damage of grade 2, a few
of grade 3. A few buildings of vulnerability class E sustain damage of grade 2.
Intensity X: Very destructive
(c) Most buildings of vulnerability class A sustain damage of grade 5. Many
buildings of vulnerability class B sustain damage of grade 5. Many buildings
of vulnerability class C s uffer damage of grade 4, a few of grade 5. Many
buildings of vulnerability class D suffer damage of grade 3, a few of grade 4.
Many buildings of vulnerability class E suffer damage of grade 2, a few of
grade 3. A few buildings of vulnerability class F sustain damage of grade 2.
Intensity XI: Devastating
(c) Most buildings of vulnerability class B sustain damage of grade 5. Most
buildings of vulnerability class C suffer damage of grade 4, many of grade 5.
Many buildings of vulnerability class D suffer damage of grade 4, a few of
grade 5. Many buildings of vulnerability class E suffer damage of grade 3,
a few of grade 4. Many buildings of vulnerability class F suffer damage of
grade 2, a few of grade 3.
Intensity XII: Completely devastating
(c) All buildings of vulnerability class A, B and practically all of vulnerability class C
are destroyed. Most buildings of vulnerability class D, E and F are destroyed.
The earthquake effects have reached the maximum conceivable effects.
Definitions of quantity
Few means less than about 15%; many means from about 15% to about 55%;
most means more than about 55%.
EARTHQUAKES, DISASTERS AND PROTECTION 25
Classification of damage to masonry buildings
8
Grade 1: Negligible to slight damage (no structural damage, slight non-structural
damage)
Hair-line cracks in very few walls. Fall of small pieces of plaster only. Fall of loose
stones from upper parts of buildings in very few cases.
Grade 2: Moderate damage (slight structural damage, moderate non-structural
damage)
Cracks in many walls. Fall of fairly large pieces of plaster. Partial collapse of
chimneys.
Grade 3: Substantial to heavy damage (moderate structural damage, heavy
non-structural damage)
Large and extensive cracks in most walls. Roof tiles detach. Chimneys fracture at
the roof line; failure of individual non-structural elements (partitions, gable walls).
Grade 4: Very heavy damage (heavy structural damage, very heavy non-structural
damage)
Serious failure of walls, partial structural failure of roofs and floors.
Grade 5: Destruction (very heavy structural damage)
Total or near total collapse.
Classification of damage to buildings of reinforced concrete
Grade 1: Negligible to slight damage (no structural damage, slight non-structural
damage) (Figure 1.8b)
Fine cracks in plaster over frame members or in walls at the base. Fine cracks in
partitions and infills.
Grade 2: Moderate damage (slight structural damage, moderate non-structural
damage) (Figure 1.8c)
Cracks in columns and beams of frames and in structural walls. Cracks in partition
and infill walls; fall of brittle cladding and plaster. Falling mortar from the joints of
wall panels.
Grade 3: Substantial to heavy damage (moderate structural damage, heavy
non-structural damage) (Figure 1.8d)
Cracks in columns and beam column joints of frames at the base and at joints
of coupled walls. Spalling of concrete cover, buckling of reinforced rods. Large
cracks in partition and infill walls, failure of individual infill panels.
Grade 4: Very heavy damage (heavy structural damage, very heavy non-structural
damage) (Figure 1.8e)
Large cracks in structural elements with compression failure of concrete and
fracture of rebars; bond failure of beam reinforced bars; tilting of columns.
Collapse of a few columns or of a single upper floor.
Grade 5: Destruction (very heavy structural damage) (Figure 1.8f)
Collapse of ground floor or parts (e.g. wings) of buildings.
8
Damage grades 1 to 5 as defined in this scale are referred to elsewhere in this text as damage levels
D1 to D5.
26 EARTHQUAKE PROTECTION
Classification of typical vulnerability classes
Class A: rubble stone, fieldstone, adobe
Class B: simple stone, unreinforced masonry with manufactured masonry units
Class C: massive stone, unreinforced masonry with RC floors; RC frame or walls
without ERD
Class D: reinforced or confined masonry, RC frame or wall with moderate ERD,
timber structure
Class E: RC frame or wall with high ERD, steel structure
But vulnerability could be one class higher or one or two classes lower according
to standard of construction.
9
Note: ERD = earthquake-resisting design.
There are a large number of intensity scales, most of which have been mod-
ifications or adaptations of previous scales, and originate from the attempts of
early seismologists to classify the effects of earthquake ground motion without
instrumental measurements. The most common ones in use today include the
Modified Mercalli (MM) scale, a 12- point scale mainly in use in United States;
the European Macroseismic Scale (EMS), a development from the MM scale now
used more in Europe and given as an example in the box; the Japanese Meteoro-
logical Agency (JMA) scale, a seven-point scale used in Japan; and other scales
similar to the MM scale are used in the former USSR and in China for their own
building types. The evolution of these various intensity scales is summarised in
Figure 1.7.
Nowadays, intensity scales are primarily used to make rapid evaluations of the
scale and geographical extent of a damaging earthquake in initial reconnaissance,
to guide the emergency services.
1.4 Earthquake Protection
The term earthquake protection, as used in this book, refers to the total scope
of all those activities which can be taken to alleviate the effects of earthquakes,
or to reduce future losses, whether in terms of human casualties or physical
or economic losses. The term is similar in meaning to the more widely used
expression earthquake risk mitigation, although this usually refers primarily to
interventions to strengthen the built environment, whereas earthquake protection
is taken to include the human, financial, social and administrative aspects of
reducing earthquake effects.
9
For a more detailed definition of the vulnerability classes, see the vulnerability table and the
guidelines given in the European Macroseismic Scale document (Gr
¨
unthal, 1998).
EARTHQUAKES, DISASTERS AND PROTECTION 27
Historical Evolution of Seismic Intensity Scales
1783 Domenico Pignatoro grades seismic shocks for Italian earthquakes: "Slight to Violent"
1828 Egen uses grades of perceived shaking for geographical mapping of a single event Scale 1− 6
18th− 19th Century
Personal Intensity Scales used by their authors as a shorthand for their own investigations
e.g. Robert Mallet 1858 and 1862
1874
Michele Stefano De Rossi
1878
1883
1883
1880s to 1915
1888
1900
1904
1912
1917
1936
1931
1956
1930s− 1970s Regional Intensity Scales
Charles Richter
Modified Mercalli (MM-1956)
Wood and Newmann
Modified Mercalli (MM)
MCS Scale adopted by International Seismological Association
Mercalli Cancani Seiberg (MCS)
Cancani Acceleration values added to Mercalli Scale, regular, exponential values for 1−10,
plus two additional acceleration values for possible higher levels, 11 and 12.
Prof. Omori Absolute Intensity Scale for Japan: Seven Grades, based on shaking table studies
E.S. Holden First ‘Absolute Scale of Earthquake Intensity’ based on acceleration (irregular values)
for Californian earthquakes
Attempts to define Absolute Intensity Scales Based on Acceleration
Giuseppe Mercalli
Rossi - Forel Intensity Scale (R-F)
François Forel
10 point scale e.g.:
10 point scale
10 point scale e.g.:
10 point scale to describe higher intensities
levels 4 and 5 of R-F scale combined
and level 10 divided into two
"8: Very Strong Shock. Fall of
chimneys and cracks in buildings "
"8: Fall of Chimneys, cracks in the walls of
buildings "
"8: Partial ruin of some houses and frequent
and considerable cracks in others "
Plus a number of others, listed in Freeman (1932).
12 point scale
Two points added by
Cancani and descriptions
for them added by Seiburg
"8: Even though solidly constructed, houses
of European architecture generally suffer
heavy damage by gaping fissures in the walls "
Richter’s Instrumental Measurement of Magnitude supercedes intensity for comparing size of different
earthquakes Intensity takes Roman Numerals (I− XII), to distinguish from Magnitude Scale
12 point scale
for use in United States
and for more modern
building types
12 point scale
Masonry used as indicator
of intensity. 4 grades of
masonry proposed
"VIII: Damage considerable to ordinary
substantial buildings, partial collapse "
"VIII: Damage or partial collapse to
Masonry C (Ordinary workmanship and
mortar) Some damage to masonry B (Good
workmanship and mortar, reinforced) "
Different Scales used in different areas of the world:
Europe: MCS (1912)
USA: MM (1931)
Japan: JMA (Based on 7 point Omori Scale, 1900)
USSR: Soviet Scale (1931) 12 point scale similar to MCS
China: Chinese Scale (1956) 12 point scale similar to Soviet Scale and MM
1964
1964
1976 MSK Revisions 1976 (MSK-76)
1980
1990
1992
1996
1998
Formal adoption in ESC of the EMS
Publication of European Macroseismic Scale EMS 92 for review
Medvedev Sponhuer Karnik (MSK)
12 point scale
To standardise intensity
assessment internationally
and provide damage functions
for vulnerability assessment
"VIII: Structure type B (ordinary brick buildings)
Many (about 50%) damage degree 3 (heavy
damage, large and deep cracks in walls) and
single (about 5%) damage degree 4 (partial
collapse) "
MSK 'International Intensity Scale' Officially Adopted at Unesco Intergovernmental Conference on Seismology
Adopts modifications suggested by Working Groups,
including reservations about the existance of Intensity levels XI and XII
Further working group revisions, published as MSK - 1981.
Problems being addressed: inclusion of new building types, revision of
damage distributions, non-linearity between levels VI and VII.
1980 (MSK-81)
Revision procedure began to
update MSK scale for wider
application
European Macroseismic Scale EMS 98
"VIII: Many buildings of vulnerability class B
suffer damage of grade 2; a few of grade 3"
Figure 1.7 The genealogy of intensity scales
28 EARTHQUAKE PROTECTION
Figure 1.8(a) EMS damage state D0 (undamaged)
Figure 1.8(b) EMS damage state D1 (slight damage)
EARTHQUAKES, DISASTERS AND PROTECTION 29
Figure 1.8(c) EMS damage state D2 (moderate damage)
Figure 1.8(d) EMS damage state D3 (heavy damage)
30 EARTHQUAKE PROTECTION
Figure 1.8(e) EMS damage state D4 (very heavy damage/partial collapse)
Figure 1.8(f) EMS damage state D5 (destruction)
Figure 1.8 Damage to mid-rise reinforced concrete frame buildings in the 1999 Kocaeli
earthquake in Turkey, in relation to the EMS damage states defined on p. 25
EARTHQUAKES, DISASTERS AND PROTECTION 31
1.4.1 Self-protection Measures
There is no doubt that in some areas of the world where earthquakes are a com-
mon occurrence, people do take some basic actions to protect themselves without
any external prompting. They build their houses more robustly than elsewhere,
using materials which are able to resist some degree of ground motion with-
out damage, and they avoid sites which previous disasters have shown to be
dangerous because of landslides, rockfalls or tsunamis. The culture and tradi-
tions of such areas are often full of references to past disasters which help to
maintain present-day earthquake awareness. Earthquake damage surveys from
many parts of the world have often reported unexpectedly good performance by
vernacular structures, and it has been suggested that the awareness of the earth-
quake risk has been incorporated into the traditional form of construction of these
buildings.
There are a number of reported examples of traditional construction techniques
that may have evolved within certain communities as a response to repeated
occurrences of earthquakes. Such examples include:
• The construction of energy-absorbing timber frame joints in traditional
Japanese construction.
• Traditional timber reinforcement in weak masonry construction in the
Alpine–Himalayan seismic belt.
10
• Roof systems supported on a dual structure of walls and posts, allowing posts
to keep the roof up when walls collapse in earthquakes thereby preventing
injury to the occupants.
11
• Composite earth-and-timber vernacular structures in a number of earthquake-
prone areas that combine heavy mass for thermal insulation with the resilience
and ductility of a timber frame structure.
12
• The use of arches, domes and vaults which appear to suffer less earthquake
damage by transmitting lateral forces safely.
13
10
The use of horizontal timber-strengthening elements in traditional masonry construction along the
Alpine–Himalayan seismic belt from Southern Europe through the Middle East (hatil construction)
to the Indian Subcontinent (Arya and Chandra 1977) has been attributed to the earthquake-resisting
properties of this construction type in Erg
¨
unay and Erdik (1984). It also has other attributes, including
adding general stability to the construction, which may also encourage its widespread adoption in
these regions.
11
The safe collapse of walls in earthquakes while roofs are supported on extra posts has been noted
in a number of earthquake reports, including Ambraseys et al. (1975) report of the Patan earthquake
in Pakistan, and the characteristics of the traditional Bali Balinesian hut, described in LINUH (1976)
which allows a thatched roof to shed its mud walls in an earthquake without collapsing.
12
For example, the quincha construction in Peru and other parts of Latin America and the use of
Bagdadi construction in Iran and elsewhere.
13
Several earthquake reports from Iran and elsewhere have noted that traditional dome construction,
particularly quasi-spherical domes, and arches have remained relatively undamaged in regions of
heavy destruction; an example is in Ambraseys et al. (1969) reporting the Iran, Dasht-e-Bayaz,
earthquake in 1968.
32 EARTHQUAKE PROTECTION
There are also many examples of ancient earthquake engineering knowledge
for more monumental structures, including the construction of pendulum-like
central posts in pagodas in China,
14
anti-seismic engineering for temples
in Ancient Greece
15
and earthquake-resistant reinforcement of monuments,
mosques, minarets and other structures of Ottoman architecture
16
throughout
the Middle East. Other historical accounts of protection measures include the
legislation measures enacted by the Neapolitancourt during the seventeenth
century
17
and the numerous attempts in the nineteenth century by the City Fathers
of San Francisco to protect the city against future earthquakes.
18
This evolution of construction techniques by communities increasingly adopt-
ing the building types that perform well in successive earthquakes has been
dubbed ‘Architectural Darwinism’, the survival of the fittest building methods.
19
There is no doubt that earthquakes and other disasters can act as powerful
prompts, causing a community to change its construction practices, adopt new
and safer building types and to pass new legislation to protect itself. It is even
argued that change only comes about as a result of a major disaster, with most
of the advances in disaster protection in a community attributable to a major
disaster in the past.
20
But many of the most damaging earthquakes of the last few decades have
occurred in locations where there is no general public awareness of the earthquake
risk, either because they have been recently settled, or because the interval since
the last large earthquake is many centuries. In these cases
21
the earthquake tends
to be particularly disastrous.
Thus, where self-protection happens, it can make some contribution to provid-
ing an adequate level of protection, and it is useful to be aware of the extent of
earthquake awareness and self-protection which exists. But self-protection cannot
always be assumed to take place, and even where it does, it is very unlikely that
self-protection alone will provide adequate protection. Some degree of action by
14
Needham (1971) has suggested that the knowledge of the superior earthquake resistance of timber
was learned early by Chinese craftsmen.
15
Excavations and reconstructions of classical Greek temples reveal iron cramping of stone blocks
and pre-loading of foundations to create monolithic foundations that would withstand earthquake
waves.
16
Mosque design by the famous sixteenth-century Ottoman architect Sinan included chain
reinforcements around domes and towers to resist earthquake forces.
17
Tobriner (1984).
18
Tobriner in NCEER (1989).
19
Wood (1981).
20
Davis (1983).
21
Cases of earthquakes recurring unexpectedly and disastrously include Tangshan in China 1976,
the Leninakan region of Armenia in 1988, the Dhamar area of Yemen in 1982, and the 1995 Kobe
earthquake in Japan.
EARTHQUAKES, DISASTERS AND PROTECTION 33
national, regional and local authorities can be assumed to be necessary wherever
earthquakes are a known or a potential hazard.
1.4.2 Vulnerability and Protection
Any discussion of earthquake protection must attempt to identify the distribution
of vulnerability in any society, and across the world. It is clear from the earlier
discussion that earthquake vulnerability is heavily concentrated in the poorer
developing countries of the world. Consequently the book will place particular
emphasis on earthquake protection policies which can be of application in coun-
tries with limited resources. In such countries it rarely makes sense to attempt
to implement earthquake protection as an activity separate from other measures
to improve the general living conditions of the most economically vulnerable
groups.
Likewise, there is evidence that even in the wealthiest countries, there is sig-
nificant earthquake vulnerability among the poorest members of society, who
are forced to live in old weak buildings because this is the only accommo-
dation they can afford. Methods of upgrading these buildings are becoming
available and better understood, and they will be discussed in later chapters.
But it is essential not to overlook the political dimension of allocating pri-
orities for earthquake protection within a society in which all members feel
vulnerable, and recent experiences in implementing protection policies will be
described.
One of the key questions for any society to determine is what level of protection
it should attempt to provide. Earthquake protection is costly and must compete
for limited resources with other priorities for individual and public expenditure,
such as health care and environmental protection. In common with many other
areas of expenditure it is very difficult to define with any precision what benefits
are purchased by any given expenditure. Often earthquakes are seen as a remote
threat, unlikely to occur within the planning timescale of governments, adult
taxpayers or corporations, and even then very unlikely to be fatal; and it is
difficult to raise public enthusiasm for spending money on protection except in
the immediate aftermath of an earthquake. Overspending on protection will waste
resources, restricting economic development and economic growth, and these
opportunity costs are easier to perceive. The question of setting the right level of
protection and how to evaluate alternative protection strategies is therefore one
of the topics which the book will discuss.
Another matter which will be considered is whose responsibility it is to take
initiatives and to pay for protection. Apart from the individual or corporate
property owner, concern for the effects of earthquakes is also experienced by
local community groups, local government, and regional and national govern-
ments. International agencies are also involved, particularly in the activity of