Strategic Information Management Third Edition Challenges and Strategies in Managing Information Systems by ROBERT D GALLIERS and Dorothy E Leidner_14 pptx
Bạn đang xem bản rút gọn của tài liệu. Xem và tải ngay bản đầy đủ của tài liệu tại đây (233.46 KB, 39 trang )
20
Information Technology and
Organizational Performance
Beyond the IT productivity
paradox
L. P. Willcocks and S. Lester
Despite the massive investments in Information Technology in the developed
economies, the IT impact on productivity and business performance continues
to be questioned. This chapter critically reviews this IT productivity paradox
debate and finds that an important part, but by no means all, of the uncertainty
about the IT payoff relates to weaknesses in measurement and evaluation
practice. Based on extensive research by the authors and others, an integrated
systems lifecycle approach is put forward as a long term way of improving
evaluation practice in work organizations. The approach shows how to link
business and IT/IS strategies with prioritizing investments in IT, and by
setting up a set of interlinking measures, how IT costs and benefits may be
evaluated and managed across the systems lifecycle, including consideration
of potential uses of the external IT services market. An emphasis on a cultural
change in evaluation from ‘control through numbers’ to a focus on quality
improvement offers one of the better routes out of the productivity paradox.
Improved evaluation practice serves to demystify the paradox, but also links
with and helps to stimulate improved planning for management and use of IT,
thus also reducing the paradox in practical terms – through the creation of
greater business value.
Introduction
The history of numerous failed and disappointing Information Technology
(IT) investments in work organizations has been richly documented. (Here IT
Information Technology and Organizational Performance
589
refers to the convergence of computers, telecommunications and electronics,
and the resulting technologies and techniques.) The 1993 abandonment of a
five year project like Taurus in the UK London financial markets, in this case
at a cost of £80 million to the Stock Exchange, and possibly £400 million to
City institutions, provides only high profile endorsement of underlying
disquiet on the issue. Earlier survey and case research by the present authors
established IT investment as a high risk, hidden cost business, with a variety
of factors, including size and complexity of the project, the ‘newness’ of the
technology, the degree of ‘structuredness’ in the project, and major human,
political and cultural factors compounding the risks (Willcocks and Griffiths,
1994; Willcocks and Lester, 1996). Alongside, indeed we would argue
contributing to the performance issues surrounding IT, is accumulated
evidence of problems in evaluation together with a history of general
indifferent organizational practice in the area (Farbey et al., 1992; Strassman,
1990). In this chapter we focus firstly on the relationship between IT
performance and its evaluation as it is expressed in the debate around what has
been called the ‘IT productivity paradox’. A key finding is that assessment
issues are not straightforward, and that some, though by no means all, of the
confusion over IT performance can be removed if limitations in evaluation
practice and measurement become better understood. From this base we then
provide an overall conceptualization, with some detail, about how evaluation
practice itself can be advanced, thus allowing some loosening of the Gordian
knot represented by the IT productivity paradox.
‘What gets measured gets managed’ – the way forward?
The evaluation and management of IT investments is shot through with
difficulties. Increasingly, as IT expenditure has risen and as the use of IT has
penetrated to the core of organizations, the search has been directed towards
not just improving evaluation techniques and processes, and searching for new
ones, but also towards the management and ‘flushing out’ of benefits. But
these evaluation and management efforts regularly run into difficulties of
three generic types. First, many organizations find themselves in a Catch 22
situation. For competitive reasons they cannot afford not to invest in IT, but
economically they cannot find sufficient justification, and evaluation practice
cannot provide enough underpinning, for making the investment. Second, for
many of the more advanced and intensive users of IT, as the IT infrastructure
becomes an inextricable part of the organization’s processes and structures, it
becomes increasingly difficult to separate out the impact of IT from that of
other assets and activities. Third, despite the high levels of expenditure, there
is widespread lack of understanding of IT and Information Systems (IS –
organizational applications, increasingly IT-based, that deliver on the
information needs of the organization’s stakeholders) as major capital assets.
590
Strategic Information Management
While senior managers regularly give detailed attention to the annual
expenditure on IT/IS, there is little awareness of the size of the capital asset
that has been bought over the years (Keen, 1991; Willcocks, 1994). Failure to
appreciate the size of this investment leads to IT/IS being under-managed, a
lack of serious attention being given to IS evaluation and control, and also a
lack of concern for discovering ways of utilizing this IS asset base to its full
potential.
Solutions to these difficulties have most often been sought through variants
on the mantra: ‘what gets measured gets managed’. As a dominant guiding
principle more – and more accurate – measurement has been advanced as the
panacea to evaluation difficulties. In a large body of literature, while some
consideration is given to the difficulties inherent in quantifying IT impacts, a
range of other difficulties are downplayed, or even ignored. These include, for
example:
•
•
•
•
•
the fact that measurement systems are prone to decay
the goal displacement effects of measurement
the downside that only that which is measured gets managed
the behavioural implications of measurement and related reward systems,
and
the politics inherent in any organizational evaluation activity.
In practice, counter evidence against a narrow focus on quantification for
IT/IS evaluation has been gathering. Thus some recent studies point to how
measurement can be improved, but also to the limitations of measurement,
and areas where sets of measures may be needed because of the lack of a
single reliable measure (Farbey et al., 1995). They also point to the key role
of stakeholder judgement throughout any IT/IS evaluation process. Furthermore some published research studies point to the political-rational as
opposed to the straightforwardly rational aspects of IT measurement in
organizations. For example Lacity and Hirschheim (1996) provide an
important insight into how measurement, in this case benchmarking IT
performance against external comparators, can be used in political ways to
influence senior management judgement. Currie (1989) detailed the political
uses of measurement in a paper entitled ‘The art of justifying new technology
to top management’. Additionally, there are signs that the problems with overfocusing on measurement are being recognized, albeit slowly, with moves
toward emphasizing the demonstration of the value of IS/IT, not merely its
measurement. Elsewhere we have argued for the need to move measurement
itself from a focus on the price of IT to a concern for its value; and for a
concomitant shift in emphasis in the measurement regime from control to
quality improvement (Willcocks and Lester, 1996).
These difficulties and limitations in evaluation practice have become bound
up in a widespread debate about what has been called the IT productivity
Information Technology and Organizational Performance
591
paradox – the notion that despite large investments in IT over many years, it
has been difficult to discover where the IT payoffs have occurred, if indeed
there have been many. In this chapter we will address critically the overall
sense that many have that despite huge investments in IS/IT so far, these have
been producing disappointing returns. We will find that while much of the
sense of disappointment may be justified, at the same time it is fed by
limitations in evaluation techniques and processes, and by misunderstandings
of the contribution IT can and does make to organizations, as much as by
actual experience of poorly performing information systems. The focus then
moves to how organizations may seek to improve their IT/IS evaluation
procedures and processes. Taking into account the many limitations in
evaluation practice continuing to be identified by a range of the more recent
research studies, a high level framework is advanced for how evaluation can
and needs to be applied across the systems lifecycle. The chapter also suggests
that processes of evaluation, and the involvement of stakeholders, may be as,
if not more, important than refining techniques and producing measurement of
a greater, but possibly no less spurious, accuracy.
The IT ‘productivity paradox’ revisited
Alongside the seemingly inexorable rise of IS/IT investment in the last 15
years, there has been considerable uncertainty and concern about the
productivity impact of IT being experienced in work organizations. This has
been reinforced by several high profile studies at the levels of both the
national economy and industrial sector suggesting in fact that if there has been
an IS/IT payoff it has been minimal, and hardly justifies the vast financial
outlays incurred. Two early influential studies embodying this theme were by
Roach (1986) and Loveman (1988). A key, overarching point needs to be
made immediately. It is clear from reviews of the many research studies
conducted at national, sectoral and organization specific levels that the failure
to identify IS/IT benefits and productivity says as much about the deficiencies
in assessment methods and measurement, and the rigour with which they are
applied, as about mismanagement of the development and use of informationbased technologies. It is useful to chase this hare of ‘the IT productivity
paradox’ further, because the issue goes to the heart of the subject of this
chapter.
Interestingly, the IT productivity paradox is rarely related in the literature to
manufacturing sectors for which, in fact, there are a number of studies from
the early 1980s showing rising IT expenditure correlating with sectoral and
firm-specific productivity rises (see Brynjolfsson and Hitt, 1993; Loveman,
1988). The high profile studies raising concern also tend to base their work
mainly on statistics gathered in the US context. Their major focus, in fact,
tends to be limited to the service sector in the US. Recently a number of
592
Strategic Information Management
studies question the data on which such studies were based, suggesting that
the data is sufficiently flawed to make simple conclusions misleading
(Brynjolfsson, 1993). It has been pointed out, for example that in the cases of
Loveman (1988) and Roach (1986) neither personally collected the data that
they analysed, thus their observations describe numbers rather than actual
business experiences (Nievelt, 1992).
Still others argue that the productivity payoff may have been delayed but,
by the mid-1990s, recession and global competition have forced companies to
finally use the technologies they put in place over the last decade, with
corresponding productivity leaps. Moreover, productivity figures always
failed to measure the cost avoidance and savings on opportunity costs that IS/
IT can help to achieve (Gillin, 1994).
Others also argue that the real payoffs occur when IS/IT development and
use is linked with the business reengineering (BPR) efforts coming onstream
in the 1990s (Hammer and Champy, 1993). However, recent UK evidence
develops this debate by finding that few organizations were actually getting
‘breakthrough’ results through IT-enabled BPR. Organizations were ‘aiming
low and hitting low’ and generally not going for the radical, high-risk
reengineering approaches advocated by many commentators. Moreover there
was no strong correlation between size of IT expenditure on reengineering
projects, and resulting productivity impacts. In business process reengineering, as elsewhere (see below), it is the management of IT, and what it is used
for, rather than the size of IT spend that counts (Willcocks, 1996b).
Bakos and Jager (1995) provide interesting further insight, as they argue
that computers are not boosting productivity, but the fault lies not with the
technology but with its management and how computer use is overseen. They
question the reliability of the productivity studies, and, supporting the positive
IT productivity findings in the study by Brynjolfsson and Hitt (1993), posit a
new productivity paradox: ‘how can computers be so productive?’
In the face of such disputation Brynjolfsson (1993) makes salutary reading.
He suggests four explanations for the seeming IT productivity paradox. The
first is measurement errors. In practice the measurement problems appear
particularly acute in the service sector and with white collar worker
productivity – the main areas investigated by those pointing to a minimal
productivity impact from IT use in the 1980s and early 1990s. Brynjolfsson
concludes from a close examination of the data behind the studies of IT
performance at national and sectoral levels that mismeasurement is at the core
of the IT productivity paradox. A second explanation is timing lags due to
learning and adjustment. Benefits from IT can take several years to show
through in significant financial terms, a point also made by Strassman (1990)
in arguing for newer ways of evaluating IS/IT performance at the
organizational level. While Brynjolfsson largely discounts this explanation,
there is evidence to suggest he is somewhat over-optimistic about the ability
Information Technology and Organizational Performance
593
of managers to account rationally for such lags and include them in their IS/IT
evaluation system (Willcocks, 1996a).
A third possible explanation is that of redistribution. IT may be beneficial
to individual firms but unproductive from the standpoint of the industry, or the
economy, as a whole. IT rearranges the share of the pie, with the bigger share
going to those heavily investing in IT, without making the pie bigger.
Brynjolfsson suggests, however, that the redistribution hypothesis would not
explain any shortfall in IT productivity at the firm level. To add to his analysis
one can note that in several sectors, for example banking and financial
services, firms seemingly compete by larger spending on IT-based systems
that are, in practice, increasingly becoming minimum entry requirements for
the sector, and commodities rather than differentiators of competitive
performance. As a result in some sectors, for example the oil industry,
organizations are increasingly seeking to reduce such IS/IT costs by accepting
that some systems are industry standard and can be developed together.
A fourth explanation is that IS/IT is not really productive at the firm level.
Brynjolfsson (1993) posits that despite the neoclassical view of the firm as a
profit maximizer, it may well be that decision-makers are, for whatever
reason, often not acting in the interests of the firm: ‘instead they are increasing
their slack, building inefficient systems, or simply using outdated criteria for
decision-making’ (p.75). The implication of Brynjolfsson’s argument is that
political interests and/or poor evaluation practice may contribute to failure to
make real, observable gains from IS/IT investments. However, Brynjolfsson
appears to discount these possibilities citing a lack of evidence either way,
though here he seems to be restricting himself to the economics literature.
Against his argument however, there are in fact frequent study findings
showing patchy strategizing and implementation practice where IS is
concerned (for an overview see Willcocks et al., 1996). Furthermore, recent
evidence in the IT evaluation literature suggests more evidence showing poor
evaluation practice than Brynjolfsson has been willing to credit (see
Ballantine et al., 1996; Willcocks and Lester, 1996).
It is on this point that the real debate on the apparent ‘IT productivity
paradox’ needs to hinge. Studies at the aggregate levels of the economy or
industrial sector conceal important questions and data about variations in
business experiences at the organizational and intra-organizational levels. In
practice, organizations seem to vary greatly in their ability to harness IS/IT for
organizational purpose. In an early study Cron and Sobol (1983) pointed to
what has since been called the ‘amplifier’ effect of IT. Its use reinforces
existing management approaches dividing firms into very high or very low
performers. This analysis has been supported by later work by Strassman
(1990), who also found no correlation between size of IT expenditure and
firms’ return on investment. Subsequently, a 1994 analysis of the information
productivity of 782 US companies found that the top 10 spent a smaller
594
Strategic Information Management
percentage (1.3 per cent compared to 3 per cent for the bottom 100) of their
revenue on IS, increased their IS budget more slowly (4.3 per cent in 1993–4
– the comparator was the bottom 110 averaging 10.2 per cent), thus leaving a
greater amount of finance available for non-IS spending (Gillin, 1994).
Not only did the the top performers seem to spend less proportionately on
their IT; they also tended to keep certain new investments as high as business
conditions permitted while holding back on infrastructure growth. Thus, on
average, hardware investments were only 15 per cent of the IS budget while
new development took more than 50 per cent, with 41 per cent of systems
development spending incurred on client/server investment (Sullivan-Trainor,
1994). Clearly the implication of this analysis is that top performers spend
relatively less money on IS/IT, but focus their spending on areas where the
expenditure will make more difference in terms of business value. An
important aspect of their ability to do this must lie with their evaluation
techniques and processes. Nievelt (1992) adds to this picture. Analysing
database information on over 300 organizations he found empirically that IT
as a coordinating, communicating and leveraging technology was capable of
enhancing customer satisfaction, flattening organizational pyramids and
supporting knowledge workers in the management arena. At the same time
many organizations did not direct their IT expenditure into appropriate areas
at the right time, partly because of inability to carry out evaluation of where
they were with their IT expenditure and IT performance relative to business
needs in a particular competitive and market context.
Following on from this, it is clear that significant aspects of the IT
productivity paradox, as perceived and experienced at organizational level,
can be addressed through developments in evaluation and management
practice. In particular the distorting effects of poor evaluation methods and
processes need close examination and profiling; alternative methods, and an
assessment of their appropriateness for specific purposes and conditions need
to be advanced; and how these methods can be integrated together and into
management practice needs to be addressed.
Investing in information systems
In the rest of this chapter we will focus not on assessing IT/IS performance at
national or industry levels, but on the conduct of IT/IS evaluation within work
organizations. As already suggested, IT/IS expenditure in such organizations
is high and rising. The United States leads the way, with government statistics
suggesting that, by 1994, computers and other information technology made
up nearly half of all business spending on equipment – not including the
billions spent on software and programmers each year. Globally, computer
and telecommunications investments now amount to a half or more of most
large firms’ annual capital expenditures. In an advanced industrialized
Information Technology and Organizational Performance
595
economy like the United Kingdom, IS/IT expenditure by business and public
sector organizations was estimated at £33.6 billion for 1995, and expected to
rise at 8.2 per cent, 7 per cent and 6.5 per cent in subsequent years,
representing an average of over 2 per cent of turnover, or in local and central
government an average IT spend of £3546 per employee. Organizational IS/IT
expenditure in developing economies is noticeably lower, nevertheless those
economies may well leapfrog several stages of technology, with China,
Russia, India and Brazil, for example, set to invest in telecommunications an
estimated 53.3, 23.3, 13.7, and 10.2 billion dollars (US) respectively in the
1993–2000 period (Engardio, 1994).
There were many indications by 1995, of managerial concern to slow the
growth in organizational IS/IT expenditure. Estimates of future expenditure
based on respondent surveys in several countries tended to indicate this
pattern (see for example Price Waterhouse, 1995). The emphasis seemed to
fall on running the organization leaner, wringing more productivity out of IS/
IT use, attempting to reap the benefits from changes in price/performance
ratios, while at the same time recognizing the seemingly inexorable rise in
information and IT intensity implied by the need to remain operational and
competitive. In particular, there is wide recognition of the additional challenge
of bringing new technologies into productive use. The main areas being
targetted for new corporate investment seemed to be client/server computing,
document image processing and groupware, together with ‘here-and-now’
technologies such as advanced telecom services available from ‘intelligent
networks’, mobile voice and digital cellular systems (Taylor, 1995). It is in the
context of these many concerns and technical developments that evaluation
techniques and processes need to be positioned.
Evaluation: a systems lifecycle approach
At the heart of one way forward for organizations is the notion of an IT/IS
evaluation and management cycle. A simplified diagrammatic representation
of this is provided in Figure 20.1. Earlier research found that few
organizations actually operated evaluation and management practice in an
integrated manner across systems lifecycles (Willcocks, 1996a). The evaluation cycle attempts to bring together a rich and diverse set of ideas, methods,
and practices that are to be found in the evaluation literature to date, and point
them in the direction of an integrated approach across systems lifetime. Such
an approach would consist of several interrelated activities:
1
2
3
Identifying net benefits through strategic alignment and prioritization.
Identifying types of generic benefit, and matching these to assessment
techniques.
Developing a family of measures based on financial, service, delivery,
learning and technical criteria.
596
Strategic Information Management
Strategic alignment
Human/
organizational
Business
IS/IT
Prioritisation
systems portfolio
G
G
Feasibility
Development
Implementation
Post-Implementation
Operations
Interlinked measures
Corporate financial
Project
Business process
Customer/user
Learning
Technical
G
G
G
Replace
Enhance
Divest
Maintain
Outsource
G
G
G
Business
impact
G
G
G
Figure 20.1
4
5
6
7
Technical quality
IT/IS evaluation and management cycle
Linking these measures to particular measures needed for development,
implementation and post-implementation phases.
Ensuring each set of measures run from the strategic to the operational
level.
Establishing responsibility for tracking these measures, and regularly
reviewing results.
Regularly reviewing the existing portfolio, and relating this to business
direction and performance objectives.
A key element in making the evaluation cycle dynamic and effective is
the involvement of motivated, salient stakeholders in processes that
operationalize – breathe life into, adapt over time, and act upon – the
evaluation criteria and techniques. Let us look in more detail at the rationale
Information Technology and Organizational Performance
597
for, and shape of such an approach. In an earlier review of front-end
evaluation Willcocks (1994) pointed out how lack of alignment between
business, information systems and human resource/organizational strategies
inevitably compromised the value of all subsequent IS/IT evaluation effort,
to the point of rendering it of marginal utility and, in some cases, even
counter-productive. In this respect he reflected the concerns of many authors
on the subject. A range of already available techniques were pointed to for
establishing strategic alignment, and linking strategy with assessing the
feasibility of any IS/IT investment, and these will not be repeated here (for
a review see Willcocks, 1994). At the same time the importance of
recognizing evaluation as a process imbued with inherent political characteristics and ramifications was emphasized, reflecting a common finding
amongst empirical studies.
The notion of a systems portfolio implies that IT/IS investment can have
a variety of objectives. The practical problem becomes one of prioritization
– of resource allocation amongst the many objectives and projects that are
put forward. Several classificatory schemes for achieving this appear in the
extant literature. Thus Willcocks (1994) and others have suggested classificatory schemes that match business objectives with types of IS/IT project.
Thus, on one schema, projects could be divided into six types – efficiency,
effectiveness, must-do, architecture, competitive edge, and research and
development. The type of project could then be matched to one of the more
appropriate evaluation methods available, a critical factor being the degree
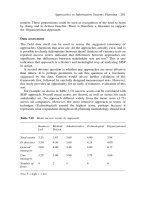
of tangibility of the costs and benefits being assessed. Costs and benefits
need to be sub-classified into ‘for example’ hard/soft, or tangible/intangible,
or direct/ indirect/inferred, and the more appropriate assessment techniques
for each type adopted (see Willcocks, 1994 for a detailed discussion). Norris
(1996) has provided a useful categorization of types of investments and
main aids to evaluation, and a summary is shown in Table 20.1.
After alignment and prioritization assessment, the feasibility of each IS/IT
investment then needs to be examined. All the research studies show that
the main weakness here have been the over-reliance on and/or misuse of
traditional, finance-based cost-benefit analysis. The contingency approach
outlined above and in Table 20.1 helps to deal with this, but such
approaches need to be allied with active involvement of a wider group of
stakeholders than those at the moment being identified in the research
studies. A fundamental factor to remember at this stage is the importance of
a business case being made for an IT/IS investment, rather than any strict
following of specific sets of measures. As a matter of experience where
detailed measurement has to be carried out to differentiate between specific
proposals, it may well be that there is little advantage to be had not just
between each, but from any. Measurement contributes to the business case
for or against a specific investment but cannot substitute for a more
Table 20.1
Types of investment and aids to evaluating IT
Type of investment
Business benefit
Main formal aids to
investment evaluation
Importance of
management
judgement
Main aspects of management
judgement
Satisfy minimum legal
requirement
Analysis of costs
Low
Organizational requirements
Facilitate business operations
Analysis of costs
Low
Competitive pressure
Keep up with the
competition
Crucial
Investments to improve
performance
Reduce costs
Analysis of costs to achieve
parity with the competition.
Marginal cost to differentiate
from the competition,
providing the opportunity for
competitive advantage
Cost/benefit analysis
Fitness of the system for the
purpose
Fitness of the system for the
purpose. Best option for variable
organizational requirements
Competitive need to introduce the
system at all. Effect of introducing
the system into the marketplace.
Commercial risk. Ability to sustain
competitive advantage
Increase revenues
Cost/benefit analyses.
Assessment of hard-toquantify benefits. Pilots for
high risk investment
High
Investments to achieve
competitive advantage
Achieve a competitive leap
Analysis of costs and risks
Crucial
Infrastructure investment
Enable the benefits of other
applications to be realized
Crucial
Investment in research
Be prepared for the future
Setting of performance
standards. Analysis of costs
Setting objectives within
cost limits
Mandatory investments as a
result of:
Regulatory requirements
Source: Norris (1996).
Medium
High
Validity of the assumptions behind
the case
Validity of the assumptions behind
the case. Real value of hard-toquantify benefits. Risk involved
Competitive aim of the system.
Impact on the market and the
organization. Risk involved
Corporate need and benefit, both
short and long term
Long-term corporate benefit.
Amount of money to be allocated
Information Technology and Organizational Performance
599
fundamental managerial assessment as to whether the investment is strategic
and critical for the business, or will merely result in yet another useful IT
application.
Following this, Figure 20.1 suggests that evaluation needs to be conducted
in a linked manner across systems development and into systems implementation and operational use. The evaluation cycle posits the development of a
series of interlinked measures that reflect various aspects of IS/IT performance, and that are applied across systems lifetime. These are tied to processes
and people responsible for monitoring performance, improving the evaluation
system and also helping to ‘flush out’ and manage the benefits from the
investment. Figure 20.1 suggests, in line with prevailing academic and
practitioner thinking by the mid-1990s, that evaluation cannot be based solely
or even mainly on technical efficiency criteria. For other criteria there may be
debate on how they are to be measured, and this will depend on the specific
organizational circumstances.
However there is no shortage of suggestions here. Taking one of the more
difficult, Keen (1991) discusses measuring the cost avoidance impacts of IT/
IS. For him these are best tracked in terms of business volumes increases
compared to number of employees. The assumption here is that IT/IS can
increase business volumes without increases in personnel. At the strategy level
he also suggests that the most meaningful way of tracking IT/IS performance
over time is in terms of business performance per employee, for example
revenue per employee, profit per employee, or at a lower level, as one
example – transactions per employee.
Kaplan and Norton (1992) were highly useful for popularizing the need
for a number of perspectives on evaluation of business performance.
Willcocks (1994) showed how the Kaplan and Norton balanced scorecard
approach could be adapted fairly easily for the case of assessing IT/IS
investments. To add to that picture, most recent research suggests the need
for six sets of measures. These would cover the corporate financial
perspective (e.g. profit per employee); the systems project (e.g. time,
quality, cost); business process (e.g. purchase invoices per employee); the
customer/user perspective (e.g. on-time delivery rate); an innovation/
learning perspective (e.g. rate of cost reduction for IT services); and a
technical perspective (e.g. development efficiency, capacity utilization).
Each set of measures would run from strategic to operational levels, each
measure being broken down into increasing detail as it is applied to actual
organizational performance. For each set of measures the business objectives for IT/IS would be set. Each objective would then be broken down
into more detailed measurable components, with a financial value assigned
where practicable. An illustration of such a hierarchy, based on work by
Norris (1996), is shown in Figure 20.2.
Responsibility for tracking these measures, together with regular reviews
600
Strategic Information Management
Business
objectives
Financial
objective
Quantified
benefit
component
Critical
function
Benefit
measures
‘DO RIGHT THINGS WELL’
Decrease
operating
costs
Increase
profitability
of retail
sales
Retain
more
satisfied
customers
Minimise
stock
holding
Reduce
outstanding
amounts
receivable
DISTRIBUTION
FINANCE
RETAIL OUTLET
Transport
* costs/volume
* stock turnover
* Sales/admin
expenses
as % of
volume sold
* No of days
charges
outstanding
* Credit card
transaction
as % of
invoiced
transactions
* Average sale
per customer
* Increased
sales volume
* Customer
satisfaction
rating
* Profitability
per
customer
Maximise
contribution
per outlet
Figure 20.2 Measurable components of business objectives for IT/IS. (Adapted
from Norris, 1996)
that relate performance to objectives and targets are highly important
elements in delivering benefits from the various IS investments. It should
be noted that such measures are seen as helping to inform stakeholder
judgements, and not as a substitute for such judgements in the evaluation
process.
Some detail can be provided on how to put metrics in place, monitor them
and ensure benefits are delivered. The following schema is derived from work
by Peters (1996) and Willcocks and Lester (1996). Projects were found to be
managed well, and often over-performed their original appraisal, where a
steering group was set up early in a project, was managed by a senior user
manager, and represented the key operating functions impacted by the IT/IS.
The steering group followed the project to a late stage of implementation with
members frequently taking responsibility for delivering benefits from parts of
Information Technology and Organizational Performance
Benefits
manager
Performance
variables
Orders/man
day
Purchasing
Sales
manager manager
601
Accts
Warehouse Production Production
payable
manager
scheduler supervisor
supervisor
E
No. of suppliers
E
Invoices/man
day
E
Finished
inventory
S
Stock out
occurrence
S
Slow movers
leadtime
S
E
S
E
E
Figure 20.3 Assigning responsibility for delivering benefits of IT/IS
implementation (E = executive responsibility; S = support). (Based on Peters,
1996)
the IT/IS implementation. Project benefits need to be incorporated into
business area budgets, and individuals identified for monitoring performance
and delivering benefits. Variables impacted by the IT/IS investment were
identified and decomposed into a hierarchy based on key operating parameters
necessary to deliver the benefit. A framework needs to be established for
clearly identifying responsibilities for benefits (Figure 20.3). Peters (1996)
suggests that the information on responsibilities should be published, and
known to relevant parties, and that measures should be developed to monitor
benefits at the lowest level of unit performance. We would add that links also
need to be made between the individual’s performance in the assessment role
and his/her own appraisal and reward.
The steering group should regularly review the benefits gained, for
example every three months, and also report less frequently to the IT/IS
strategy steering group, with flushing out of IT/IS benefits seen as an
essential extension of the strategic review process, not least in its capacity
to facilitate more effective IT/IS implementation. What is clear in this
scheme is that measurement that is business – not solely technical efficiency
– focused plays an important part in evaluation but only in the context of
appropriate processes in place operated by a wide range of motivated
stakeholders.
602
Strategic Information Management
Completing the cycle: existing and future investments
One all too often routinized phase of review is that of post-implementation
(see Figure 20.1). Our own research suggests that this is one of the most
neglected, yet one of the more important areas as far as IS evaluation is
concerned. An advantage of the above schema, in practice, is that postimplementation evaluation arises naturally out of implementation assessment
on an ongoing basis, with an already existing set of evaluators in place. This
avoids the ritualistic, separated review that usually takes place in the name of
post-implementation review (Kumar, 1990 – detailed discussion on how to
perform an effective post-implementation review cannot be provided here, but
see Norris, 1996).
There remains the matter of assessing the ongoing systems portfolio on a
regular basis. Notoriously, when it comes to evaluating the existing IS
investment, organizations are not good at drop decisions. There may be
several related ramifications. The IT inheritance of ‘legacy systems’ can deter
investment in new systems – it can, for example, be all too difficult to take on
new work when IT/IS staff are awash in a rising tide of maintenance arising
from the existing investment. Existing IT/IS-related activity can also devour
the majority of the financial resources available for IS investment. All too
often such failures derive from not having in place, or not operationalizing, a
robust assessment approach that enables timely decisions on systems and
service divestment, outsourcing, replacement, enhancement, and/or maintenance. Such decisions need to be based on at least two criteria – the
technical quality of the system/service, and its business contribution – as well
as being related back to the overall strategic direction and objectives of the
organization (see Figure 20.1).
A further element in assessment of the ongoing systems portfolio is the
relevance of external comparators. External benchmarking firms – for
example RDC and Compass – have already been operating for several years,
and offer a range of services that can be drawn upon, but mainly for technical
aspects of IT performance. The assessment of data centre performance is now
well established amongst the better benchmarking firms. Depending on the
benchmarking database available, a data centre can be assessed against other
firms in the same sector, or of the same generic size in computing terms, and
also against outsourcing vendor performance. Benchmarking firms are
continually attempting to extend their services, and can provide a useful
assessment, if mainly only on the technical efficiency of existing systems.
There is, however, a growing demand for extending external benchmarking
services more widely to include business, and other, performance measures –
many of which could include elements of IT contribution (see above). Indeed
Strassman (1990) and Nievelt (1992) are but two of the more well known of
a growing number of providers of diagnostic benchmarking methodologies
Information Technology and Organizational Performance
603
that help to locate and reposition IT contribution relative to actual and
required business performance. It is worth remarking that external IT
benchmarking – like all measures – can serve a range of purposes within an
organization. Lacity and Hirschheim (1996) detail from their research how
benchmarking services were used to demonstrate to senior executives the
usefulness of the IT department. In some cases external benchmarking
subsequently led to the rejection of outsourcing proposals from external
vendors.
This leads into the final point. An increasingly important part of assessing
the existing and any future IT/IS investment is the degree to which the
external IT services market can provide better business technical and
economic options for an organization. In practice, recent survey and case
research by the authors and others found few organizations taking a strategic
approach to IT/IS sourcing decisions, though many derived economic and
other benefits from incremental, selective, low risk, as opposed to high risk
‘total’ approaches to outsourcing (Lacity and Hirscheim, 1995). The Yankee
Group estimated the 1994 global IT outsourcing market as exceeding $US49.5
billion with an annual 15 per cent growth rate. As at 1995 the US market was
the biggest, estimated to exceed $18.2 billion. The UK remained the largest
European market in 1994 exceeding £1 billion, with an annual growth rate
exceeding 10 per cent on average across sectors. Over 50 per cent of UK
organizations outsourced some aspect of IT in 1994, and outsourcing
represented on average 24 per cent of their IT budgets (Lacity and Hirscheim,
1995; Willcocks and Fitzgerald, 1994).
Given these figures, it is clear that evaluation of IT/IS sourcing options,
together with assessment of on-going vendor performance in any outsourced
part of the IT/IS service, needs to be integrally imbedded into the systems
lifecycle approach detailed above. Not least because an external vendor bid,
if carefully analysed against one’s own detailed in-house assessment of IT
performance, can be a highly informative form of benchmarking. Figure 20.1
gives an indication of where sourcing assessments fit within the lifecycle
approach, but recent research can give more detail on the criteria that govern
successful and less successful sourcing decisions.
In case and survey research Willcocks and Fitzgerald (1994) found six key
factors (see Figure 20.4). Three are essentially business related. Firstly, IT can
contribute to differentiating a business from its competitors, thus providing
competitive advantage. Alternatively an IT activity/service may be a
commodity, not distinguishing the business from a competitor in business
offering and performance terms.
Second, the IT may be strategic in underpinning the firm’s achievement of
goals, and critical to its present and future strategic direction, or merely useful.
Third, the degree of uncertainty about future business environment and needs
impacts upon longer term IT needs. High uncertainty suggests inhouse sourcing
604
Strategic Information Management
Business:
Are future business needs:
Tend to
outsource
Tend not to
outsource
Certain
Uncertain
Is the potential contribution
of this IT service/activity to
business positioning a:
Commodity
Differentiator
Is the impact of this IT
service/activity on the
business strategy:
Useful
Vital
Is the in-house cost for this
IT service/activity compared
to the market-place:
High
Low
Technical
Is this IT service/activity:
Discrete
Integrated
Is the technological maturity:
High
Low
Is the IT capability in-house
compared to the market-place:
Low
High
Figure 20.4
Criteria for making sourcing decisions
as a better option. As Figure 20.4 suggests the preferred option where possible,
is to outsource useful commodities in conditions of certainty about business
requirements across the length of the contract. Three technical considerations
are also important. It is unwise for an organization to outsource in a situation of
low technology maturity. This exists where a technology is new and unstable,
and/or where there is an existing technology but being applied in a radically
new way, and/or where there is little relevant in-house experience with the
technology. Next, the level of IT integration must influence the sourcing
decision. Generally we found it preferable not to outsource systems/activities
that are highly integrated with other parts of the technical platform, and/or that
interface in complex ways with many business users who will be impacted
significantly by the service. Finally, where inhouse capability is equivalent to or
better than that available on the external market, there would seem to be a less
pressing need to outsource the IT service/activity.
Making sourcing decisions, in practice, involves making trade-offs among
the preferences suggested by these factors. In addition, we note six reality
checks that need to be borne in mind before deciding on a specific sourcing
option:
•
•
Does the decision make economic sense?
How does the decision fit with the rate of technological change?
Information Technology and Organizational Performance
•
•
•
605
Are there issues around ownership when transferring people and assets?
Is a suitable vendor available?
Does the organization have the management capability to deliver on the
decision?
Will significant human resource issues arise – during the change process,
and subsequently for in-house and vendor staff ?
Outsourcing is defined as the commissioning of third party management of
IT assets/activities to required result. This does not exclude another way of
using the market, of course, namely ‘insourcing’ – where external resources
are utilized in an organization under in-house management. There is also an
option to have long or short term contracts with suppliers. In situations of high
business uncertainty and/or rapid technological change shorter term contract
are to be preferred. We also found, together with Lacity and Hirschheim
(1995), that selective rather than total outsourcing (80 per cent or more of IT
budget spent on outsourcing), tended to be the lower risk, and more successful
option to take.
In more detailed work, we found outsourcing requiring a considerable
cultural change on evaluation. Before outsourcing any IT, the more
successful organizations measured everything in a three to six month
baseline period. This enabled them to compare more accurately the in-house
performance against a vendor bid. It also prefigured the setting up of a
tighter evaluation regime with more detailed and accurate performance
measures and service level agreements. In cases where an in-house vendor
bid won, we found that the threat of the vendor bid actually galvanized the
in-house staff into identifying new ways of improving on IS/IT performance, and into maintaining the improvement through putting in place, and
acting on the output from, enhanced evaluation criteria and measures. This
brings us full circle. Even where an organization does not outsource IT, our
case evidence is that increasingly it is good practice to assess in-house
performance against what a potential vendor bid might be, even if, as is
increasingly the case, this means paying a vendor for the assessment. By the
same token, benchmarking IT/IS performance against external comparators
can also be highly useful, in providing insight not only into in-house IT/IS
performance, but also into the efficacy of internal evaluation criteria,
processes and the availability or otherwise of detailed, appropriate assessment information.
Conclusion
There are several ways out of the IT productivity paradox. Several of the more
critical relate to improved ways of planning for, managing and using IT/IS.
However, part of the IT productivity paradox has been configured out of
606
Strategic Information Management
difficulties and limitations in measuring and accounting for IT/IS performance. Bringing the so-called paradox into the more manageable and assessable
organizational realm, it is clear that there is still, as at 1996, much indifferent
IT/IS evaluation practice to be found in work organizations. In detailing an
integrated lifecycle approach to IT/IS evaluation we have utilized the research
findings of ourselves and others to suggest one way forward. The ‘cradle to
grave’ framework is holistic and dynamic and relies on a judicious mixture of
‘the business case’, appropriate criteria and metrics, managerial and
stakeholder judgement and processes, together with motivated evaluators.
Above all it signals a move from ‘control through numbers’ assessment
culture to one focused on quality improvement. This would seem to offer one
of the better routes out of the productivity paradox, not least in its ability to
link up evaluation to improving approaches to planning for, managing and
using IT. As such it may also serve to begin to demystify the ‘IT productivity
paradox’, and reveal that it is as much about human as technology issues – and
better cast anyway as the IT-management productivity paradox, perhaps?
References
Bakos, Y. and Jager, P. de (1995) Are computers boosting productivity?
Computerworld, 27 March, 128–130.
Ballantine, J., Galliers, R. D. and Stray, S. J. (1996) Information systems/
technology evaluation practices: evidence from UK organizations. Journal
of Information Technology , 11(2), 129–141.
Brynjolfsson, E. (1993) The productivity paradox of information technology.
Communications of the ACM, 36(12), 67–77.
Brynjolfsson, E. and Hitt, L. (1993) Is information systems spending
productive? Proceedings of the International Conference in Information
Systems, Orlando, December.
Cron, W. and Sobol, M. (1983) The relationship between computerization and
performance: a strategy for maximizing the economic benefits of
computerization. Journal of Information Management, 6, 171–181.
Currie, W. (1989) The art of justifying new technology to top management.
Omega, 17(5), 409–418.
Engardio, P. (1994) Third World leapfrog. Business Week, 13 June, 46–47.
Farbey, B., Land, F. and Targett, D. (1992) Evaluating investments in IT.
Journal of Information Technology, 7(2), 100–112.
Farbey, B., Targett, D. and Land, F. (eds) (1995) Hard Money, Soft Outcomes,
Alfred Waller/Unicom, Henley, UK.
Gillin, P. (ed.) (1994) The productivity payoff: the 100 most effective users of
information technology. Computerworld, 19 September, 4–55.
Hammer, M. and Champy, J. (1993) Reengineering The Corporation: A
Manifesto For Business Revolution, Nicholas Brealey, London.
Information Technology and Organizational Performance
607
Kaplan, R. and Norton, D. (1992) The balanced scorecard: measures that drive
performance. Harvard Business Review, January–February, 71–79.
Keen, P. (1991) Shaping the Future: Business Design Through Information
Technology, Harvard Business Press, Boston.
Kumar, K. (1990). Post-implementation evaluation of computer-based
information systems: current practices. Communications of the ACM, 33(2),
203–212.
Lacity, M. and Hirschheim, R. (1995) Beyond the Information Systems
Outsourcing Bandwagon, Wiley, Chichester.
Lacity, M. and Hirschheim, R. (1996) The role of benchmarking in demonstrating IS performance. In Investing in Information Systems: Evaluation and
Management (ed. L. Willcocks), Chapman and Hall, London.
Lacity, M. Willcocks, L. and Feeny, D. (1995) IT outsourcing: maximize
flexibility and control. Harvard Business Review, May–June, 84–93.
Loveman, G. (1988) An assessment of the productivity impact of information
technologies. MIT management in the nineties. Working Paper 88–054.
Massachussetts Institute of Technology, Cambridge.
Nievelt, M. van (1992) Managing with information technology – a decade of
wasted money? Compact, Summer, 15–24.
Norris, G. (1996) Post-investment appraisal. In Investing in Information
Systems: Evaluation and Management (ed. L. Willcocks), Chapman and
Hall, London.
Peters, G. (1996) From strategy to implementation: identifying and managing
benefits of IT investments. In Investing in Information Systems: Evaluation
and Management (ed. L. Willcocks), Chapman and Hall, London.
Price Waterhouse (1995) Information Technology Review 1994/5, Price
Waterhouse, London.
Roach, S. (1986) Macrorealities of the Information Economy, National
Academy of Sciences, New York.
Strassman, P. (1990) The Business Value of Computers, Information Economic
Press, New Canaan, CT.
Sullivan-Trainor, M. (1994) Best of breed. In The Productivity Payoff: The
100 Most Effective Users of Information Technology (ed. P. Gillin),
Computerworld, 19 September, 8–9.
Taylor, P. (1995) Business solutions on every side. Financial Times Review:
Information Technology, 1 March, 1.
Willcocks, L. (ed.) (1994) Information Management: Evaluation of Information Systems Investments, Chapman and Hall, London.
Willcocks, L. (ed.) (1996a) Investing in Information Systems: Evaluation and
Management, Chapman and Hall, London.
Willcocks, L. (1996b) Does IT-enabled BPR pay off? Recent findings on
economics and impacts. In Investing In Information Systems: Evaluation
and Management, Chapman and Hall, London.
608
Strategic Information Management
Willcocks, L. and Fitzgerald, G. (1994) A business guide to IT outsourcing.
Business Intelligence, London.
Willcocks, L. and Griffiths, C. (1994) Predicting risk of failure in large-scale
information technology projects. Technological Forecasting and Social
Change, 47(2), 205–228.
Willcocks, L. and Lester, S. (1996) The evaluation and management of
information systems investments: from feasibility to routine operations. In
(1996). Investing In Information Systems: Evaluation and Management (ed.
L. Willcocks), Chapman and Hall, London.
Willcocks, L., Currie, W. and Mason, D. (1996) Information Systems at Work:
People Politics and Technology, McGraw-Hill, Maidenhead, UK.
Reproduced from Willcocks, L. and Lester, S. (1996) Beyond the IT
productivity paradox. European Management Journal, 14(3), June, 279–290.
Reprinted by permission of Elsevier Science.
Questions for discussion
1
What is the IT productivity paradox? Does it actually exist in your view,
and if so, to what extent is it sectorally based? Do you believe it will
remain a problem in, say, 5 years’ time?
2 Why is the evaluation and management of IT investment ‘shot through
with difficulties’? And what’s wrong with the maxim ‘what gets measured
gets managed’?
3 Critically evaluate the IT/IS evaluation and management cycle introduced
in this chapter. How might it be adapted so as to be integrated in an
ongoing IS planning process?
4 Reflect on the question of the evolution and management of different types
of IT investments mentioned in this chapter, and the ‘stages of growth’
concept introduced in Chapter 2. How might evaluation and management
of IT evolve from one stage to another?
5 Managing benefits are highlighted as a critical success factor by the
authors. Reflect on the differing roles an IT steering committee, individual
executives and managers might take in dealing with stock-outs for
example.
6 The authors introduce the issue of sourcing IT services. Why might
outsourcing IT services require ‘a considerable cultural change on
evaluation’? Reflect on issues introduced in Chapter 16 when considering
this question.
Author index
Page numbers in bold refer to reference lists at the
end of chapters.
Abernathy, W.M., 478, 489
Ackerman, M.S., 549, 551
Ackoff, R.L., 38, 56, 61, 498, 520
Akerlof, G.A., 372
Alavi, M., 504, 505, 520
Allen, C.D., 131, 142
Amidon, D., 505, 524
Andersen, A., 207
Andersen Consulting, 233
Anderson, R.E., 141, 142
Andrews, K.R., 64, 85
Ang, J.S.K., 85
Ansoff, H.I., 64, 85, 430, 454
Anthes, G.H., 372
Anthony, R.N., 64, 85
Applegate, L., 300, 303, 503, 520
Argote, L., 528, 530, 546, 548, 551, 552
Argyris, C., 126, 142, 442, 454, 547, 551
Ash, N., 24, 26
Athos, A.G., 42, 62
Attewell, P., 527, 546, 551
Avison, D., 28, 30
Badri, M.A., 173, 177
Baets, W.R.J., 1, 2, 266, 303, 424, 425
Bair, J.H., 464, 473, 484, 493
Baker, F.T., 9, 21
Baker, M.R., 494
Bakos, J., 348, 372
Bakos, Y., 592, 606
Baldwin, L.P., 421
Baliga, B.R., 109
Ball, L., 152, 153, 177
Ballantine, J., 593, 606
Bancroft, N.H., 129, 142
Barclay, D.W., 303, 343
Barley, S.R., 534, 551, 553
Barney, J.B., 264
Baroudi, J., 69, 86
Barrett, S., 102
Barrett, W., 550, 551
Barsade, S.G., 514, 515, 520
Bartlett, C.A., 92, 99, 109, 444, 454
Basche, J., 109
Bashein, B.J., 122, 132, 142
Bassellier, G., 305
Beard, D.W., 315, 342
Beardsley, S., 455
Beath, C.M., 120, 130, 133, 136, 142, 232, 306
Beckman, S., 548, 551
Beers, M., 585
Begun, J.W., 492
Benbasat, I., xi, xiv, 28, 30, 35, 38, 61, 267, 268,
273, 305, 472, 489, 502, 524
Benjamin, R.I., 2, 111, 113, 136, 142, 144, 263,
348, 374, 498, 523
Bennis, W., 579, 585
Benson, R.J., 86, 258
Berger, P., 268, 303, 527, 528, 531, 551
Bergeron, F., 316, 342
Bertalanfy, L. von, 430, 454
Bettis, R.A., 432, 454
Bhabuta, L., 33, 38, 41, 61
Bjorn-Andersen, N., 127, 143
Blalock, H.M., Jr., 485, 489
Blau, P.M., 473, 489
Bleeke, J., 433, 455
Block, P., 123, 133, 142
Bloor, D., 527, 532, 551
Blumenthal, S.C., 72, 85
Boddy, D., 131, 136, 137, 142
Bonoma, T.V., 420
Borys, B., 488, 489
Bourdieu, P., 531, 551
Bourgeois, L.J., III, 473, 489
Bowers, J.L., 200, 207
Bowman, B., 199, 200, 207
Boynton, A.C., 182, 204, 207, 267, 270, 272, 303,
346
Bradley, S.P., 454
Brancheau, J.C., 152, 153, 154, 177, 178, 179, 206,
207, 209, 266, 303, 305
Brebach, G., 440, 456
British Computer Society, 44, 61
Broadbent, M., 267, 303, 315, 342
Brooks, F.R., Jr., 8, 21
Brown, C.V., 312, 315, 316, 341, 343, 505, 522
Brown, J.S., 504, 506, 520, 530, 551
Brown, R., 272, 303
Brown, S.L., 315, 343
Brynjolfsson, E., 348, 372, 591, 592, 593, 606
610
Author index
Buchanan, D., 131, 136, 137, 142
Buckingham, R.A., 29, 30
Bullen, C.V., 206, 208
Burack, E.H., 451, 454, 510, 520
Burgelman, R.A., 443, 454, 466, 489
Burky, L.B., 271, 305
Burn, J., 152, 159, 177
Burns, T., 315, 343, 436, 454
Buss, M., 109
Buteau, C., 342
Butler, B., 374
Butler Cox Foundation, 241, 249, 257, 440, 455
Cafasso, R., 23, 26
Camillus, J.C., 315, 343
Carey, D., 152, 178
Carley, K., 546, 548, 551
Carlson, E.D., 13, 22, 501, 524
Carlson, W.M., 233
Carlsson, S., 518, 520
Carlyle, R.E., 109
Carrico, S.R., 110
Carter, E.E., 483, 490
Carter, N.M., 473, 490, 500, 520
Case, D., 469, 493
Cash, J.I., 1, 2, 38, 40, 61, 262, 263
Castells, M., 424, 425
Chabrow, E., 560, 585
Champy, J., 373, 592, 606
Chan, Y.E., 65, 85, 266, 267, 270, 303, 305, 312,
313, 315, 340, 343
Chandler, A.D., 109, 430, 455, 488, 490
Charan, R., 437, 455
Chase, R.B., 557, 585
Chatman, J.A., 511, 513, 514, 515, 520
Chen, H., 179
Cheney, P., 374
Chepaitis, E.V., 165, 169, 178
Cheung, H.K., 177
Child, J., 463, 473, 476, 490, 585
Cialdini, R.B., 533, 551
Ciborra, C.U., xiv, 28, 30
Clark, K.B., 271, 303, 455
Clark, S.L., 413, 420
Clark, T., 374
Clarke, R., 372
Clemons, E.K., 232, 262, 263, 348, 372–3
Coase, R.H., 371, 373
Codd, E.F., 10–11, 21
Cohen, K.J., 373
Cohen, M.D., 474, 490
Cohen, W.M., 272, 303
Coleman, H.J., Jr., 344, 458
Coleman, T., 249, 257
Collins, H.M., 530, 551
Collins, R., 533, 551
Colvin, J.G., 458
Compeau, D., 120, 142
Connolly, T., 132, 143
Conrath, D.W., 82, 85
Constantine, L.L., 498, 524
Cooprider, J.G., 266, 268, 269, 270, 271, 272, 305,
306
Copeland, D.G., 262, 263, 303, 343
Cortese, A., 503, 520
Courtney, J., 498, 520
Cox, J.F., 413, 420
Craig, J.F., 306
Crane, D.B., 109
Crawford, A.B., Jr., 484, 490
Cron, W., 593, 606
Crosdell, D., 520
CSC Index, 152, 153, 178
Culnan, M.J., 461, 464, 465, 468, 470, 483, 488,
490
Cummings, T.G., 29, 30, 115, 125, 141, 142
Currie, W.I., 30, 590, 606, 608
Cuyvers, L., 233
Daft, R.L., 461, 467, 469, 490, 494, 519, 521, 530,
551
Dane, F.C., 420
Danziger, J.N., 200, 208
Darr, E.D., 548, 552
Das, S.R., 266, 304, 343
Davenport, T.H., 29, 30, 133, 136, 142, 373, 440,
455, 505, 521, 579, 580, 585
Davidson, E.J., 129, 143
Davis, G.B., 179, 207, 233, 266, 304
Dawson, P., 473, 490, 500, 521
de Geus, A.P., 200, 208, 443, 455
Dean, J.W., 133, 143, 436, 455
Deans, P.C., 152, 178
Dekeleva, S., 173, 178
Delery, J.D., 312, 343
Delone, W.H., 509, 521
DeLong, D., 498, 523
Denison, D., 511, 521
Deppe, S.M., 579, 580, 586
Dess, G.G., 315, 342
Devadas, R., 528, 530, 548, 552
Dexter, A., 30, 61, 173, 178
Dickson, G.W., 152, 153, 178, 206, 208
Doty, H., 312, 343
Dougherty, D., 266, 272, 304
Doz, Y.L., 109, 111, 455
Drazin, R., 312, 345
Droge, C., 473, 492
Drucker, P.F., 435, 436, 455, 477, 490
Drury, D., 30, 61
Duguid, P., 504, 506, 520, 530, 551
Dumaine, B., 440, 455
Duncan, R.B., 470, 474, 490–1
Dutton, W., 473, 491
Earl, M.J., xi, xiv, 28, 30, 33, 35, 36–8, 40, 41, 61,
62, 66, 70, 71, 72, 83, 85, 122, 143, 147, 149,
182, 199, 207, 208, 245–6, 257, 269, 304,
305, 344, 447, 455
Earley, P.C., 515, 521
Eccles, R., 109, 142
Edwards, B., 40, 52, 61, 72, 85, 264
Ein-Dor, P., 169, 175, 178, 315, 343
Eisenhardt, K.M., 315, 321, 343
El Sawy, O.A., 579, 585
Elam, J.J., 424, 426, 502, 520, 523
Elderidge, N., 313, 343
Author index 611
Elliott, D., 502, 521
Elliott, S., 263, 264
Emerson, H., 429, 455
Engardio, P., 595, 606
Engelhoff, W., 109
Epple, D., 528, 530, 548, 551, 552
Ernst and Young, 241, 257
Ernst, D., 433, 455
Evans, B., 556, 586
Ezingeard, J.-N., 420, 421
Fagundes, J., 178
Falbe, C.M., 489
Farbey, B., 149, 246, 257, 421, 589, 590, 606
Farrell, C., 111
Farwell, D., 125, 136, 143, 145
Fayol, H., 474, 491
Feeny, D.F., 30, 31, 61, 62, 72, 85, 122, 143, 262,
263–4, 269, 304, 344, 607
Feldman, M., 463, 471, 491
Fiedler, K., 312, 340, 343, 424, 425
Fieldler, J., 421
Fiol, M.C., 528, 546, 552
Fitzgerald, E.P., 66, 73, 85
Fitzgerald, G., 28, 30, 603, 608
Fjeldstad, O., 111
Flores, F., 531, 553
Flynn, D.M., 469, 473, 491, 500, 521
Foster, L.W., 469, 473, 491, 500, 521
Franz, C., 501, 521
Frenke, K.A., 110
Friedman, A.L., 118, 120, 124, 143
Friend, D., 502, 521
Friesen, B., 442, 443, 457
Fuerst, W.L., 264
Fujimoto, T., 271, 303
Fulk, J., 461, 465, 470, 473, 491, 494
Galbraith, J.R., 275, 304
Gallant, A.R., 494
Galliers, R.D., xi, xiv, 1, 2, 5, 21, 28, 30, 33, 36, 43,
48, 53, 57, 60, 61–2, 63, 66, 85, 148, 149, 173,
178, 185, 207, 208, 266, 276, 304, 313, 343,
421, 424, 425, 446, 447, 453, 455, 500, 524
Gallupe, B.R., 145
Garvin, D., 442, 455, 557, 585
Gash, D.C., 120, 144
Geertz, C., 531, 552
Gersick, C.J.G., 312, 318, 337, 339, 343
Gerwin, D., 466, 483, 491
Ghoshal, S., 99, 109, 110, 444, 454
Gibbons, M., 424, 425
Gibson, C.F., 461, 463, 491
Gibson, D., 33, 34, 62
Gibson, R., 28, 30
Gillin, P., 592, 594, 606
Gilmore, T., 452, 456
Ginzberg, M.J., 519, 524
Glaser, B.G., 207, 208
Gluck, F.W., 38, 62
Goes, J.B., 475, 492
Goldman, A.I., 532, 552
Goldstein, R., 30, 61
Goodhue, D.L., 110, 200, 207, 208
Goodman, S.E., 165, 178, 179
Goslar, M.D., 178
Gotterbarn, D., 142
Gould, S., 313, 343
Graeser, V., 149
Grant, R.M., 504, 505, 521
Greenwood, R., 318, 344
Greiner, L.E., 28, 30, 38, 62
Gresov, C., 316–18, 338, 339, 344
Grieve, R.J., 421
Griffin, J., 436, 455
Griffiths, C., 242, 257, 589, 608
Griffiths, P., 28, 31, 63, 87, 147, 149, 458
Grindley, K., 149, 240, 257
Groppa, R., 484, 492
Grosch, H.R.J., 6, 21
Grover, V., 149, 343, 425
Gruber, W.H., 181, 188, 210
Gudykunst, W.B., 514, 515, 521–2
Gunton, T., 28, 30
Gurbaxani, V., 348, 373
Gurvitch, G., 527, 528, 552
Hackathorn, R.D., 200, 208
Hacking, I., 532, 533, 552
Haeckel, S., 555, 586
Hakim, C., 421
Hall, E.T., 515, 522
Hamel, G., 302, 305, 433, 454, 455
Hamilton, S., 33, 62
Hammer, M., 134, 143, 373, 440, 455, 592, 606
Hansen, J.V., 110
Hanssen-Bauer, J., 506, 522
Hardaker, M., 149
Harrigan, K.R., 110
Harris, M., 531, 552
Harris, R., 152, 153, 177
Harris, S., 410, 421
Harrison, D.A., 421
Hartog, C., 153, 206, 208
Hassan, S.Z., 178
Haveman, H.A., 338, 344
Hayes, C., 373
Hayes, R.H., 442, 443, 450, 455
Headland, T.N., 531, 552
Heald, K., 421
Hedberg, B., 442, 455, 546, 549, 552
Heidegger, M., 550, 552
Henderson, B.D., 430, 456
Henderson, J.C., 65, 66–7, 71, 73, 84, 85, 143,
182, 200, 207, 208, 266, 276, 304, 306, 312,
314, 344
Hendricks, J.A., 149
Henke, J.W., 456
Henkoff, R., 452, 456, 555, 557, 586
Herbert, M., 178, 206, 208
Hess, C.M., 348, 373
Heygate, R., 440, 456
Heyman, S., 521
Hides, M.T., 421
Higgins, C., 502, 524
Hill, N.C., 110
Hiltz, S.R., 468, 472, 477, 482, 491, 492
612
Author index
Hinings, C.R., 318, 344
Hirschheim, R.A., 28, 30, 33, 38–41, 52, 62, 122,
143, 313, 344, 498, 523, 590, 603, 605, 607
Hirschhorn, L., 452, 456
Hitt, L., 591, 592, 606
Hochstrasser, B., 242, 257
Hodgson, G.M., 371, 373
Hofer, C.W., 463, 491
Hoffer, J.A., 156, 179
Hofstede, G., 510, 512, 514, 515, 522
Hogue, J.T., 501, 522
Holland, C., 1, 2, 263, 264
Holland Systems Corporation, 233
Holub, A., 503, 522
Holzner, B., 526, 527, 528, 532, 534, 552
Hopstaken, B.A.A., 70, 85
Horovitz, J., 266, 304
Hosoda, M., 233
Houdeshel, G., 498, 522
Huber, G., 110, 470, 473, 477, 478, 488, 491, 502,
504, 519, 522, 527, 530, 539, 552
Huberman, A.M., 281, 305
Huff, F.P., 179
Huff, S.L., 65, 85, 303, 343
Huse, E.F., 29, 30, 115, 125, 141, 142
Hyde, A., 421
Iacono, C.S., 136, 143
IBM Corporation, 209, 233
Igbaria, M., 162, 178
Inmon, W.H., 200, 209
Iramon, W.H., 110
Irani, Z., 420, 421
Islei, G., 31
Ives, B., 33, 62, 232, 262, 263–4, 306, 312, 341,
344, 374, 498, 522
Jackson, B.B., 461, 463, 491
Jacobs, G.C., 303, 346
Jaeger, A.M., 109
Jager, P. de, 592, 606
Jaikumar, R., 450, 455
Jamieson, M., 249, 257
Jang, S.Y., 269, 276, 304
Janson, M.A., 178
Janssens, G.K., 233
Janz, B., 153, 178, 303
Jarvenpaa, S.L., 312, 341, 344, 374, 585
Jehn, K., 511, 513, 520
Jelinek, M., 315, 344, 345
Jemison, D., 488, 489
Jenkins, M., 372
Jewell, L.N., 470, 491
Jick, T.D., 30, 143, 421
Johansen, R., 461, 468, 469, 472, 479, 491
Johnson, D.G., 142
Johnson, G., 72, 85, 449, 456, 510, 522
Johnson, R., 433, 456
Johnston, H.R., 110
Johnston, K.D., 306
Johnston, R., 373
Jonsson, S., 442, 455
Junnarkar, B., 505, 522
Kador, J., 502, 503, 522
Kahneman, D., 478, 492
Kalakota, R., 582, 586
Kambil, A., 373
Kanter, R.M., 29, 30, 115, 130, 143
Kaplan, R.B., 440, 456, 599, 607
Kaplan, R.S., 412, 421
Karawan, K.R., 178
Karimi, J., 110, 200, 204, 208, 209
Kasper, G., 374
Katz, M.L., 374
Katzenbach, J.R., 435, 456
Kaufman, S.P., 62
Kavan, B., 586
Kearney, A.T., 240, 257
Kearns, G.S., 266, 304
Keen, P.G.W., 13, 21, 110, 133, 143, 501, 522, 590,
599, 607
Keil, M., 114, 120, 128, 135, 143, 302, 304
Keisler, S., 464, 468, 469, 484, 494
Kelley, G., 466, 492
Kelly, K., 421
Kemerer, C.F., 348, 373
Kerlinger, F.N., 485, 492
Kerner, D.V., 233
Kerr, E.B., 472, 492
Khalifa, G., 421
Kidd, J.S., 478, 492
King, J., 28, 30, 35, 62, 110
King, W., 65, 67, 71, 73, 82, 85, 86, 110, 185, 199,
203, 206, 207, 209, 232, 233, 266, 304, 313,
316, 344, 345, 498, 522
Kirkbride, L., 579, 580, 586
Kirs, P., 312, 313, 341, 345
Kirsch, L.J., 208
Kiudorf, E., 178
Klatzky, S.R., 500, 522
Kleijne, D., 86
Klein, H.K., 268, 304
Knight, K., 110
Knorr-Cetina, K.D., 532, 552
Knutson, T.J., 470, 492
Kochan, T.A., 424, 425, 442, 456
Koeblitz, R., 521
Kokuryo, J., 111, 374
Konsynski, B.R., 38, 40, 61, 109, 110, 111, 262,
263, 276, 305, 472, 489
Kotler, P., 439, 456
Kottermann, J.E., 276, 305
Kowitz, A.C., 470, 492
Kozar, K.A., 502, 523
Krachenberg, A.R., 436, 456
Kraemer, K., 28, 30, 35, 62, 266, 306
Kranendonk, A., 70, 85
Kugel, R., 455
Kumar, K., 602, 607
Kuramoto, L., 143
Kurland, M.A., 493
Kwon, T.H., 28, 30
La Rovere, R.L., 164, 178
Laast-Laas, J., 178
Lacity, M.C., 28, 30, 31, 122, 143, 590, 603, 605,
607