Fourtoutici Enterprise Marketing Management_9 pptx
Bạn đang xem bản rút gọn của tài liệu. Xem và tải ngay bản đầy đủ của tài liệu tại đây (405.81 KB, 25 trang )
based on sound strategy and statistics, not hunches or tradition—
and by any measure, that’s a positive change.
CASE STUDY: Harrah’s Casinos
MARKETING INVESTMENT STRATEGY YIELDS A
PRODUCTIVE, PROFITABLE BRAND EXPERIENCE
There is no industry more dedicated to the power of marketing
investment management than casino gaming. Gamblers are creatures
of habit, and no gaming corporation has done a better job of tracking,
analyzing, and capitalizing on those habits than Harrah’s. At its 25 casi-
nos around the country, Harrah’s learns everything possible about its
customers, and then presents specifically targeted offers to them
based on their value to the corporation, their responsiveness, and
their willingness to spend.
At a central processing office in Memphis, Harrah’s compiles an
incredibly detailed record of every movement and every bet of every
valued customer in all of its casinos. Harrah’s can monitor the num-
ber of machines the customer plays, the number of wagers made, the
average size of bets, and the total money deposited in machines
(called the coin-in). Before a customer has even arrived home from a
visit to a casino, Harrah’s has compiled enough information on them
to build a detailed profile of their gaming habits, a plan for enticing
them back to the casino, and even an individual profit-and-loss pro-
jection that will aid in future marketing investment in the customer.
Harrah’s tracks customer information by using a plastic loyalty
card that valued customers slide into slot machines and card tables
while they play.The benefit for the company is obvious; the informa-
tion gathered on the customer is invaluable and is used to refine its
database, now segmented into 90 behavior-driven demographic tar-
gets. Each segment receives its own custom-tailored direct-mail
incentives.
For their part, customers can earn platinum or diamond status
based on their gambling levels.They can visit www.harrahs.com to find
their point levels and learn more about benefits. Based on which cus-
tomers choose which benefit packages, Harrah’s can continue to
refine and improve its marketing investment.
184 ENTERPRISE MARKETING MANAGEMENT
TEAMFLY
Team-Fly
®
Conventional wisdom would hold that the slots players, playing
only a quarter or a dollar at a time, are Harrah’s least valuable cus-
tomers. And conventional wisdom would be dead wrong. Slots and
other electronic gaming machines account for the majority of Har-
rah’s $3.7 billion in annual revenue and constitute more than 80 per-
cent of the company’s operating profit. Because it has tracked and
retained its slots players, Harrah’s has grown to be the second-largest
gaming company in the United States, behind only MGM Entertain-
ment. Harrah’s also boasts the highest three-year investment return
in the industry. In just the first two years of its Total Rewards program,
Harrah’s saw a $100 million increase in revenue from customers who
gambled at more than one Harrah’s casino.
So how does Harrah’s track its 25 million customers? With a
combination of technology and strategic analysis.The company begins
with four key pieces of information—gender, age, area of residence,
and games played—and uses that information to offer early predic-
tions of which customers will become the biggest spenders.The com-
pany designs appropriate marketing strategies to lure customers
back. The goal is not a product-based one—say, designing games to
reach particular revenue levels—but rather a customer-based one,
working to maximize revenue from individual customers, regardless
of which games they play.
Each of the demographic factors demands its own series of incen-
tives. Out-of-town customers typically receive discounts on hotel
rooms or transportation, while local customers receive cash, food,
and entertainment incentives. Early expiration dates encourage cus-
tomers to return quickly or switch from competitors. Harrah’s tracks
each incentive based on response rates and return on investment,and
adjusts future incentives accordingly.
Analysis of customer data found that the 30 percent of Harrah’s
customers who spent between $100 and $500 per visit accounted for
80 percent of company revenues and almost 100 percent of profits.
Those gamblers were typically local residents, who visited their
nearby Harrah’s frequently.
With this data in hand, Harrah’s marketing teams developed a
profile of the ideal Harrah’s customer. As it turns out, the ideal gam-
bler is a 62-year-old woman who lives within 30 minutes of a casino
and plays dollar video poker.These ladies typically have substantial dis-
posable cash, plenty of time on their hands, and easy access to a Har-
rah’s regional casino.
MEASURE INVESTMENT PERFORMANCE 185
Harrah’s has made an intensive, extensive marketing investment,
and it’s now beginning to pay off. The lesson for other companies is
clear—learn who your best customers are, or you’re liable to lose
them.
MARKETER’S SCIENTIFIC METHOD:
ACTIVITY-BASED MARKETING (ABM)
By applying activity-based costing theory to marketing, you can
establish a rigorous process for evaluating which marketing activi-
ties create value. In turn, you can use this information to develop a
robust, fact-based decision-making process for how marketing
investments are made. The overall objective of this activity-based
marketing (ABM) analysis is to maximize the return on marketing
investment (ROMI) that an enterprise can achieve. ABM includes
tools for measuring and analyzing ROMI, and it represents a struc-
tured methodology to perform the following:
~ Apply scientific discipline to maximize the return on
every marketing dollar spent across the enterprise
~ Optimize the performance of each marketing channel
and the portfolio of channels overall (i.e., which chan-
nels perform better than others? Where should we invest
labor and dollars?)
~ Model what-if investment scenarios
~ Forecast the number of leads needed per month, per
channel to achieve revenue objectives
~ Provide a common language and fact base for the mar-
keting and executive teams to make informed decisions
When appropriately implemented, ABM delivers substantial
benefits to an enterprise:
~ Laying out a road map to success for each business unit
across an enterprise, based upon the expected effective-
ness and efficiency of each marketing activity, initiative
and/or campaign, and so on
~ Identifying risks and critical success factors to hit per-
formance targets
186 ENTERPRISE MARKETING MANAGEMENT
~ Providing visibility into the number of leads required at
each stage of the sales process in order to achieve finan-
cial objectives—giving the management team sufficient
time to take corrective action
~ Aligning enterprise marketing and customer strategies
with operational investments (i.e., people, process, and
technology)
The power of ABM comes from the insights your management
team gains as a result of conducting the analysis, asking the right
questions, and gaining a new understanding of your business.
ROMI tools alone do not provide the answers; rather, they provide
data on performance and a framework for asking pointed questions.
Of course, as discussed in this chapter, organizational involvement
and buy-in of the analysis is critical.
Your goal should be to conduct the ABM analysis with the appro-
priate level of rigor to provide “good enough” data for understanding
performance, identifying opportunities, and modeling the future.
Above all, avoid analysis paralysis—don’t spend so much time look-
ing at your plans that you don’t have time to implement them.
Step 1: Understand Past Performance
The first step requires an intimate understanding of where you are
in your business and where you have been. This begins with identi-
fying all marketing activities that you perform to reach your target
customers. It is important to break down your activities in sufficient
detail to ensure that you can reveal and measure the things that
really help generate value for customers and for your business. For
example, if you think one of your key activities is driving brand
preference, you may want to consider breaking this down into sev-
eral more detailed activities that you believe help drive preference
for your brand. You may publish a newsletter, maintain a web site,
or conduct seminars, each of which drives preference for your
brand. So instead of having an activity called “drive brand prefer-
ence,” you may have several activities in which you invest, such as
“publish newsletter” or “maintain web site.” Give marketing activ-
ities clear names and develop consistent descriptions; otherwise, it
will be difficult to track revenues and costs associated with each
activity and the value of the analysis will be compromised.
MEASURE INVESTMENT PERFORMANCE 187
Next, try to attribute customer revenue to each activity. This
will allow you to compute average, maximum, minimum, and stan-
dard deviation of deal sizes by activity and begin to identify oppor-
tunities. To start with, keep it simple. Try to tie the source of
customer leads to specific activities. At this stage you should also
allocate marketing labor costs and discretionary costs to each activ-
ity. Once this has been completed, you should begin to get a clearer
understanding of which marketing activities actually generate the
highest return and drive your business. Table 9.3 shows a sample
scorecard that results from Step 1.
Step 2: Model the Future and Perform What-If Analysis
The next step is to model the future performance of your business
and determine how to optimize investments. There are two differ-
ent approaches. Top-down analysis is used to determine how to opti-
188 ENTERPRISE MARKETING MANAGEMENT
Table 9.3 Sample Scorecard
Avg. Deal Activity % of # of
ID Activity Revenue Size Revenue Leads
1 Activity 1 $ 100,000 $ 100,000 2% 6
2 Activity 2 $ 150,000 $ 75,000 3% 4
3 Activity 3 $ 600,000 $ 300,000 10% 6
4 Activity 4 $ 500,000 $ 250,000 8% 3
5 Activity 5 $ 500,000 $ 250,000 8% 10
6 Activity 6 $ 3,400,000 $ 309,000 57% 25
7 Activity 7 $ 600,000 $ 150,000 10% 20
8 Activity 8 $ — $ — 0% 30
9 Activity 9 $ 100,000 $ 50,000 2% 16
10 Activity 10 $ — $ — 0% —
11 Activity 11 $ — $ — 0% —
12 Activity 12 $ — $ — 0% —
13 Activity 13 $ — $ — 0% —
14 Activity 14 $ — $ — 0% —
15 Activity 15 $ — $ — 0% —
16 Activity 16 $ — $ — 0% —
TOTAL $ 5,950,000 100% 120
MEASURE INVESTMENT PERFORMANCE 189
Table 9.3 (Continued)
# of % of Total Activity Cost Per Cost per Activity
Wins Deals Cost Lead (4) Win COS/Rev
1 4% $ 22,500 $ 3,750 $ 22,500 23%
2 7% $ 19,000 $ 4,750 $ 9,500 13%
2 7% $ — $ — $ no cost 0%
2 7% $ 4,000 $ 1,333 $ 2,000 1%
2 7% $ 3,000 $ 300 $ 1,500 1%
11 7% $ 50,613 $ 2,025 $ 4,601 1%
4 41% $ 339,338 $ 16,967 $ 54,834 57%
1 15% $ 90,344 $ 3,011 $ 90,344 no rev
2 4% $ 153,878 $ 9,617 $ 76,989 154%
0 7% $ 17,003 no qual. leads no wins no rev
0 0% $ 10,266 no qual. leads no wins no rev
0 0% $ 407,941 no qual. leads no wins no rev
0 0% $ 22,000 no qual. leads no wins no rev
0 0% $ — no qual. leads no wins no rev
0 0% $ — no qual. leads no wins no rev
0 0% $ — no qual. leads no wins no rev
27 100% $ 1,139,861 $ 9,499 $ 42,218 19%
mize your activities to hit a specific revenue target. The revenue
target is fixed and the analysis focuses on optimizing the levers that
drive total revenue and provides insight into marketing investment
and hiring requirements. Bottom-up analysis is performed to deter-
mine the maximum revenue that can be attained by optimizing rev-
enue drivers. Revenue is the dependent variable. This form of
what-if analysis provides insight into the following:
~ How total revenue will be affected if we increase the
probability of closing (e.g., enhance training or resource
investment)
~ What type of return we will get if we invest more in this
marketing activity (e.g., invest in labor or promotions to
increase the number of leads)
~ What type of return we get if we increase the average
deal size
Step 3: Forecast Monthly Lead Requirements
The final step of the ABM analysis is to forecast the number of new
customer leads that are required per month, per sales process
stage, to hit revenue targets. Modeling revenue distribution by
quarter, average deal size, probability of conversion, cycle time, and
cash flow recognition, the enterprise begins to get a clear picture of
current performance and progress against business objectives.
Using this lead forecasting approach, an enterprise will know well
in advance whether marketing has insufficient leads in the pipeline
to meet revenue targets. The obvious benefit is that with increased
visibility, the management team will have additional time to course
correct marketing initiatives, realign marketing investments, and
get back on track to meeting targets.
190 ENTERPRISE MARKETING MANAGEMENT
10
OPTIMIZE MARKETING
INVESTMENTS TO DRIVE
PROFITABLE SALES
E
very day, every marketer faces the critical decision of deter-
mining where to make marketing investments or—thinking
more broadly—where to position marketing assets in order
to drive profitable sales. Even if you’ve successfully developed a
brand architecture that describes that combination of emotional
and functional benefits that drive purchase intent for your brand,
translated these benefits across the entire brand experience, and
thus developed a brand experience blueprint, you’re still not done.
You still have to think about where to invest your marketing funds
to drive sales.
The brand experience blueprint is just that—a blueprint of all
of the potential customer interactions, ideally across both the cur-
rent elements of the marketing mix, and all of the customer touch
points. However, it doesn’t tell you where you need to be investing
your marketing dollars. It doesn’t provide you with the creative
spark that might be the basis of a market-based experiment. So
even after applying a significant measure of science to your mar-
keting efforts, there’s still plenty of room to let your hair down and
get creative.
The brand experience blueprint represents the marketer’s lab-
oratory and stands as the compendium of all your opportunities to
191
192 ENTERPRISE MARKETING MANAGEMENT
communicate and engage your customers. This is where the exper-
imentation can really begin, at least as it relates to identifying those
tactics that might drive sales. By thinking horizontally, or even
holistically, across the entire brand experience, the scientific mar-
keter can identify those areas where marketing investment and
experimentation make sense. The bottom line is that marketing
has to invest in those campaigns and initiatives that drive sales. If
an idea doesn’t, then it’s not worth your money.
This theory goes back to the premise of EMM. Part of bringing
a scientific approach to how you invest in marketing is realizing
that you will make mistakes. Too many marketers try to avoid even
the possibility of making a mistake, tending to their sacred cows
and staying on the safe, predictable path.
This isn’t to say that safe and predictable decisions are neces-
sarily good ones. On the contrary, these terrible decisions are all too
acceptable. Outsourcing strategy to an advertising agency, continu-
ing to support investment in marketing events, or paying for spon-
sorships that have no relationship to sales whatsoever are three
examples of investments that conventional wisdom believes are
safe—and real marketers believe are often heedlessly wasteful.
Marketers must bring an analytical approach, yes, but also a
desire to apply the scientific method to what marketing does in an
effort to continually increase knowledge of what drives sales and
what doesn’t. Unlike the traditional sciences, marketing is inti-
mately connected to the enormously dynamic business market-
place. This means that what you learned last year might not be true
next year. And this constant change makes the science of marketing
terrifically exciting—as long as you’re willing to adhere to the rig-
orous discipline required to learn what actually works and what
doesn’t.
For example, can the marketers in your company detail which
investments pay out and which ones don’t? Or, if that’s not yet fea-
sible, can they rank-order marketing mix investments to indicate
which ones seem to perform better than others? At an even more
elementary level, is there a simple record of investments and sales
results?
Part of bringing a scientific discipline to marketing investing
means applying the discipline from start to finish, not just waking
up one day and deciding to apply ROI metrics to what’s already
been done. When you make a marketing investment, do you ask
your marketing managers to create a financial profile of their pro-
posed investment, indicating specifically where they expect to
make cash outflows and also expect to see sales inflows? Think of it
this way: This is exactly the sort of information you would demand
if you were talking to your broker about where to invest your hard-
earned money, regardless of risk. Why does your company deserve
any less?
In making the decisions about where to invest marketing dol-
lars, the marketer can use the brand experience blueprint as his or
her portfolio, because it adequately lays out all of the current cus-
tomer interactions in such a way as to communicate the brand’s
benefits. What levers should we pull for activating the brand?
Where should we invest marketing dollars, either in marketing mix
elements or in altering some current aspect of interaction across a
customer touch point? Should we allow differentiation of offerings
based on geography or targeted segment? All of these questions
form part of the research and investigation that makes up the mar-
keter’s job. Granted, it’s impossible for you to simply read a book
and learn exactly where to make your marketing investments to
drive the sales of your company. But you can learn the proper steps
to follow and how to think through your approach to make the most
of your marketing investments.
Generally speaking, every marketer should follow the same
approach to making marketing investments, regardless of whether
the investment is for launching a new product or for continuing to
push your current offerings. This approach is relevant for every
potential change or investment in the brand experience blueprint.
Whether you’re spending money to purchase advertising produc-
tion and media, to create a more compelling customer extranet, or
to ensure that your sales force communicates brand benefits, this
approach works.
To drive profitable sales using EMM, marketers must take cer-
tain steps before even thinking of spending that first dollar:
1. Ensure alignment with the strategy that the marketing
investment supports.
2. Identify where in the brand experience blueprint to
make your marketing investment(s):
OPTIMIZE MARKETING INVESTMENTS 193
a. Create the marketing investment program—marketing
mix element or customer touch point.
b. Develop a profile of the investment and the return on the
marketing investment.
c. Develop the nonfinancial metrics that are likely leading
indicators of marketing return.
3. Implement the process or system that will let you evalu-
ate the progress of your many investments, even before
they’re complete (prepare yourself to answer the ques-
tion “Are we selling more?”).
While it may be tempting to jump right in and make invest-
ment after marketing investment, that approach would abandon
the heart of EMM’s principles. A critical part of any investment is
planning for what will happen, but equally as important is the
necessity to measure what’s happening and learn from it. What
good is a winning marketing initiative that you’re not able to
repeat?
The appeal of this approach is that with every investment, you
have the opportunity to get smarter, on individual, brand, and cor-
porate levels. If the business model isn’t in place to make this possi-
ble, then your marketing investment in learning is going to waste.
You might hit a few home runs, but the loss of one key player will
land you back in the cellar. Keep this in mind—learn from every-
thing you do as a marketer. Everything.
ENSURE ALIGNMENT WITH
THE BRAND ARCHITECTURE
Before even thinking about where to put your marketing invest-
ments, it’s critical that you align potential marketing efforts with
your brand architecture. While the emotional and functional bene-
fits of your brand have presumably been incorporated into your
brand experience blueprint, it’s critical to make sure that every
potential marketing program is synchronized and aligned with that
same brand architecture.
While this may be as simple as reviewing your brand architec-
ture before moving to the next step, many brands have to struggle
194 ENTERPRISE MARKETING MANAGEMENT
TEAMFLY
Team-Fly
®
with far more complex questions, like, say, How much does my
brand vary from France to Japan? Which of my brand benefits are
inviolable, and which ones are subject to interpretation?
The question that many marketers struggle with is how to
make a particular brand architecture work in a local market. For
example, given Pepto-Bismol’s popularity in the Hispanic commu-
nity, how should the brand architecture be applied differently in
Latino markets as opposed to the broader U.S. market? Or if you’re
grappling with the age-old global versus local conundrum, how can
the global brand manager ensure that a brand’s positioning is
applied consistently around the world, while giving the local mar-
keters the leeway to make the brand’s benefits relevant?
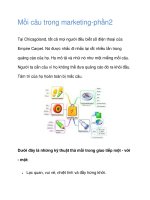
Figure 10.1 highlights the process trade-offs that any marketer
must make when addressing such a challenge. The bottom line is
that there are inevitably core elements of the brand architecture or
core marketing processes as well as potentially regional/shared and
localized elements. The placement of the dividing line must be
driven by the inevitable investment trade-offs as determined by
their ability to drive incremental sales. To answer our own question,
the Pepto-Bismol brand architecture is the brand architecture. The
leeway in interpretation will be driven by the specific return from
investing in Latino-specific marketing.
OPTIMIZE MARKETING INVESTMENTS 195
Marketing Recruiting & Training
Customer Service
Global Brand Strategy & Positioning & Trademark Compliance
Corporate Sponsorships & Marketing Alliances
Product Development
Sales
Research
Pricing
Promotions
Advertising
Sales
Research
Pricing
Promotions
Advertising
Sales
Research
Pricing
Promotions
Advertising
Sales
Research
Pricing
Sales
Research
Pricing
Promotions
Advertising
JAPAN CANADA U.S.A FRANCE GERMANY
Highly De-
centralized
Highly
Centralized
Geographic
Unit or
Local
Processes
Shared
Processes
Corporate
or Global
Processes
FIGURE 10.1 Positioning Brand Assets to
Drive Profitable Sales
USE THE BRAND EXPERIENCE BLUEPRINT TO
GUIDE YOUR MARKETING INVESTMENTS
Given all of the requirements of building a brand experience, it can
seem daunting to determine how to best use marketing assets. In
this instance, assets could include your time, your dollars, your
brands, your sales force, your customer service reps—just about
anything that you can leverage to improve your marketing position.
Marketers have a difficult time determining where across the
brand experience to make investments and which element of the
marketing mix or customer touch point should be included. How
much do you spend on promotions, and how much on advertising?
Should the available funds go toward developing new products or to
support an improvement in customer service? There are so many
competing priorities, and the addition of the customer touch points
on top of the traditional elements of the marketing mix may at first
overwhelm marketers. Don’t worry—with EMM to help, you’re not
going to drown in options.
THE KEY TO SUCCESS: THINK HORIZONTALLY
Traditional marketers tend to spend an inordinate amount of
money on projects such as advertising, promotions, and direct mail.
It’s time to reconsider spending for the sake of spending.
When you need to put your brand experience blueprint to work
and choose your priorities, thinking horizontally means thinking
across the entire brand experience, the way you would think about
any networked decision. In other words, the fact that any relation-
ship has numerous inflection points and opportunities for influence
requires a marketer to think beyond the traditional domain of gen-
erating demand.
Many industrial companies have no real marketing capability
and tend to think of marketing as little more than a production
warehouse for annual reports or “brochure-ware” web sites. These
companies also tend to combine marketing and sales under one
roof, staffed by salespeople with less expertise in marketing.
Companies that have developed relatively sophisticated selling
processes, usually supported by the CRM investments detailed in
Chapter 5, look to marketing to fill the pipeline with leads or
opportunities. In this instance, marketing makes investments that
196 ENTERPRISE MARKETING MANAGEMENT
generate opportunities on which the sales force can then capitalize.
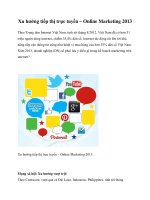
The sales pipeline diagram shown in Figure 10.2 highlights how
this approach generates rich opportunities to evaluate marketing
investments. Marketers can track investments not only on their
ability to generate opportunities, but also on the net output from
the investment effort, meaning that all marketing investments can
be tied downstream to specific sales generated by the lead.
Sales processes of this type are generally only useful for compa-
nies that fulfill products and services directly (e.g., financial ser-
vices) as opposed to companies that sell through third parties or
mass marketers (e.g., Kraft Foods).
This approach, which is already in place in many companies
today, is certainly much better than leaving marketing unconnected
to sales. But it still isn’t optimal. While using the sales pipeline is an
excellent way to evaluate the impact that marketing is having on
sales, it has limited predictive value and looks at the enterprise very
narrowly, giving marketing very little insight into the actual drivers
of opportunities. It’s a fine measurement system but a poor tool for
deciding where to place investments.
What is important is that the data that make up the pipeline
results help form your company’s profile for specific marketing
investments. In other words, the pipeline results help you under-
stand the ability of certain marketing mix elements and certain
marketing programs to drive profitable sales. It’s a critical piece of
your ongoing marketing learning and represents a primary method
for gathering information about the effectiveness of your marketing.
While the pipeline is a great gauge of what works and what
doesn’t, it can’t help you weigh all of your potential investment
OPTIMIZE MARKETING INVESTMENTS 197
FIGURE 10.2 Sales Pipeline
options and opportunities. Its data will be factored into the deci-
sion, but you still need more.
The more in question requires evaluating all of the potential
marketing investments across the brand experience blueprint. For
every key customer, for every interaction, what are the potential
marketing investments, and what is the profile of these potential
investments?
The most sophisticated marketing organizations look across all
customer interactions and then evaluate all of the potential mar-
keting investments as part of a dynamic network. Highly sophisti-
cated marketing organizations recognize the interdependence of
every marketing investment and evaluate all investments together
to determine how to optimize spending. Which marketing mix ele-
ment works the best? Which element of the brand experience needs
focus? Should you spend more money on promotions or invest in
more call center capabilities? These trade-offs, for the most part,
don’t currently exist, since the predominant method of traditional
marketing investment sits within the domain of traditional market-
ing departments.
Some marketers are weighing the trade-offs of investments in,
say, advertising versus promotion versus packaging, but even then,
it’s rare that they evaluate these investments together in such a way
as to estimate their combined effect. And in most cases, marketing
doesn’t play a role in many company decisions that affect customer
touch points, so it’s virtually impossible to bring the entire invest-
ment picture together.
In those rare companies where marketers bring a holistic view
to investments in the marketing mix and investments in customer
touch points, you can put numerous methods to work to optimize
your marketing investments. This is the key to bringing the most
scientific methods to bear on your total brand experience.
In the scientific community, optimization is defined as a math-
ematical methodology that allocates finite resources across multi-
ple competitive, conflicting, and overlapping initiatives, each with
unique constraints, to achieve an overall objective. Applied to the
demand chain, optimization is a mathematical decision-making
process that allocates finite resources across multiple channels,
business constraints, and scenarios in order to determine the opti-
mal mix of marketing investments to maximize return on market-
ing investment.
While this method of tracking investments may sound like
198 ENTERPRISE MARKETING MANAGEMENT
some kind of fantasy, chances are that your company is probably
already using this sort of approach—just not anywhere near the
marketing department. Your operations or logistics department
might be using this method to determine the routing of your deliv-
ery trucks. Or your CFO or investment bank might be using it to
model the ideal investment fund portfolio.
The concept of optimization is increasingly being applied to
pricing, across all industries, but most recently migrating from
strongholds such as airline tickets and hotel rooms to more tradi-
tional retail. The idea behind pricing optimization is quite simple:
Different customers get different prices for the same product or
service. Extrinsic drivers of pricing are taken into account (for air-
line tickets, channel used, advance purchase timing, Saturday night
stay, etc.) and help the brand discriminate and improve overall rev-
enue and profitability. See the Longs Drug Store case study later in
this chapter to learn how pricing optimization could be happening
at a drugstore near you.
CREATING A MARKETING INVESTMENT PROGRAM
The challenge of applying an optimization approach to marketing
investments is that you have to get your hands on good input if you
hope to make any use of the output. In order to create your mar-
keting investment program, you need to first consider where you’re
headed.
The first step toward determining where to place your marketing
assets is to develop a broad variety of potential marketing invest-
ments, looking at ways to activate your brand using both elements
of the marketing mix and every customer touch point around the
actual sale.
One of the drivers of the choices of investment should be the
information that you might have gathered from previous invest-
ments. This profile should include not only descriptions, cash out-
flows, and cash inflows, but should also include components such as
specific profiles of leads at each step in the sales process.
OPTIMIZE MARKETING INVESTMENTS 199
Create the marketing investment program
(your experiment), based on marketing mix element
or customer touch point.
In other words, determine not just how many leads were cre-
ated from a particular marketing investment, but also how many
were converted at each stage of the sales process. Measuring quan-
tity of opportunities generated by marketing is simply not suffi-
cient. It’s impossible to evaluate one marketing program against
another unless there’s a sense of potential return.
The need for potential return leads to the next required step:
developing a detailed profile of the investment and, at the very least,
an estimate of its possible return (see Figure 10.3). This is where the
200 ENTERPRISE MARKETING MANAGEMENT
Develop a profile of the investment and the return
on the Marketing investment.
FIGURE 10.3 Marketing Investment Profile
rubber meets the road. Whether you’re spending on billboards or on
developing better scripts to drive the outbound teleselling, the only
way to evaluate where in the brand experience to make investments
is to put all of the investments on equal footing. Much as an investor
might look at several potential investments and need to evaluate
historical performance, volatility (beta), and numerous financial
ratios (price/earnings, cash/share, return on equity, and so forth), so
must a marketer put all marketing investments on equal footing.
The mere exercise of requiring marketing managers to treat all
marketing spending as investments will pay almost immediate div-
idends in the caliber of the thought and approach applied to selling
more stuff. You’ll stop hearing rationalizations such as “Our aware-
ness is way up, but our sales are still in the tank.”
The idea here is not to require impossible accuracy, but to eval-
uate marketing investments against each other, so that you have all
the cards in front of you. Part of having all the cards in front of you
for decision making means having an ROI profile for each market-
ing investment. But even that’s not enough. You’ll need to dig
deeper . . .
In addition to developing a financial profile for each potential
marketing investment, marketers should identify those nonfinan-
cial metrics that give a more complete picture of the potential
investment and might also serve as leading indicators of the perfor-
mance of the investment (see Figure 10.4).
These additional metrics can mean the difference between seiz-
ing a great opportunity and wasting a ton of money. Many mar-
keters look at their marketing as if they were at the tables in Vegas.
Once the money is spent, even if it’s on media, they act as if the die
is cast, nothing can be changed, and nothing is known until the
money, leads, or opportunities roll in—or don’t.
Inherent in every marketing investment is a set of assumptions.
Just like any investment, there are numerous assumptions that
drive the initial decision—and they can in turn drive the decision to
up your bet if you’re on a winning streak or fold and walk away from
the table if the cards aren’t going your way.
OPTIMIZE MARKETING INVESTMENTS 201
Develop the nonfinancial metrics that are likely
leading indicators of marketing return.
For marketing investments, those assumptions might be as fol-
lows:
Sales cycle conversion factors
~ Any marketing investment that’s tracked across the
sales pipeline generates conversion factors at each
step along the way (for instance, “The coupon gener-
ated 150 contacts; out of those, 65 percent visited
the retail store; of those, 35 percent redeemed the
coupon; and of those, 10 percent purchased an addi-
tional item”).
~ These conversion factors form the heart of your com-
pany’s CRM system and are an excellent leading
indicator to determine whether your marketing
investment is going to behave like similar invest-
ments that have preceded it.
Channel perspective
~ Despite what many marketers may think, your sales
force is often your best proxy for determining how
your customer might respond to your marketing
investments. Your sales force or your distributors
might be able to vote on the effectiveness of your
marketing investment even before you’ve put it in
the field. The key here is to tie such input to histori-
cal results, just to make sure that your channel is
aligned with the way your customer thinks.
202 ENTERPRISE MARKETING MANAGEMENT
FIGURE 10.4 Leading Indicators of Performance
Investment risk (beta)
~ It’s important to capture some of the intangible qual-
ities of those marketing investments that are difficult
to measure. In this instance, investigate opportuni-
ties for creating your own evaluation system that
would introduce a risk measurement, thereby captur-
ing a number of the unstated elements of the mar-
keting investment. Ask marketers if one investment
is riskier than another, and they will most likely give
you their gut reaction. The problem is that very little
of this intuition is captured anywhere or incorporated
into broader investment decisions. This evaluation of
up-front risk can play a critical part in determining
where to place investments.
Historical performance
~ While you might be making a particular marketing
investment for the first time in a market or behind a
particular brand, the company’s experience with the
investment vehicle should be taken into account. If
the company gets a good response from print ads or is
able to drive retail traffic from Web-based coupons,
then this historical ability should weigh on the deci-
sion making. Access to this historical perspective
should also help generate real risk measures based on
actual performance instead of just gut measurement.
A key element of positioning your marketing assets to drive
profitable sales is having the right systems in place to know when
you’re actually being successful. Most marketers follow several or
even all of these steps, but are at a loss when it comes to actually
knowing what’s working and what’s not. As discussed in Chapter 3,
this is why it’s critical to plug marketing into finance and into the
enterprise systems that most companies have purchased and imple-
mented over the past decade.
OPTIMIZE MARKETING INVESTMENTS 203
Implement the process/system that will let you
evaluate the progress of your many experiments even
before they’re complete (and answer the question
“Are we selling more?”).
Even if you don’t have fancy systems or a big IT department,
you can cobble together this information on a regular basis to deter-
mine the state of your marketing investments: How’s your portfolio
doing? Are you making money?
Marketers can’t just sit around and complain that there’s no
way to track this or track that and throw up their hands. Part of
practicing EMM means creating the measures and information-
gathering capabilities that will let you know the results of your
investments. Staying on top of their progress can mean the dif-
ference between making your numbers and missing them by
a mile.
Why is this? Because when you invest in marketing, you often
have the opportunity to reevaluate in midstream. As Figure 10.5
illustrates, you can evaluate how your investment is faring against
your original budget and, in essence, rethink whether it’s the best
allocation of money at any particular point in time. Much as
investors rethink their portfolio positions on a regular basis, so too
should you bring the same rigor to your company’s investments.
204 ENTERPRISE MARKETING MANAGEMENT
FIGURE 10.5 Evaluate Investment Return Continuously
TEAMFLY
Team-Fly
®
Armed with a process to measure the impact of your marketing
investments, you’ll have everything you need to practice EMM
when positioning your marketing assets to drive profitable sales.
At the end of the day, you have to be prepared to answer the
simple question, “Am I selling more stuff?,” as it relates to any of
your marketing investments, and then make necessary changes
accordingly. The decision of where to place your marketing assets is
driven largely by the quality of the information that you have, the
rigor that you bring to the decision, and the processes that you’ve
built over time to learn from all of the decisions that have gone
before. And the past is prologue—what you learned yesterday will
help you today, and what you learn today will drive your revenues
higher tomorrow.
CASE STUDY: Longs Drug Store
USING PRICING OPTIMIZATION TO DRIVE
IMMEDIATE SALES RESULTS
Longs Drug Stores Corporation (NYSE:LDG) is the nation’s sixth-
largest drugstore chain. Founded in 1938 by brothers Joe and Tom
Long as Longs Self-Service Drugs, the company currently operates
stores in California, Hawaii,Washington, Nevada, Colorado, and Ore-
gon. Each store averages annual sales in excess of $9.5 million.
Longs has more than 440 stores and recorded approximately
$4.3 billion in sales during 2002.This represented a modest 4 percent
increase over 2001, but was dwarfed by sales of the drugstore indus-
try leader Walgreen Co., which reported $24.8 billion in sales during
2001 at its 3,706 stores nationwide. Overall pharmacy sales in the
United States were $165.2 billion last year. Longs’ performance for
fiscal 2002, which ended January 31, was generally disappointing.The
true barometer of growth, same-store sales, lagged behind the best
performers, and margins were low.
How is Longs different from Walgreens? Longs stores tend to be
much larger, upward of 10,000 square feet compared to the smaller,
5,000-square-foot Walgreens stores.While Longs stores tend to be in
suburban strip malls,Walgreens has focused on placing its stores on
busy streets.
OPTIMIZE MARKETING INVESTMENTS 205
More important, Walgreens has traditionally been a leader in
implementation of new technologies to drive retail operations. It was
the first drugstore chain to equip stores with VSAT satellite commu-
nication and install point-of-sale scanning chainwide. These invest-
ments have paid dividends over the years and have helped Walgreens
thrive amid ferocious competition. Longs has been relatively late in
making such technology investments and is now in the unfortunate
role of playing catch-up.
In the past few years, observers say, Longs has struggled to deal
with outdated technology that contributed to inventory control
problems at its warehouses and resultant difficulties in fulfilling indi-
vidual store orders. When you’re playing the game against industry
giants, including some best-in-class players (Wal-Mart, Walgreens),
then you can’t afford to be playing with old equipment.
Because Longs is grappling with how to compete with much
larger chains of stores, such as Walgreens and CVS, in addition to the
category competition from large grocery stores and mass merchan-
disers (Wal-Mart, Target), it has to identify those investments that
drive immediate results. It’s not likely to stay out of the consolidation
game, unless it’s able to grow more quickly. One area in which Longs
has seen and acted on an opportunity is pricing.
Most retailers price their items and determine markdowns based
on gut feelings, with some thought given to individual store perspec-
tives or the experience of their merchandisers or store managers.
They generally set their prices one of three ways: marking up from
cost, benchmarking against the competition’s prices, or simply playing
a hunch.This lack of a scientific approach is remarkable, given the pre-
cise data available and the ease of making a connection between what
marketers and merchandisers do and what the end results are.
The cost and complexity of crunching all pricing data to deter-
mine the optimal price for every stockkeeping unit (SKU) based on
the critical variables chosen—location, inventory level, weather—
have historically prevented retailers from taking such hands-on ana-
lytical action. But thanks to the development of specific software that
builds on the learning reservoirs of yield management programs pio-
neered by the airline industry, price optimization programs are now
available to retailers.
These software programs, which gather and analyze the enor-
mous quantities of data that now sit in point-of-sale and ERP systems,
leverage probability algorithms to come up with an individual demand
206 ENTERPRISE MARKETING MANAGEMENT
curve for each product in each retail store.With this information in
hand, retailers can identify which products are most price sensitive.
Then they can adjust prices up or down according to each store’s
priorities—profit, revenue, or market share—to achieve, in theory, a
maximum profit margin.
Longs Drug Stores Corporation has embarked on just such an
effort, putting pricing optimization to work in its retail locations in an
effort to drive overall profitability. From a consumer perspective, one
interesting outcome of implementing price optimization at the retail
level is that prices at the shelf could be different in different retail
locations, as is the case with airline tickets.Also, prices that normally
ended in familiar digits—.99 or .95—are replaced with odd amounts
like $3.21 and $6.36.
In addition to developing a demand curve for every item in every
store, these software programs can also forecast price and promotion
sensitivities for every item in every store, thereby helping to deter-
mine how to best execute strategies to drive profitable sales.
DemandTec developed Longs’ price optimization software; other
competitors in this space include KhiMetrics, KSS, Spotlight Solutions,
and ProfitLogix.
Longs is delighted with its results and has expanded its initial test
of the pricing optimization software to the majority of its retail loca-
tions. Terry Burnside, chief operating officer of Longs Drug Stores,
notes that the technology has brought about a “category-by-category
increase in sales and margins,” particularly in nonpharmacy sales,
which generate most of Longs’ profits.
However, just implementing the software is only part of the nec-
essary investment. Retailers have to ensure that their business mod-
els are adjusted accordingly—that is, integrating the pricing software
with shelf pricing mechanisms and each store’s point-of-sale system
to ensure that scanners record accurate prices. Further down the
value chain, retailers can compile knowledge gained from pricing opti-
mization software to inform decisions and communications about
additional orders.There are, of course, cultural changes as well—the
most significant of which is the requirement that existing employees
have faith that the system will deliver the profits, despite the quirky
prices.
“Optimizing OTC [over-the-counter] pricing strategies is an
important part of the company’s growth and overall business per-
formance,” said the CEO of Longs. “We anticipate this [pricing
OPTIMIZE MARKETING INVESTMENTS 207
optimization] implementation will help us improve our profitability,
yet allow us to maintain or improve our competitive price image
with our customers.” If Longs isn’t able to grow, it’s likely to become
an acquisition candidate for some of the larger players. Unfortu-
nately, standing still and not generating ever higher sales and profits
is not the way to survive in the competitive drugstore business.
Even the acquisition prospects for the company are dubious.
Walgreens has a proud tradition of not growing by acquisition, so
they’re unlikely to purchase a company like Longs. Other players, such
as Rite Aid, are still digesting many previous acquisitions and working
through issues such as regulatory scandals.The slow demise of Kmart,
another company that has a long history of being outspent on tech-
nology, comes to mind for Longs shareholders. Is this going to be a
similar ride?
Longs’ approach of leveraging optimization is at least giving its
sales a shot in the arm. Ironically, retailers have spent comparative for-
tunes in making sure that their inventories are managed flawlessly,
their logistics efforts are as efficient as possible, and their employees
are managed closely.What they’ve not put nearly enough effort into is
how to leverage marketing to drive profitable sales higher.You’re not
winning the game unless you can continue to grow sales in your exist-
ing stores. Pricing optimization offers a window into how the power
of optimization can be applied to businesses and make an impact
almost immediately.
MARKETER’S SCIENTIFIC METHOD: OPTIMIZING
MARKETING INVESTMENTS
Following are the steps to take in order to optimize your marketing
investments.
Step 1. Ensure Alignment with the Strategy
That the Marketing Investment Supports
While the strategy might be clear in the CMO’s head, it’s often not
clear throughout the marketing organization or even in the minds
of the marketing staff responsible for the details of a particular
marketing investment. Making this alignment happen can go a
208 ENTERPRISE MARKETING MANAGEMENT