STUDIES ON WATER MANAGEMENT ISSUESE Part 4 potx
Bạn đang xem bản rút gọn của tài liệu. Xem và tải ngay bản đầy đủ của tài liệu tại đây (1.77 MB, 20 trang )
Studies on Water Management Issues
50
Gyenizse, P. & Vass, P. (1998). A természeti környezet szerepe a Nyugat-Mecsek
településeinek kialakulásában és fejlődésében (The role of the physical
environment in the development of settlement in the Western Mecsek Mountains).
Földrajzi Értesítő, Vol.47, No.1–2, pp. 131-148, ISSN 0054-1503
Horváth, Á. (2005). A 2005. április 18-i mátrakeresztesi árvíz meteorológiai háttere
(Background to the 18 April 2005 flood at Mátrakeresztes, North-Hungary). Légkör,
Vol.50, No.1, pp. 6–10, ISSN 0133-3666 (in Hungarian with English summary)
Iverson, R. M. (1997). The physics of debris flows. Reviews of Geophysics, Vol.35. No.3, pp.
245–296, ISSN 8755-1209
Kaliczka, L. (1998). Hegy és dombvidéki vízrendezés (Water management in mountains and hills),
Manuscript lecture notes. Eötvös József Technical College, Baja (in Hungarian)
Available from:
Accessed on 03.05.2011
Kodama, K. & Barnes, G. M. (1997). Heavy rain events over the south-facing slopes of
Hawaii: Attendant conditions. Weather Forecasting, Vol.12, pp. 347–367, ISSN 0882-
8156
Koris, K (2002). A hazai hegy- és dombvidéki kisvízgyűjtők árvízhozamainak meghatározása
(Determining flood discharges on small cathcment in the mountains and hills of
Hungary). Vízügyi Közlemények, Vol.84, No.1, pp. 64–77, ISSN 0042-7616 (in
Hungarian)
Koris, K. & Winter, J. (2000). Az 1999. évi nyári rendkívüli árvizek a Mátra és a Bükk déli
vízgyűjtőjén (Extreme summer floods in the southern catchments of the Mátra and
Bükk Mountains, North-Hungary, in 1999). Vízügyi Közlemények, Vol.82, N.2, pp.
199–219, ISSN 0042-7616 (in Hungarian)
Laing, A. G. (2004). Cases of heavy precipitation and flash floods in the Caribbean during El
Niño winters. Journal of Hydrometeorology, Vol.5, (August 2004), pp. 577–594, doi:
10.1175/1525-7541(2004)005<0577:COHPAF>2.0.CO;2, ISSN 1525-7541
Lóczy, D. & Juhász, Á. (1996). Hungary, In: Geomorphological hazards of Europe, Embleton, C.
and Embleton, Ch., (Ed.), 243-262, Elsevier, ISBN 0-444-88824-1, Amsterdam, The
Netherlands
Lóczy, D. (2010). Flood hazard in Hungary: a re-assessment. Central European Journal
of Geosciences, Vol.2, No.4, pp. 537–547, doi: 10.2478/v10085-010-0029-0, ISSN
18961517
Maarten, R.; Erlich, M.; Versini, P A.; Gaume, E.; Lumbroso, D.; Asselman, N.; Hooijer, A. &
de Bruijn, K. (2007). Review of flood event management Decision Support Systems.
FLOODsite Project Report T19-07-01 Available from:
/>review_v1_4.pdf Accessed on 03.06.2011
Maddox, R. A.; Chappell, C. F. & Hoxit, L. R. (1979). Synoptic and mesoalpha-scale aspects
of flash flood events. Bulletin of American Meteorological Society, Vol.60, pp. 115–123,
ISSN 1520-0477
NOAA, National Weather Service (1992). Puerto Rico flash floods, January 5–6, 1992. Natural
Disaster Survey Report, Silver Spring, Maryland, USA, 92 pp.
Flash Flood Hazards
51
Norbiato, D.; Borga, M.; Degli Esposti, S.; Gaume, E. & Anquetin, S. (2008). Flash flood
warning based on rainfall thresholds and soil moisture conditions: An assessment
for gauged and ungauged basins. Journal of Hydrology Vol.362, Nos. 3–4, pp. 274–
290, doi:10.1016/j.jhydrol.2008.08.023, ISSN 0022-1694
Pászthory, R. & Szigeti, F. (2009). Árvízi Kockázati Információs Rendszer (Flood Risk
Information System), Conference paper at the Conference of the Hungarian Hydrological
Society, Baja (in Hungarian) Available from:
Accessed on 01.06.2010
Paudel, M. (2010). An examination of distributed hydrologic modeling methods as compared with
traditional lumped parameter approaches. PhD Dissertation, Brigham University,
Provo, Utah, USA Available from:
Accessed on 06.07.2011
Pirkhoffer, E.; Czigány, S. & Geresdi, I. (2009a). Impact of rainfall pattern on the occurrence
of flash floods in Hungary. Zeitschrift für Geomorphologie, Vol.53, No.2, pp. 139–157,
ISSN 0372-8854
Pirkhoffer, E.; Czigány, Sz.; Geresdi, I. & Lovász, Gy. (2009b). Environmental hazards in
small watersheds: flash floods – impact of soil moisture and canopy cover on flash
flood generation. Riscuri şi catastrofe, Cluj-Napoca, Casa cartii de stiinta, pp. 117–130,
ISSN 1584-5273
Pontrelli, M. D.; Bryan, G. & Fritsch, J. M. (1999). The Madison County, Virginia, flash flood
of 27 June 1995. Weather Forecasting, Vol.14, No.4, pp. 384–404, ISSN 0882-8156
Reid, I. (2004). Flash flood, In: Encyclopedia of Geomorphology Vol.1., Goudie, A.S., (editor-in-
chief), Routledge, pp. 376–378, ISBN 0-415-32737-7, London, UK
Reid, I.; Laronne, J.B.; Powell, D.M. & Garcia, C. (1994). Flash floods in desert rivers:
studying the unexpected. EOS, Transactions, American Geophysical Union, Vol.75,
No.39, p. 452, doi: 10.1029/94EO01076 ISSN 0096-3941
Schmittner, K.E. & Giresse, P. (1996). Modelling and application of the geomorphic and
environmental controls on flash flood flow. Geomorphology, Vol.16, No.4, pp. 337–
347, doi:10.1016/0169-555X(96)00002-5, ISSN 0169-555X
Stevaux, J.C. & Latrubesse, E. (2010). Urban Floods in Brazil, In: Geomorphology of Natural
Hazards and Human Exacerbated Disasters in Latin America, E. Latrubesse, (Ed.), pp.
245-266, Elsevier, ISBN 9780444531179, Amsterdam, The Netherlands
US Army Corps of Engineers (2005). Hydrologic Modeling System HEC-HMS. User’s Manual,
Version 3.0.0. USACE Hydrologic Engineering Center, Davis, California, USA
Vass, P. (1997). Árvizek a Bükkösdi-patak felső szakaszán (Floods in the headwaters of the
Bükkösd Stream), In: Földrajzi tanulmányok a pécsi doktoriskolából I., Tésits, R. & Tóth,
J. (Eds.), pp. 261–285, Bornus Nyomda, Pécs, Hungary (in Hungarian, English
summary)
Weston, K. J. & Roy, M. G. (1994). The directional-dependence of the enhancement of rainfall
over complex orography. Meteorological Applications, Vol.1, No.3, pp. 267–275, doi:
10.1002/met.5060010308, ISSN 1469-8080
Wieczorek, G. F.; Larsen, M. C.; Eaton, L. S.; Morgan, B. A. & Blair, J. L. (2001). Debris-flow
and flooding hazards associated with the December 1999 storm in coastal
Studies on Water Management Issues
52
Venezuela and strategies for mitigation. U. S. Geological Survey Open File Report 01-
0144, Available from:
Accessed on 02.04.2011
Xia, J.Q.; Falconer, R.A.; Lin, B.J. & Tan, G.M. (2011). Modelling flash flood risk in urban
areas. Water Management, Vol.164, No.6, pp. 267–282, doi:
10.1680/wama.2011.164.6.267, ISSN 1741-7589
3
Change of Groundwater Flow
Characteristics After Construction of the
Waterworks System Protective Measures on
the Danube River – A Case Study in Slovakia
František Burger
Slovak Academy of Sciences/Institute of Hydrology
Slovak Republic
1. Introduction
The waterworks construction affects the hydrological regime of the flow of groundwater in
the river alluvia that is usually in the hydrodynamic relation to the regime of the fluctuation
of the surface watercourse level. To elaborate the prognosis of the changes in the regime of
groundwater means to determine their sequence in time for the entire period of their
creation until the final stable status is reached. It has to be made on the basis of the
knowledge of hydrogeological situation within the territory and the contemporary regime of
groundwater. The creation of such changes may be invoked by natural changes or also
anthropogenic interventions into the water situation within the territory. The above implies
this is the unsteady flow task from hydrodynamic point of view. It is natural since
groundwater flow has always somehow the character of unsteady flow. It is implied by
natural conditions of their supply and drainage. The regime of supply and drainage of
groundwater in water-bearing collectors depends upon the factors not changed in time, so
in general, the mode of fluctuation of groundwater level is affected by the changes in time as
well and therefore it is unsteady. However, if the conditions of supply and drainage of
groundwater are changed in time negligibly, or if the area of interest of the water-bearing
collector is located in a certain sufficient distance from the source of supply and drainage
point, the flow of groundwater may be practically considered to be stable. The time slope of
the forecast changes within the determined area of flow then shall, in addition to other
conditions, depend upon time changes in surface and groundwater at its edges, i.e. in the
areas of supply or drainage of groundwater. The forecast time changes shall then depend
upon the character of the peripheral impacts, thus they shall be different in the case of the
natural changes in hydrological conditions and different in the case of artificial structural
interventions into contemporary hydrological conditions. In particular, the morphological
changes in the river bed, contents of suspended sediments in the watercourse and natural
colmatage of the watercourse belong amongst the natural changes in the hydrological
conditions of the territories affecting the groundwater regime (Velísková, 2010; Gomboš,
2008). All the technical structural measures amending the conditions of supply and drainage
Studies on Water Management Issues
54
of groundwater belong amongst the interventions into the waterworks conditions of the
territories affecting the groundwater regime (Šoltész & Baroková, 2004). In many cases, it is
necessary to know not only the final condition achieved by the groundwater level after the
implementation of any technical measure, but also the time after what the final condition is
reached, or the time procedure of settlement of the new groundwater level status. That
means, in general, the task regarding the long-term prognosis in the changes in the
groundwater regime must be compiled as the task of unsteady flow of groundwater, where
the reached final steady condition is the extreme case (Duba, 1964).
The protective measures on the Danube River
The designed waterworks complex consists of Gabčíkovo waterworks and Nagymaros
waterworks which are, in terms of hydraulic, navigation, and energy distribution, a single
operating system. The multipurpose hydroelectric project was built together with Hungary,
according to an interstate Treaty signed in 1977. The waterworks complex on the Danube
was designed to have an additional level at Nagymaros, consisting of a reservoir 95 km long
and the Nagymaros power plant. This level was to be located between the Hungarian towns
of Nagymaros and Visegrad and its purpose was to use the gradient of the reservoir for
production of electricity and to allow ships to pass. When the Gabčíkovo Project was 90%
completed, Hungary stopped fulfilling its treaty obligations in 1989 and tried to end the
Treaty in 1992 (www.gabcikovo.gov.sk).
In 1992, the Slovak party put into operation the Gabčíkovo waterworks using an alternative
solution on the territory of the Slovak Republic (so called "C" variant) and it wholly
completed the works on the object "Protective measures of the Nagymaros waterworks
storage reservoir". The necessity of the construction of the object was implied by the reason
of the prevention of an unfavourable impact of the dammed level of the Danube River by
the Nagymaros step on the territory of the Slovak Republic. This was the reinforcement of
the Danube River dam on the territory of the Slovak Republic, the Váh river dam, the Hron
river dam and the Ipeľ river dam. The backwater of the Danube River would prevent the
gravitation outflow if the internal waters into the Danube River. The erected underground
walls in the protective dams prevent the gravitation outflow of internal waters from the
territory of the Slovak Republic in the Komárno - the Ipeľ river estuary section, even when
there is no backwater in the Danube River. For that reason the internal waters of the
territory must be pumped into the Danube River through the erected pumping stations. The
administrator of the river basis incurs increased costs related to the activity without their
compensation. At the time of the decision of the Hungarian party on the termination of the
works on the Nagymaros waterworks, the majority of the protective measures had already
been implemented or in the uppermost stage of progress. Subsequently, their scope was
minimised and they completed the objects related to
• the flood protection of the territory and
• the diversion of internal waters.
Protective measures against the level impoundment in the reservoir Nagymaros were built
on the Slovak territory during the construction of Gabčíkovo waterworks. These consist of
renovation of existing dams with newly built underground sealing walls, reinforcement of
Change of Groundwater Flow Characteristics After Construction of the
Waterworks System Protective Measures on the Danube River – A Case Study in Slovakia
55
banks and building seepage canals. Protective measures include the construction of
drainage channels and pumping stations and channels. Since the Hungarian side does not
build up the lower reservoir, the operation will only be the Gabčíkovo waterworks and the
protective measures established in the Slovak Republic that have been running for the
maintenance of surface and ground water management at each water stage in the Danube
River.
The Patince - Štúrovo section, RK 1751.8 to 1716.0
The construction of the underground walls in the Kravany nad Dunajom section RK 1746.6
to 1722.5 and in the Štúrovo section RK 1722.5 – 1716.0 took place in 03/1985 – 06/1996.
There are two so called "windows" omitted in the non-permeable underground wall. The
entire construction was carried out before 11/2002 (the data provided by Vodohospodárska
výstavba š.p. Bratislava).
2. Modelling and numerical simulation of groundwater flow in the Čenkov
reparian alluvial aquifer
2.1 The long-term minimal anthropogenic disruption in natural conditions in of the
study area
The solution of groundwater flow features assessments, which are due to later
anthropogenic investigations into the area are ranked as almost natural, are going out from
the evaluation of former groundwater regimes based on observations in the nature,
knowledge of geological structure of the area and hydrogeologic conditions, which is
serving as a base to the water-level regime assessment and the subsequent assessment of the
main groundwater flow directions.
The aim of the task to be solved is to create a numerical model for a steady groundwater
flow in the reparian alluvial aquifer of the Čenkov plain, and its calibration, verification and
obtaining of results by a simulation that is at groundwater level, using filtration velocity
vectors, groundwater paths by particle tracking and the water budget. One assumption is
that long-term minimal anthropogenics disrupted the natural conditions of the study area.
As the date of the simulation was chosen on the day of 29 September 1954, because of the
steady state of water flow through the study area, and also of the Danube low stage and
because of existence of solving similar task by other methods in the past (Duba, 1964) and
thereby available data needed for modelling and simulation.
2.1.1 Description of study area
The Čenkov plain is situated in the eastern part of the Danubian lowland, west apart from
Štúrovo town. It is the fluvial plain of the Danube, which borders in the south on a 23
kilometre long river section between RK 1722 and 1745 and in the north in an arc stretching
across the terrace platform, where on its boundary lies the Moča village, the Búč village, the
Júrsky Chlm village, the Mužla village and the Obid village. The fluvial plain is from 2.5 km
up to 6 km wide and has an overall area of 66 km
2
. Its surface is flat. The heights of the
terrain vary from 106 up to 108 m a.s.l. The lowest-situated section under the terrace is on
height level 105m a.s.l. and the highest situated section in the Čenkov wood is on the middle
of the area 108 – 110m a.s.l. (Fig. 1 and 2).
Studies on Water Management Issues
56
Fig. 1. Geographical situation of the Čenkov plain
Fig. 2. Water management map of the Čenkov plain
2.1.2 Evaluation of natural conditions
2.1.2.1 Climate
From a climatic point of view the study area belongs to a warm locality in the scope of the
south-eastern part of the Danubian lowland, where it has a warm and dry climatic zone
with a mild winter. First, the temperature characteristics and yearly air temperature average
shows that the south of Slovakia is the warmest locality of the republic. The average 10.4
o
C
at Štúrovo is convincing. Uniformity of moisture conditions is clear already from the yearly
relative air moisture average, which varies from 74 - 81 % and is the lowest in the bottom
most parts of the Danubian lowland (Štúrovo 74 %, Komárno 75 %). In the territory of the
West-Slovakia district, which is the most productive agricultural locality, the precipitation
has significant importance. The centre of this locality is the Danubian lowland, which is
Change of Groundwater Flow Characteristics After Construction of the
Waterworks System Protective Measures on the Danube River – A Case Study in Slovakia
57
indeed the warmest but also has the driest locality. In a series of long-term observations, the
lowest annual precipitation totals vary in terms of 300 – 400 mm and minimum monthly
precipitation totals in particular months do not even reach (except for July) 5 mm
precipitation, whereupon significant dry periods are more often in summer half-year than in
winter half-year. The lowest July precipitation totals do not drop under 10 mm. On the other
hand wet (precipitation) periods are lasting here mostly from 18 to 20 days, and their
appearance is relatively more rare than the appearance of dry periods and it occurs mostly
in spring and autumn periods. The highest annual precipitation totals could reach 900 mm,
even in singular cases up to 1000 mm of precipitation.
2.1.2.2 Hydrogeology and geology
The Danube fluvial plain at observed river sections is built by sediment deposits of the
Danube River, where their thickness varies irregularly between 5 - 12 m and the most
frequent thicknesses are between 6 - 9 m. Gravel and sand dominate soil layers, which are in
the highest part covered by alluvial loams. Gravel–sand fillings of the Danube fluvial plain’s
bed in this section belong to Würm, and the cover of sandy loam is Holocene.
Fig. 3. Hydrogeological profile 1-1 (400x exceeded). Comments: 1-young Pleistocene blown
sands, 2-medium to smooth sands, 3-sandy gravel to rough sands with gravel, 4-downhill
loamy sediments along upper terrace step, 5-dusty to loamy sands, eventually dusty – sandy
loams, 9- marking of the tertiary base surface, 10-groundwater level on 29 Sept.1954, 11-the
highest groundwater level in years 1954 – 1956 (Duba, 1964)
It is possible to observe their partial subtilization in longitudinal profiles of gravel sand
alluvia (Fig. 3 and 4) in the Danube direction, although the appearance of heavier gravel
layers is possible in the whole profile. The left edge of the Danube’s fluvial plain is lined by
Studies on Water Management Issues
58
a markedly terraced step with relative height approximately 15 m and base 3 m above the
Danube water level. Absolute height of the base is around 110 m a.s.l. it is slowly
descending from the Chotin village to the Štúrovo town. Hydrogeological conditions of the
terrace were proofed only by a few boreholes, after which hydraulic conductivity of gravel
varies from 6.6E-05 m.s
-1
(the Chotín village) up to 2.0E-03 m.s
-1
(the Štúrovo town – the
Nana village). Groundwater recharge happens entirely from precipitation in locations where
permeable blown sands or loamy sands and sandy loams are located in hanger. Ground-
water from the terrace is drained on its edge to the lower step, partly on contact as it comes
up to the surface and it is taken away by the drainage channels. The ground-water level in
the alluvia is mainly influenced by the surface stream of the Danube River and then on other
side by water seeping down from an adjacent terrace and through precipitation. The
ground-water flow direction according to bilateral relation of the Danube water level and
ground-water level was either to the aquifer or to the Danube.
Fig. 4. Hydrogeological profile along the Danube bank (400x exceeded), (Duba, 1964)
2.1.2.3 Hydrology
Through the hydrological characteristics of the study area and the description of surface
flows in an objective time it is necessary to concentrate on the Danube River, which has here
first- rated importance. Slovak Danube river reach belongs to the upper part of middle part
of the river. Danube is keeping its alpine character in Slovak reach, in its upper part it has
considerable slope around 0.4%
o
, it is flowing in its own alluvia and it is creating multiple
systems of river arms. Water stages are first of all dependent on the water supply from the
Alps. Maximum water stage reaches the Danube in June at the time of alpine snow and
glacier melting. From June it comes to permanent decrease and minimum water stages are
reached in December and January. The Danube water stage on 29 September 1954 in RK
1742.9 (Radvaň nad Dunajom) was 105.20 m a.s.l. Other surface flows in study area are
rather small and short and their discharges are low. The maximum occurs in spring months,
and in summer their discharge is considerably decreased. Such streams are Modrianský
potok (creek) (from Veľká Dolina), its left-hand side tributary Vojnický potok (creek), and
Mužliansky potok (creek). Main channels: the Obidský, the Búčský, the Kraviansky and the
Krížny channel belong to the system, as well as the large amount of side drainage channels
without any name.
Change of Groundwater Flow Characteristics After Construction of the
Waterworks System Protective Measures on the Danube River – A Case Study in Slovakia
59
3. Methods and material
3.1 Modelling
3.1.1 Mathematical model of groundwater flow
Three-dimensional groundwater flow of constant density through porous earth material
may be described by a partial differential equation (McDonald, M.G. & Harbaugh A.W.,
1988):
xx yy zz s
hhhh
KKKWS
xxyyzz t
∂
∂∂ ∂∂∂ ∂
∂
∂∂ ∂∂ ∂ ∂
⎛⎞
⎛⎞ ⎛⎞
++−=
⎜⎟
⎜⎟ ⎜⎟
⎝⎠ ⎝⎠
⎝⎠
(1)
Where
x, y, z are Cartesian coordinates in the direction of main axis of hydraulic conductivity K
xx
,
K
yy
, K
zz
, K
xx
, K
yy
, K
zz
are the values of hydraulic conductivity in the direction of the axis of
Cartesian coordinates x, y, z, which are assumed that they are parallel with major axis of
hydraulic conductivity [L T
-1
], h piezometric pressure head [L], W volumetric flux per unit
volume, which represents sources and (or) sinks of water [T
-1
], S
s
specific storage of the
porous material [L
-1
], and t time [T]. In general, S
s
, K
xx
, K
yy
, and K
zz
may be the functions of
space (S
s
= S
s
(x, y, z) a K
xx
= K
xx
(x, y, z), etc. and h and W could be the functions of space and
time (h = h (x, y, z, t), W = W(x, y, z, t)) which means that equation (1) describes groundwater
flow for unsteady conditions in a heterogeneous and anisotropic medium, provided that the
principal axes of hydraulic conductivity are aligned with the coordinate directions. Equation
(1), together with the specification of flow and (or) head conditions on aquifer boundaries
and specification of initial head conditions, creates a mathematical model of groundwater
flow. A solution of equation (1), in an analytical sense, is an algebraic formula which
indicates h (x, y, z, t), so that when the derivatives of h, with respect to space and time are
substituted into equation (1), the equation and its initial and boundary conditions are
satisfied. Besides these very simple systems, it is possible to reach an analytical solution of
equation (1) only rarely, so therefore it is necessary to use numerical methods for solution.
One of the methods is the finite difference method, where the continuous system of
equations (1) is substituted by the finite set of discrete points in the space and time, and the
partial derivatives are substituted by terms calculated from the differences in head values at
these points. Such an approach leads to the system of linear algebraic differential equations.
Values of head in specific points in time are obtained by their solutions. These values
represent approximation of the time-variable distribution of piezometric head, which could
have been obtained by analytical solution of equation (1).
3.1.2 Three-dimensional modular model of groundwater flow” MODFLOW”
The finite difference model originally published by McDonald & Harbaugh (1988), in the
form of later modifications and addendums, and its modular computer program was
utilized by the solution of the mentioned task. The modular structure consists of the "main
program" and a series of independent subroutines called "modules". The explanation of
physical and mathematical concepts, on which the model is based, and an explanation on
how the modules are implemented into the structure of computer program, is listed in detail
in the mentioned work. Ground-water flow in hydrogeological ground-water body is
Studies on Water Management Issues
60
simulated by the use of a finite difference block-central method. The solution of systems of
simultaneous linear equations is possible to obtain by various methods.
3.1.3 Conceptual groundwater modelling
3.1.3.1 Definition of model’s boundaries
Northern to western boundaries of the modelled area are chosen regarding to the
demarcation of hydrogeological groundwater body of the Čenkov plain from the northern
side by the higher old-Würm terrace step. The Danube River creates the southern to eastern
border (Fig. 2).
Fig. 5. The aquifer of the Čenkov plain
3.1.3.2 Transformation of the hydrogeological system - vertical schematization
The topography of the surface terrain was processed into digital format from maps with the
scale of 1: 10 000. For purposes of modelling, the above described hydrogeological system
was transformed into a three-layers system, which consists of an upper covering soil layer
(1
st
layer), of a medium to soft sand layer (2
nd
layer) and of a sandy gravel to rough sands
with a gravel layer (3
rd
layer) (Fig. 5). These type of layers were selected for modelling as
follows: 1
st
layer: unconfined, 2
nd
layer: confined/unconfined (transmissivity = const.), 3
rd
layer: confined/unconfined (transmissivity = const.). Thicknesses of particular layers were
defined from geological and hydrogeological data from the survey. The surface of the
tertiary base is considered impermeable.
Change of Groundwater Flow Characteristics After Construction of the
Waterworks System Protective Measures on the Danube River – A Case Study in Slovakia
61
3.1.3.3 Discretization in the space and time
Hydrogeological systems are divided into a mesh of blocks called cells, the locations of
which are described in terms of rows, columns, and layers. Footprint dimensions are picked
so that the whole area of the Čenkov plain is covered with a smooth overlay. Dimensions of
cells are:
Δ
x =
Δ
y = 50 m. Geometry of the model is: 22.5 km x 6.5 km, (130 rows and 450
columns); 3 layers. Grid orientation was picked in the direction of the general groundwater
flow and coordinate axis x, y, z are approximately parallel to the main hydraulic
conductivity axis. Groundwater flow has always had a certain measure of unsteady flow.
This results from natural conditions of recharge and drainage of groundwater. However, if
the recharge and drainage groundwater conditions are changing in the time slightly, the
flow is quasi-steady and practically represents certain boundary status. From the modelling
target point of view a steady status of groundwater flow was considered to the date 29
September 1954.
3.1.3.4 Filtration parameters of the aquifer
Following filtration parameters were necessary for the modelling of this case: horizontal
hydraulic conductivity, transmissivity, vertical hydraulic conductivity, effective porosity
and coefficient of vertical leakage. Horizontal hydraulic conductivity of the groundwater body
was obtained from the results of the hydropedological and hydrogeological survey in the
study area. Data from pumping tests in probes and boreholes were globally processed by
the means of interpolation method of kriging. Values vary from 7.48E-07 m s
-1
to 3.99E-03 m
s
-1
. Transmissivity of the layers was calculated as a multiple of horizontal hydraulic
conductivity and thickness of the layer. Vertical hydraulic conductivity: by the modelling
applications the usual ratio of the horizontal to vertical hydraulic conductivity is from 1 to
10 (Anderson & Woessner, 1992). For the first and second layer ratio 1.0 was selected in
compliance with results of the field research and for the third layer the ratio 2.0. Effective
porosity is the feature of an aquifer to receive and to send out fluid in order to build
hydrostatic pressure in the layer and through to the groundwater level. Quantitatively it is
expressed by the coefficient of flexible storage and coefficient of free water level storage. The
value of the coefficient of the free water level storage depends on hydraulic conductivity
and also on grain size distribution of sediments and varies around 0.05 up to 0.15 for loamy
sands, 0.15 for soft granulated to dusty sands, 0.19 for soft granulated sands, 0.22 for
medium granulated sands and 0.24 for rough granulated sands, gravels etc. Estimated
values of flexible storage for unit volume of the groundwater body are stated in the work of
Mucha & Šestakov (1987). Vertical leakage is required in the case of multiple layers
groundwater body and represents the resistance to the water leakage at adjacent layers.
3.1.4 Calibration and verification of the model
Calibration is a process, when the initial input model parameters are adjusted until output
(dependent) model parameters at most approach the values measured in the terrain.
Calibration of the model is an inverse-model process, i.e. the problem of parameter
estimation is an inverse problem. Calibration of the model or the inverse model process
could be performed either repetitively, either on a manual basis by way of trial and error, or
by using a special computer program. The calibration was executed by the means of the
special computer program PEST with manual tuning of some zones. Calibration results for
Studies on Water Management Issues
62
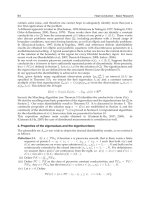
the status up to date 29 September 1954 are shown in Fig. 6. The difference between
measured groundwater stages in probes from the Hydrometeorological Institute’s observing
network have calculated groundwater stages have a maximum value of 0.17 m and the
regression coefficient has a value near to one, which refers to high correspondence of
calculated results with measured results. The calibrated model of steady groundwater flow
was verified at the low water stage in the Danube up to date 7 Aug. 2002 and at high water
stage in the Danube up to date 7 May 2000. For both cases a very good accordance of
measured and calculated groundwater levels was reached.
Comparison of Calculated and Observed Heads
106.5
106.0
105.5
105.0
104.5
104.0
Calculated Values
104.0 104.5 105.0 105.5 106.0 106.5
Observed Values
7432
7432
514
7438
6062
7422
7426
520
519
6024
Fig. 6. Plot of calculated versus observed heads
3.1.5 Simulated steady head distribution and flow lines
Data about groundwater fluctuation has shown that the basic factors which are influencing
groundwater level changes are atmospheric precipitation, bank filtration from the Danube
river and underground inflow from the upper terrace direction north-west and on the
northern edge of the area, then evapotranspiration, and underground outflow to the
Danube (draining effect of the Danube) and outflow through the drainage canals.
On Fig. 7 we can see that the drainage effect of the Danube is from RK 1745 to RK 1733 and
from RK 1727 to RK 1722, and this presents altogether 17 km of bank filtration drainage
systems in the river. Bank filtration recharge is from RK 1733 to RK 1727 and that is 6 km
bank length of the Danube. The line of direct drainage influence of the Danube goes from
the Moča village along the edge of the terrace step to the Búč village, where it turns to the
south approximately to the Mária farmstead whence it continues in a southern-easterly
Change of Groundwater Flow Characteristics After Construction of the
Waterworks System Protective Measures on the Danube River – A Case Study in Slovakia
63
Fig. 7. Simulated steady head distribution and flowlines in the second model layer
Fig. 8. 3-D visualization of filtration velocity vectors - view from south
Studies on Water Management Issues
64
direction to the river in the Čenkov locality. The second drainage area is bounded from the
south from the Obid canal river mouth to the Danube up to the Štúrovo town and from the
north by the “Pod kopanicami” drainage canal. The feeding effect of the river is decreased
by the drainage of lower parts of the Mužliansky creek and the Obid canal. The remaining
part of the study area is drained by the local system (the Obid, Krížny and Búčsky canal).
On Fig. 8 there is a 3D visualization of the whole groundwater body, with velocity vectors in
the second layer of the groundwater body where there are the highest filtration velocities
along the Obid canal and Mužliansky creek and at their river mouths, and also along the
bank of the Danube (drainage) around RK 1742. Similarly in the third layer, there are the
highest filtration velocities along open streams and along the Danube bank from RK 1744 to
RK 1742 and around RK 1729. The range of filtration velocity values in the whole
groundwater body varies from 1E-10 m.s
-1
to 1.19E-03 m.s
-1
. Particle tracking is used for the
tracing of the groundwater flow directions, which means creating flow lines by carrying out
the tracing of infinitely small imaginary elements movement situated in the flow field. In the
reach from the Moča village to the Čenkov settlement groundwater flow into the Danube
except the northern part in which groundwater flows to the drainage canals. From the Obid
canal mouth to the Danube River (RK 1727) up to the Štúrovo town groundwater flow
direction is again into the Danube. The volume water budget for the whole model at the end
of the simulation is calculated in order to control the results. It indicates acceptation of the
numerical solution. Continuity has to be preserved also for the total model inflow and
outflow or sub region of the layer. The difference in the water budget of the study area is
0.01 % the difference should be in ideal case smaller than 0.1%, what is fulfilled. In general
an error up to 1% is accepted (Konikow & Bredehoeft, 1978).
4. The hydrological classification of groundwater regimes
The basic regime specificities of the fluctuation of groundwater level in the alluvial plains
and terraces of rivers in dependence upon the fluctuation of the level in a watercourse may
be observed only if the natural conditions create the possibility of the hydrodynamic
continuity between the level in the surface watercourse and groundwater. If such a relation
is possible, then three zones may be earmarked according to the regime symptoms of the
groundwater level fluctuation on the riverine territory:
- In the first zone, that is called the narrower riverine zone, every fluctuation of the level
of the surface watercourse corresponds with the fluctuation of the groundwater level, of
course with the higher distance from the watercourse characterized by the increase in
the phase shift and reduction of amplitude. In a certain distance from the watercourse,
due to the increased resistance of the porous environment (it is proportional to the
length) lower fluctuations in the watercourse level stop influencing the fluctuation of
the groundwater level and the next zone is entered.
- In second zone, called wider riverine zone, only greater fluctuations of the watercourse
level or the water conditions with longer duration affect the fluctuation of the
groundwater level. Its external demarcation (in the direction from the river to the
outskirts of the territory) is considered to be the join of the points in which the
horizontal straight line plotted at the height of the maximal river level crosses the
highest underground level in the riverine valley cross-sections. The river level may not
directly influence the groundwater level behind this line via bank filtration.
Change of Groundwater Flow Characteristics After Construction of the
Waterworks System Protective Measures on the Danube River – A Case Study in Slovakia
65
- In third zone, called the external riverine zone, the groundwater level is always higher
than the watercourse level. Despite that it is considered to be the riverine zone, since the
gradual direct increase in the groundwater level in narrower and wider riverine zone
increases the base for the groundwater drainage of the external riverine zone, in which
their level may raise as a consequence of the fact the underground inflow has more
difficult outflow conditions and vice versa. Then also the territory is indirectly affected
by the outflow river regime - its level fluctuation.
It is clear the boundary between narrower and wider riverine zone, similarly as between
wider and external riverine zone is conventional to the certain degree. It must be
understood to the intent that its determination pursuant to the stated principles is based
upon a certain length of observation time, during which all somehow extreme situations
need not to occur. The most distant demarcation of the external riverine zone shall be the
edge of the terraced step of the bottom land or other its demarcation at the contact with
other hydrogeological units.
If the natural conditions are anthropogenically influenced and create a limited possibility of
a hydrodynamic link between the level of the surface stream and groundwater, as it is in the
case of the constructed underground non-permeable seating wall (the "NSW") between the
Danube River and hydrogeological collector with omitted sections in the NSW, so called
"windows", the demarcation of the boundaries between the zones is more difficult. The
coefficients of determination for the individual boreholes are considered, while they are
very important for the assessment of the degree of dependence between the level of the
Danube River and the groundwater level. The boundary between narrower and wider
riverine zone shall be determined using two-dimensional models of groundwater flow,
displaying the isolines of piezometric groundwater heads and the vectors of filtration speed.
The boundary is changed in dependence upon the level condition in the watercourse. The
average width of narrower riverine zone of the Danube River at the left side of the lower
Váh River in the proximity of an "window" is approximately 2500 m and it is approximately
2300 m on the Čenkov plain. Wider riverine zone is earmarked by the boundary of
hydrogeological region Q 057 in both cases.
5. Analyses and comparison of representative groundwater regime of the
territory before, and after construction of protective measures
The processing of the observed data and creation of numerical models enables the
clarification of the laws of the groundwater regime, in particular to determine its
fundamental characteristics, which are: the level heights and main directions of the
groundwater flow, depth of the groundwater level under the terrain, the fluctuation of the
underground level, the lines of development of changes of the groundwater level in time,
volumetric budget and hydrogeological profiles.
The height of levels and main directions of groundwater flow shall be determined using the
isolines of the piezometric heights of groundwater level (piezometric contours; for a free
level ground water table contours) as the basic document. Firstly they are constructed for
the characteristic conditions of the factors that may affect the groundwater regime,
according to the knowledge of the hydrogeological and geomorphological conditions of the
territory and the preliminary assessment of the observed data. They are the extreme cases of
the occurrence of the meteorological factors, such as the periods after extraordinary heavy
Studies on Water Management Issues
66
rainfall or after prolonged rain-free periods. In addition, they are construed also for the
periods of the occurrence of the extreme and average conditions of the groundwater for the
observation period. Such processing produces the basic data on the conditions of supply
and drainage of the groundwater within the territory.
3
3
4
4
Cross section 3-3
Cross section 4-4
Danube
Plan view
Fig. 9. Steady state head distribution (black lines, m a.s.l. ), flowlines (blue lines in the third
model layer, purple lines in the second model layer) and velocity vectors(green, m.s
-1
) in the
3
rd
model layer before the construction of protective measures – minimum water stage of the
Danube
Contour levels: min. 101.42 m a.s.l., max. 104.43 m a.s.l. Flowlines: the direction of the flow
of groundwater is from the aquifer to the Danube River lengthwise. Velocity vectors:
maximal speeds of the groundwater flow are at the Vojnice brook beyond the effluent from
the Búčsky pond in second model layer and somehow smaller speeds are in the Eastern part
of the territory of interest at Štúrovo, at Čenkov and at the proximity of the Modranský
brook in the third model layer. Maximum value of horizontal pore velocity is 5.11E-04 m.s
-1
and maximum vertical pore velocity is 3.89E-07 m.s
-1
(Fig. 9).
Plan view
Cross section 3-3
3
4
Danube
Cross section 4-4
3
4
Fig. 10. Steady state head distribution, flowlines and velocity vectors in the 3
rd
model layer
after the construction of protective measures – minimum water stage of the Danube
Change of Groundwater Flow Characteristics After Construction of the
Waterworks System Protective Measures on the Danube River – A Case Study in Slovakia
67
Contour levels: min. 101.34 m a.s.l., max. 107.94 m a.s.l. Flowlines: the groundwater flows
from the aquifer from the Búčšsky pond to the Danube River via the "window" next to
Kravany. Smaller amount of groundwater flows to the Danube River via the "Window" at
Čenkov. Velocity vectors: the maximal speeds of the groundwater flow are in the Eastern
zone of the water source of Kravany towards the wells. Maximum value of horizontal pore
velocity is 1.23E-03 m.s
-1
and maximum vertical pore velocity is 8E-08 m.s
-1
(Fig. 10).
Plan view
Cross section 3-3
3
4
4
Danube
Cross section 4-4
Fig. 11. Steady state head distribution, flowlines and velocity vectors in the 3
rd
model layer
before the construction of protective measures – average water stage of the Danube
Contour levels: min. 103.32 m a.s.l., max. 107.91 m a.s.l. Flowlines: the Western half of the
territory of interest is drained by the Danube River. The water source of Kravany drains the
circular zone up to the Kravany channel. The aquifer is supplied from the settlement of
Čenkov up to the pumping station Obid by the Danube River. The interior is drained by and
water is conducted away by the drainage channels, in particular the Obid and Mužľa ones.
Velocity vectors: the maximal speeds of flow are around the water source of Kravany in
second model layer and somehow lower ones are in the Eastern part of the territory of
interest in the section of Obid - Štúrovo in third model layer. Maximum value of horizontal
pore velocity is 4.32E-04 m.s
-1
and maximum vertical pore velocity is 4.21E-09 m.s
-1
(Fig. 11).
Cross section 4-4
3
Cross section 3-3
Plan view
3
4
4
Fig. 12. Steady state head distribution, flowlines and velocity vectors in the 3
rd
model layer
after the construction of protective measures – average water stage of the Danube
Studies on Water Management Issues
68
Contour levels: min. 102.79 m a.s.l., max. 107.95 m a.s.l. Flowlines: the aquifer drains the
Danube River via the window at Kravany approximately from the territory of the
intravillain of the village of Kravany. The aquifer drains significantly more via second
window at Čenkov, where it takes out the groundwater from the water reservoir at the
village Búč. The interior is drained by and water is conducted away by the system of
drainage channels, in particular the Obid channel. Velocity vectors: the highest speeds of
flow re in second model layer around the water source of Kravany. Maximum value of
horizontal pore velocity is 1.13E-03 m.s
-1
and maximum vertical pore velocity is 1.06E-07
m.s
-1
(Fig. 12).
Contour levels: min. 104.00 m a.s.l., max. 109.53 m a.s.l. Flowlines: the Danube River fills the
aquifer lengthwise. The groundwater is drained in the interior by and conducted away by
the system of drainage channels. Velocity vectors: the maximal speeds of flow are between
the Kravany channel and the Danube River in second model layer. Maximum value of
horizontal pore velocity is 9.42E-03 m.s
-1
and maximum vertical pore velocity is 5.82E-07
m.s
-1
(Fig. 13).
Contour levels: min. 102.50 m a.s.l., max. 109.53 m a.s.l. Flowlines: The Danube River
supplies the entire aquifer via both windows. The groundwater is drained in the interior by
and conducted towards the pumping stations by all drainage channels. Velocity vectors: the
maximal speeds of flow are in the area between the Kravany channel and the Danube River
in second model layer. The highest speeds of flow of the groundwater in third model layer
are in the intravillain of the village of Kravany and at Čenkovo. Maximum value of
horizontal pore velocity is 7.67E-04 m.s
-1
and maximum vertical pore velocity is 6.70E-08
m.s
-1
(Fig. 14).
Depth of the groundwater level under the terrain is conditioned by its height and morphology of
the area. The significance of the processing of depth at analogous water stages as the isolines
of piezometric heights lies in the fact they enable to assess the possibility of supply of
groundwater from rainfall or their drainage by evapotranspiration in dependence upon the
Plan view
4
3
4
Danube
Cross section 4-4
Cross section 3-3
3
Fig. 13. Steady state head distribution, flowlines and velocity vectors in the 3
rd
model layer
before the construction of protective measures – maximum water stage of the Danube