Satellite Communicationsever increasing widespread Part 3 pdf
Bạn đang xem bản rút gọn của tài liệu. Xem và tải ngay bản đầy đủ của tài liệu tại đây (1.26 MB, 35 trang )
Cooperative Strategies for Satellite Access 61
2. Satellite Access: scenarios and critical issues
Satellite communications have developed a global success in the field of digital audio/TV
broadcasting because they offer a wide coverage area and, therefore, they are suitable for the
distribution of multimedia contents to a large number of potential users, also in rural envi-
ronments. Moreover, they allow the extension of the coverage area of terrestrial, fixed and
mobile, networks. One of the most interesting example concerning this capability, is provided
by Inmarsat which has developed a broadband global area network service for mobile termi-
nals on land, at sea and in the air. Users can send and receive voice and data services nearly
everywhere on Earth. In particular, in some specific cases as the transoceanic maritime and
aeronautical communications, satellites are the only practical solution to telecommunications
requirements.
Broadband satellite systems can also help to bridge the digital divide because they can provide
a rapid deployment compared with other terrestrial infrastructures, without gigantic invest-
ments. For example, continents (e.g. Africa) and large countries which, currently, lack in
infrastructures could satisfy their needs (mobile phones, Internet access, etc.) and create new
opportunities for human development. Applications like telemedicine, e-learning or simply
an easy access to information can allow economic activities to grow and develop.
Satellite systems can allow a multitude of valuable services and applications to emerge. Be-
sides for commercial services such as broadcasting, multimedia transmission and broadband
services, the use of satellite for telecommunication is also considered for other application
scenarios such as public services, emergency services, data relay services, etc. For example,
the monitoring and the protection of critical infrastructures such as pipelines and oil plat-
forms, depend on data transmission via satellite. And also coastal and maritime security has
increased thanks to the use of new satellite technologies suitable for tracking the position and
the state of goods transported by sea. In fact, vessels are required to carry satellite terminals
that transmit their identity and position. The benefits of satellite communications are well
visible also in emergency applications wherein the world-wide Civil Protection is involved
in order to guarantee safety to population. In case of floods, earthquakes, volcanic eruptions
and other major disasters, terrestrial communication networks could be damaged and not be
able anymore to provide the services required by first responder teams, such as, for exam-
ple, a robust voice communication system. Rescue teams terminals should be also compatible
with other different kinds of terminals if the disaster involves more than one country and so
multinational rescue operations are needed. In such a situation, satellites can flexibly connect
different first responder team clusters over large distance across incompatible standards. In
fact, for large disasters, only satellites are actually able to cover the whole scene and provide
broadband services. A satellite communication component is considered in the Air Traffic
Management scenario, as well. Also in this application, the main satellite communication
strengths are the large coverage area and the rapid deployment. Thanks to the use of satel-
lites, a seamless service between air traffic controllers and pilots could be provided in Europe,
including not only areas of dense traffic but also remote areas such as Mediterranean sea,
transatlantic routes, deserts, etc.
However, analysing all these scenarios, some critical issues in the use of satellite systems, com-
mon to many contexts, can be highlighted. In particular, the presence of link impairments and
fading conditions (multipath, long periods of shadowing and blockage) or the mobility effects
(occurrence of visibility and not visibility conditions) require the adoption of solutions in or-
der not to reduce system performance and capabilities. Moreover, power constraints have to
be taken into account, as well, especially in case mobile terminals are considered.
3. Overview on Cooperative Communications
Some years ago, a new class of techniques, called cooperative communications, has been pro-
posed as a valuable alternative to the spatial diversity techniques which require the deploy-
ment of additional antennas in order to mitigate the fading effects.
Cooperative communications are based on the concept that a group of mobile terminals can
share their single antennas in order to generate a “virtual” multiple antenna, obtaining the
same effects than a MIMO system, (Nosratinia et al., 2004; Ribeiro & Giannakis, 2006). This
approach can be seen as a new form of spatial diversity in which, however, the diversity gain
can be achieved through the cooperation of different users, opportunely grouped in clusters,
which can assume the double role of active user, i.e. the user which transmits its own infor-
mation data and cooperator, i.e. the user which “helps” the active user in its transmission,
(Sendonaris et al., 2003a;b).
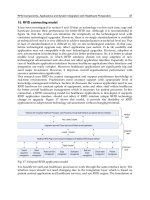
The key concept is that each user sees an independent fading process and that spatial diversity
can be generated by transmitting each user’s data through different paths, as shown in Fig. 1.
COOPERATO
R
ACTIVE USER
Independent fading paths
Fig. 1. Example of cooperative communications
An effective way to mitigate fading is to supply the receiver with multiple replicas of the
same information-bearing signal transmitted over independent channels. Because of this in-
dependence, the probability that all the considered signals are simultaneously vanishing due
to fading, is considerably reduced.
If p, (0
≤ p ≤ 1), is the probability that any signal is faded below a threshold value, the proba-
bility that all L independent fading channels, containing the same signal, are faded below the
threshold value, is given by:
p
tot
=
L
∏
i=1
p = p
L
(1)
and, therefore, it is lower than p, (Lee & Chugg, 2006).
The cooperative approach turns to be useful for mobile terminals which, because of their size
constraints, cannot support multiple antennas and it allows them to increase their perfor-
mance in terms of Bit Error Rate, Packet Error Rate and Outage probability.
The scenarios wherein the idea of cooperation has been applied so far are, mainly, the cellular
networks, the wireless sensor networks and the ad hoc networks, but it can be very interesting
to consider the adoption of such strategies also in mobile satellite scenarios which are charac-
terised by the continuous occurrence of LOS and NLOS conditions.
Satellite Communications62
There are several cooperative methods which have been proposed in literature (Nosratinia et
al., 2004; Ribeiro & Giannakis, 2006; Sendonaris et al., 2003a;b). However, the main coopera-
tive strategies can be summarised in:
• Amplify and Forward (AF)
• Decode and Forward (DF)
• Selective Forwarding (SF)
• Coded-Cooperation
3.1 Amplify and Forward
The Amplify and Forward is the simplest cooperative method. In this scheme cooperators re-
ceive a noisy version of the signal transmitted by active users which, then, amplify and re-
transmit towards the final destination. Thus, in this case, also the noise component is ampli-
fied and retransmitted by cooperators.
Considering the case of one active user and one cooperator, the amplification factor A can be
written as follows, (Darmawan et al., 2007; Ribeiro & Giannakis, 2006):
A
2
=
P
c
P
u
|h(u, c)|
2
+ N
(2)
being P
c
the power of the signal transmitted by the cooperator, P
u
the power of the signal
transmitted by the active user,
|h(u, c)|
2
is the coefficient of the channel between active user
and cooperator, and N is the noise power.
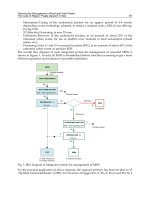
The Amplify and Forward strategy requires minimal processing at cooperator terminals but
needs a consistent storage capability of the received signal consuming, therefore, memory re-
sources. This method is particularly efficient when the cooperator is close to final destination,
as shown in Fig. 2, so that the link from the cooperator to the destination, d
2
, is characterized
by high signal-to-noise ratios and, hence, the link between the active user and the cooperator,
d
1
, becomes comparable to the link between the active user and the destination, d
3
.
COOPERATO
R
ACTIVE USER
DESTINATION
d
1
d
2
d
3
Fig. 2. Amplify and Forward: efficient terminals displacement
3.2 Decode and Forward
In the traditional Decode and Forward scheme, instead, each cooperator always decodes sig-
nal coming from the active users, u
(i) (with i = 1 . . . N
u
, where N
u
is total of active users),
obtaining an estimate of transmitted signal,
ˆ
u
(i). Then, it retransmits the signal, c(i):
c
(i) =
ˆ
u
(i) i = 1 . . . N
u
(3)
after a re-encoding generally with a repetition-coded scheme.
COOPERATOR
ACTIVE USER
DESTINATION
u
c = û
Fig. 3. Decode and Forward scheme
Although it has the advantage to be a simple scheme, this cooperative method does not
achieve diversity gain. In fact, considering the case of one active user and one cooperator,
it is proven that the diversity order is only one, because the overall error probability over
two links is dominated by the error probability in the link between the active user and the
cooperator, (Laneman et al., 2004; Ribeiro & Giannakis, 2006).
3.3 Selective Forwarding Cooperation
The Selective Forwarding strategy derives from the Decode and Forward technique and it is
based on the concept that cooperators repeat active users’ packets by transmitting them through
different channel paths with the condition that only the successfully decoded packets received
from active users, are sent toward the final destination.
This strategy is more complex than the Decode and Forward method, (Nosratinia et al., 2004;
Ribeiro & Giannakis, 2006), because it requires FEC (Forward Error Correction) decoding fol-
lowed by a CRC (Cyclic Redundancy Check) check to detect possible errors in the packets sent
from the active users to the cooperators, but it has some important advantages.
First of all, Selective Forwarding is the simplest cooperative method from the perspective of the
destination even though it overworks the digital processor at cooperating terminals. More-
over, differently from the Decode and Forward, it allows to achieve diversity and, therefore,
to increase the diversity order. Assuming that wireless links between active users and coop-
erators (d
1
), are much better than links between active users and their final destinations, (d
3
),
as shown in Fig. 4, and that all users in the considered cluster see uncorrelated channels, the
diversity order can be considered equal to the number of users involved in a transmission
(active user and its cooperators), (Alamouti, 1998). In this case, Selective Forwarding turns to
be the best choice for implementing a cooperation process.
Since, for example, in a return link satellite scenario the previous assumptions can be consid-
ered valid, the Selective Forwarding scheme can be selected as a right cooperative strategy to
be implemented in such kind of environments.
Cooperative Strategies for Satellite Access 63
There are several cooperative methods which have been proposed in literature (Nosratinia et
al., 2004; Ribeiro & Giannakis, 2006; Sendonaris et al., 2003a;b). However, the main coopera-
tive strategies can be summarised in:
• Amplify and Forward (AF)
• Decode and Forward (DF)
• Selective Forwarding (SF)
• Coded-Cooperation
3.1 Amplify and Forward
The Amplify and Forward is the simplest cooperative method. In this scheme cooperators re-
ceive a noisy version of the signal transmitted by active users which, then, amplify and re-
transmit towards the final destination. Thus, in this case, also the noise component is ampli-
fied and retransmitted by cooperators.
Considering the case of one active user and one cooperator, the amplification factor A can be
written as follows, (Darmawan et al., 2007; Ribeiro & Giannakis, 2006):
A
2
=
P
c
P
u
|h(u, c)|
2
+ N
(2)
being P
c
the power of the signal transmitted by the cooperator, P
u
the power of the signal
transmitted by the active user,
|h(u, c)|
2
is the coefficient of the channel between active user
and cooperator, and N is the noise power.
The Amplify and Forward strategy requires minimal processing at cooperator terminals but
needs a consistent storage capability of the received signal consuming, therefore, memory re-
sources. This method is particularly efficient when the cooperator is close to final destination,
as shown in Fig. 2, so that the link from the cooperator to the destination, d
2
, is characterized
by high signal-to-noise ratios and, hence, the link between the active user and the cooperator,
d
1
, becomes comparable to the link between the active user and the destination, d
3
.
COOPERATO
R
A
CTIVE USE
R
DESTINATION
d
1
d
2
d
3
Fig. 2. Amplify and Forward: efficient terminals displacement
3.2 Decode and Forward
In the traditional Decode and Forward scheme, instead, each cooperator always decodes sig-
nal coming from the active users, u
(i) (with i = 1 . . . N
u
, where N
u
is total of active users),
obtaining an estimate of transmitted signal,
ˆ
u
(i). Then, it retransmits the signal, c(i):
c
(i) =
ˆ
u
(i) i = 1 . . . N
u
(3)
after a re-encoding generally with a repetition-coded scheme.
COOPERATOR
ACTIVE USER
DESTINATION
u
c = û
Fig. 3. Decode and Forward scheme
Although it has the advantage to be a simple scheme, this cooperative method does not
achieve diversity gain. In fact, considering the case of one active user and one cooperator,
it is proven that the diversity order is only one, because the overall error probability over
two links is dominated by the error probability in the link between the active user and the
cooperator, (Laneman et al., 2004; Ribeiro & Giannakis, 2006).
3.3 Selective Forwarding Cooperation
The Selective Forwarding strategy derives from the Decode and Forward technique and it is
based on the concept that cooperators repeat active users’ packets by transmitting them through
different channel paths with the condition that only the successfully decoded packets received
from active users, are sent toward the final destination.
This strategy is more complex than the Decode and Forward method, (Nosratinia et al., 2004;
Ribeiro & Giannakis, 2006), because it requires FEC (Forward Error Correction) decoding fol-
lowed by a CRC (Cyclic Redundancy Check) check to detect possible errors in the packets sent
from the active users to the cooperators, but it has some important advantages.
First of all, Selective Forwarding is the simplest cooperative method from the perspective of the
destination even though it overworks the digital processor at cooperating terminals. More-
over, differently from the Decode and Forward, it allows to achieve diversity and, therefore,
to increase the diversity order. Assuming that wireless links between active users and coop-
erators (d
1
), are much better than links between active users and their final destinations, (d
3
),
as shown in Fig. 4, and that all users in the considered cluster see uncorrelated channels, the
diversity order can be considered equal to the number of users involved in a transmission
(active user and its cooperators), (Alamouti, 1998). In this case, Selective Forwarding turns to
be the best choice for implementing a cooperation process.
Since, for example, in a return link satellite scenario the previous assumptions can be consid-
ered valid, the Selective Forwarding scheme can be selected as a right cooperative strategy to
be implemented in such kind of environments.
Satellite Communications64
COOPERATO
R
ACTIVE USER
DESTINATION
d
1
d
2
d
3
Fig. 4. Selective Forwarding: best implementation scenario
3.4 Coded-Cooperation
In the Coded-Cooperation, the cooperative strategy is integrated with channel coding tech-
niques. In this case, instead of producing more replicas of the active user’s signal, as it
happens in other cooperative methods, the codewords produced by each user belonging to
a determined cluster, are divided in different portions which are transmitted through differ-
ent independent fading channels, by the considered user and by a selected group of users,
called partners, which are involved in the cooperation process, (Hunter & Nosratinia, 2002;
2006; Janani et al., 2004).
The basic idea is that each user tries to transmit an incremental redundancy of its partners
data, besides its own data. Considering, for example, the case of two users, they cooperate by
dividing their own codewords of length N, in two successive segments, as shown in Fig. 5.
In the first segment, each user transmits a codeword of length N
1
containing its own data,
USER2
USER1
DESTINATION
N
1
USER2 bits N
2
USER1 bits
N
1
USER1 bits N
2
USER2 bits
Fig. 5. Coded-Cooperation scheme
obtained by its original codeword. Then, each user receives and decodes its partner’s first
segment. If this is correctly decoded, each user can compute the additional parity bits of the
partner’s data and transmit the new codeword of length N
2
containing the partner’s data, in
the second segment. If the partner’s info cannot be correctly decoded, the user reverts to the
non-cooperative mode and it transmits its own data. In fact, if a certain terminal is unable to
cooperate, because of the wrong reception of the partner’s data, it can always use the available
capacity to transmit its own data.
The idea of Coded-Cooperation is to use the same overall code rate and power for transmission
as in a comparable non-cooperative system, i.e. the same system resources are used. More-
over, this cooperation methodology can provide a higher degree of flexibility with respect to
other cooperation methods and a higher adaptability to channel conditions, by allowing the
use of different channel coding and partitions schemes. For example, the overall code can be
a block code or a convolutional code or a combination of both and, then, coded bits to put
into the different segments, can be selected through puncturing, product codes, etc., (Hunter
& Nosratinia, 2006).
4. Cooperation Techniques for Uplink Satellite Access
Considering what said above, the Selective Forwarding and the Coded-Cooperation turn to be two
cooperative strategies which are suitable to be used in critical satellite scenarios, in particular
in the return link suffering from a tighter link budget especially if the involved users are mo-
bile terminals. Therefore, in the following, a specific uplink satellite scenario which presents
some tricky issues, is proposed as “case study”, in order to show the advantages deriving
from the adoption of such cooperative strategies.
The considered model is composed of a set of N
u
vehicular users which are interconnected
through reliable wireless links and connected to a terrestrial gateway through a geostationary
satellite, as shown in Fig. 6.
ACTIVE USER
COOPERATOR #2
COOPERATOR #1
NLOS
LOS
LOS
SATELLITE
Fig. 6. Satellite cooperative scenario
The forward link is based on the DVB-S2 (Digital Video Broadcasting - Satellite second gen-
eration) standard, (DVB-S2 standard, 2009), while the return link (on which this analysis is
focused) is based on DVB-RCS (Digital Video Broadcasting - Return Channel Satellite), (DVB-
RCS standard, 2005). According to the MF-TDMA (Multi Frequency - Time Division Multiple
Access) scheme employed by such a standard, a certain number of frequency/time slots are
assigned to users within a superframe depending on their specific demand. The adopted
propagation satellite channel model is mainly taken from (Ernst et al., 2008), and it is sum-
marised here for the sake of completeness. The model considers a frequency non-selective
Cooperative Strategies for Satellite Access 65
COOPERATO
R
ACTIVE USER
DESTINATION
d
1
d
2
d
3
Fig. 4. Selective Forwarding: best implementation scenario
3.4 Coded-Cooperation
In the Coded-Cooperation, the cooperative strategy is integrated with channel coding tech-
niques. In this case, instead of producing more replicas of the active user’s signal, as it
happens in other cooperative methods, the codewords produced by each user belonging to
a determined cluster, are divided in different portions which are transmitted through differ-
ent independent fading channels, by the considered user and by a selected group of users,
called partners, which are involved in the cooperation process, (Hunter & Nosratinia, 2002;
2006; Janani et al., 2004).
The basic idea is that each user tries to transmit an incremental redundancy of its partners
data, besides its own data. Considering, for example, the case of two users, they cooperate by
dividing their own codewords of length N, in two successive segments, as shown in Fig. 5.
In the first segment, each user transmits a codeword of length N
1
containing its own data,
USER2
USER1
DESTINATION
N
1
USER2 bits N
2
USER1 bits
N
1
USER1 bits N
2
USER2 bits
Fig. 5. Coded-Cooperation scheme
obtained by its original codeword. Then, each user receives and decodes its partner’s first
segment. If this is correctly decoded, each user can compute the additional parity bits of the
partner’s data and transmit the new codeword of length N
2
containing the partner’s data, in
the second segment. If the partner’s info cannot be correctly decoded, the user reverts to the
non-cooperative mode and it transmits its own data. In fact, if a certain terminal is unable to
cooperate, because of the wrong reception of the partner’s data, it can always use the available
capacity to transmit its own data.
The idea of Coded-Cooperation is to use the same overall code rate and power for transmission
as in a comparable non-cooperative system, i.e. the same system resources are used. More-
over, this cooperation methodology can provide a higher degree of flexibility with respect to
other cooperation methods and a higher adaptability to channel conditions, by allowing the
use of different channel coding and partitions schemes. For example, the overall code can be
a block code or a convolutional code or a combination of both and, then, coded bits to put
into the different segments, can be selected through puncturing, product codes, etc., (Hunter
& Nosratinia, 2006).
4. Cooperation Techniques for Uplink Satellite Access
Considering what said above, the Selective Forwarding and the Coded-Cooperation turn to be two
cooperative strategies which are suitable to be used in critical satellite scenarios, in particular
in the return link suffering from a tighter link budget especially if the involved users are mo-
bile terminals. Therefore, in the following, a specific uplink satellite scenario which presents
some tricky issues, is proposed as “case study”, in order to show the advantages deriving
from the adoption of such cooperative strategies.
The considered model is composed of a set of N
u
vehicular users which are interconnected
through reliable wireless links and connected to a terrestrial gateway through a geostationary
satellite, as shown in Fig. 6.
ACTIVE USER
COOPERATOR #2
COOPERATOR #1
NLOS
LOS
LOS
SATELLITE
Fig. 6. Satellite cooperative scenario
The forward link is based on the DVB-S2 (Digital Video Broadcasting - Satellite second gen-
eration) standard, (DVB-S2 standard, 2009), while the return link (on which this analysis is
focused) is based on DVB-RCS (Digital Video Broadcasting - Return Channel Satellite), (DVB-
RCS standard, 2005). According to the MF-TDMA (Multi Frequency - Time Division Multiple
Access) scheme employed by such a standard, a certain number of frequency/time slots are
assigned to users within a superframe depending on their specific demand. The adopted
propagation satellite channel model is mainly taken from (Ernst et al., 2008), and it is sum-
marised here for the sake of completeness. The model considers a frequency non-selective
Satellite Communications66
SHADOWED
LOS
BLOCKED
P
LL
P
LS
P
LB
P
SL
P
SS
P
SB
P
BL
P
BB
P
BS
Fig. 7. 3-states channel model
channel at Ku band. In these conditions, a generic passband received signal, r
(t), can be writ-
ten as:
r
(t) = Re{A(t) ·
s
(t − t
0
)e
j2π f
0
t
}+ n(t) (4)
where A
(t) is the multiplicative time-varying channel coefficient,
s(t) the complex-envelope
of the transmitted signal, t
0
the propagation delay, f
0
the carrier frequency and n(t) the addi-
tive thermal noise.
The channel coefficient is a complex term and, therefore, it can be expressed through its abso-
lute value (also called modulus),
|A (t)|, and its phase φ(t):
A
(t) = |A(t)|e
φ(t)
(5)
The amplitude of the channel coefficient,
|A (t)|, represents the amplitude of the fading term
which, according to this class of models, can be divided into fast and slow fading. Slow fading
events, commonly referred to as shadowing, model the attenuation caused by the orography
and large obstacles, such as hills, buildings, trees, etc., through absorption and diffraction
mechanisms, and they are normally modelled as a finite state machine. Fast fading events, in-
stead, due to the irregularity of the obstacles (e.g. vegetative shadowing) and to the multipath
propagation phenomena caused by reflections over surrounding surfaces, can be additionally
modelled as superimposed random variations that follow a given Probability Density Func-
tion (PDF) for each state.
At an arbitrary time instant t and assuming that the transmitted signal
s
(t) has unitary am-
plitude
1
, the overall PDF describing the received signal amplitude, called below R(t), can be
written as:
p
R
(r) =
N
∑
k=1
P
k
· p
R,k
(r) (6)
being N the number of states, P
k
the absolute probability of being in the state k (that can
be easily obtained from the State Transition Matrix S
= [p
ij
], containing in each element the
probability of transition from the state i to the state j) and p
R,k
(r) the PDF associated to the
fast fading within state k.
Following this approach, a three states (LOS, Shadowed and Blocked) Markov-chain based
model is assumed for the fading process, as shown in Fig. 7.
1
Under this hypothesis, the received signal amplitude, R(t) corresponds to the amplitude of the fading
term, i.e. R
(t) = |A(t)|.
The LOS state is characterised by a Rician PDF of the following form:
p
R
(r) =
r
σ
2
·exp
−
r
2
+ z
2
2σ
2
· I
0
r
·z
σ
2
, r
≥ 0 (7)
being I
0
the zero-order modified Bessel function of the first kind, z the amplitude of the line-
of-sight component and σ
2
the power of the real part or the imaginary part of the scattered
component.
The Shadowed state is characterised by a Suzuki PDF, (Suzuki, 1977). The Suzuki process is a
product process of a Rayleigh process and a Lognormal (LN) process, (Finn & Flemming, 1977;
Pätzold, 2002). The slow signal fading is, in this case, modelled by the Lognormal process
taking the slow time variation of the average local received power into account. The Rayleigh
process models, instead, the fast fading. The Suzuki PDF can be expressed as follows, (Lin et
al., 2005):
p
R
(r) =
+∞
0
r
σ
2
ray
L
2
·exp
−
r
2
2σ
2
ray
L
2
·
1
√
2πφσ
ln
L
·exp
−
1
2
ln
(L) −φµ
ln
φσ
ln
2
dL (8)
wherein the first term represents the conditional joint Lognormal and Rayleigh PDF while
the second term is the Lognormal PDF which characterises the random variable L. Moreover,
φ
= ln 10/20 while µ
ln
and σ
ln
are the mean and standard deviation, respectively, of the asso-
ciated Gaussian distribution in dB unit.
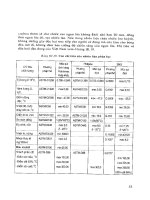
Finally, the Blocked state is characterised by no signal availability. The set of considered pa-
rameters is provided in Table 1 for the environment considered next, namely highway. The
average state transition period is equal to 0.0417 s, corresponding to blocks of 1000 samples
at the sampling frequency of 24 kHz. The above mentioned state duration refers to average
speed v of 100 Km/h.
Environment State Transition Matrix P (LOS, SH, BL) Rice z Rice σ Rice Factor σ
ln
µ
ln
Highway 0.9862 0.0138 0.0000 0.8922 0.9892 0.0947 17 dB 1.5 dB -8 dB
0.1499 0.8378 0.0123 0.0823
0.0008 0.0396 0.9596 0.0255
Table 1. Ku-band land-vehicular channel parameters
Doppler Spectrum is estimated as proposed in (Dubey & Wee Teck Ng, 2002; Law et al., 2001),
taking into account a realistic antenna beamwidth and the angle between satellite position
and terminal direction by means of the following equation:
S
( f ) =
A
f
d
1
−
f
f
d
2
if f
d
cos(φ + α) < f < f
d
cos(φ −α)
0 otherwise
(9)
The following values have been considered:
• α
= π/2
Cooperative Strategies for Satellite Access 67
SHADOWED
LOS
BLOCKED
P
LL
P
LS
P
LB
P
SL
P
SS
P
SB
P
BL
P
BB
P
BS
Fig. 7. 3-states channel model
channel at Ku band. In these conditions, a generic passband received signal, r
(t), can be writ-
ten as:
r
(t) = Re{A(t) ·
s
(t − t
0
)e
j2π f
0
t
}+ n(t) (4)
where A
(t) is the multiplicative time-varying channel coefficient,
s(t) the complex-envelope
of the transmitted signal, t
0
the propagation delay, f
0
the carrier frequency and n(t) the addi-
tive thermal noise.
The channel coefficient is a complex term and, therefore, it can be expressed through its abso-
lute value (also called modulus),
|A (t)|, and its phase φ(t):
A
(t) = |A(t)|e
φ(t)
(5)
The amplitude of the channel coefficient,
|A (t)|, represents the amplitude of the fading term
which, according to this class of models, can be divided into fast and slow fading. Slow fading
events, commonly referred to as shadowing, model the attenuation caused by the orography
and large obstacles, such as hills, buildings, trees, etc., through absorption and diffraction
mechanisms, and they are normally modelled as a finite state machine. Fast fading events, in-
stead, due to the irregularity of the obstacles (e.g. vegetative shadowing) and to the multipath
propagation phenomena caused by reflections over surrounding surfaces, can be additionally
modelled as superimposed random variations that follow a given Probability Density Func-
tion (PDF) for each state.
At an arbitrary time instant t and assuming that the transmitted signal
s
(t) has unitary am-
plitude
1
, the overall PDF describing the received signal amplitude, called below R(t), can be
written as:
p
R
(r) =
N
∑
k=1
P
k
· p
R,k
(r) (6)
being N the number of states, P
k
the absolute probability of being in the state k (that can
be easily obtained from the State Transition Matrix S
= [p
ij
], containing in each element the
probability of transition from the state i to the state j) and p
R,k
(r) the PDF associated to the
fast fading within state k.
Following this approach, a three states (LOS, Shadowed and Blocked) Markov-chain based
model is assumed for the fading process, as shown in Fig. 7.
1
Under this hypothesis, the received signal amplitude, R(t) corresponds to the amplitude of the fading
term, i.e. R
(t) = |A(t)|.
The LOS state is characterised by a Rician PDF of the following form:
p
R
(r) =
r
σ
2
·exp
−
r
2
+ z
2
2σ
2
· I
0
r
·z
σ
2
, r
≥ 0 (7)
being I
0
the zero-order modified Bessel function of the first kind, z the amplitude of the line-
of-sight component and σ
2
the power of the real part or the imaginary part of the scattered
component.
The Shadowed state is characterised by a Suzuki PDF, (Suzuki, 1977). The Suzuki process is a
product process of a Rayleigh process and a Lognormal (LN) process, (Finn & Flemming, 1977;
Pätzold, 2002). The slow signal fading is, in this case, modelled by the Lognormal process
taking the slow time variation of the average local received power into account. The Rayleigh
process models, instead, the fast fading. The Suzuki PDF can be expressed as follows, (Lin et
al., 2005):
p
R
(r) =
+∞
0
r
σ
2
ray
L
2
·exp
−
r
2
2σ
2
ray
L
2
·
1
√
2πφσ
ln
L
·exp
−
1
2
ln
(L) −φµ
ln
φσ
ln
2
dL (8)
wherein the first term represents the conditional joint Lognormal and Rayleigh PDF while
the second term is the Lognormal PDF which characterises the random variable L. Moreover,
φ
= ln 10/20 while µ
ln
and σ
ln
are the mean and standard deviation, respectively, of the asso-
ciated Gaussian distribution in dB unit.
Finally, the Blocked state is characterised by no signal availability. The set of considered pa-
rameters is provided in Table 1 for the environment considered next, namely highway. The
average state transition period is equal to 0.0417 s, corresponding to blocks of 1000 samples
at the sampling frequency of 24 kHz. The above mentioned state duration refers to average
speed v of 100 Km/h.
Environment State Transition Matrix P (LOS, SH, BL) Rice z Rice σ Rice Factor σ
ln
µ
ln
Highway 0.9862 0.0138 0.0000 0.8922 0.9892 0.0947 17 dB 1.5 dB -8 dB
0.1499 0.8378 0.0123 0.0823
0.0008 0.0396 0.9596 0.0255
Table 1. Ku-band land-vehicular channel parameters
Doppler Spectrum is estimated as proposed in (Dubey & Wee Teck Ng, 2002; Law et al., 2001),
taking into account a realistic antenna beamwidth and the angle between satellite position
and terminal direction by means of the following equation:
S
( f ) =
A
f
d
1 −
f
f
d
2
if f
d
cos(φ + α) < f < f
d
cos(φ −α)
0 otherwise
(9)
The following values have been considered:
• α
= π/2
Satellite Communications68
• f
d
= v · f
0
/c
• 2φ
= θ
3 dB
= 70λ/D
• D
= 65 cm
being D the antenna diameter, v the terminal speed defined above and f
0
= c/λ, the carrier
frequency at Ku band equal to 14 GHz.
4.1 Selective Forwarding Cooperation for Critical Satellite Scenarios
The analysis considers the adoption, in the scenario described above, of a cooperative strat-
egy which allows the users to share the uplink effort according to the Selective Forwarding
cooperation scheme. Fig. 8 shows an example of the used procedure which describes how
the resources are allocated and managed in the TDMA scheme. Groups of timeslots, named
frames, are assigned to active users and cooperators in order that they can transmit their traffic
bursts (in the following named simply “packets”).
User 1
User 2
Coop A Coop B
Frame 1
Frame 2
Frame 3 Frame 4
Fig. 8. Example of timeslot assignation in a superframe: 2 active users and 2 cooperators
Within each superframe, the active users (User1 and User2) convey their informative pack-
ets while the cooperators (Coop A and Coop B) repeat each one half User1’s packets and half
User2’s packets in an alternate way. In particular, Coop A retransmits before a User1’s packet
and then a User2’s packet, whereas, vice versa, Coop B starts repeating before a User2’s packet
and then a User1’s packet. Hence, in this case, two replicas of the same packet for each active
user are sent through the satellite and the receiver can apply a CRC mechanism in order to
detect the correct packets among those received. Such a method can be simply extended to a
different number of active users and cooperators.
The benefits of this procedure can be assessed observing Fig. 9 wherein the received signal
power of each active user and its cooperators, is reported. In some time portions, in fact, the
cooperators can experiment better satellite channel conditions than the active users and their
retransmission of packets becomes fundamental in order to not to lose some pieces of infor-
mation sent by the active users. The receiver can process differently corrupted replicas of the
same packet and the probability to detect packets successfully increases considerably.
In the model, the terrestrial wireless links between active users and cooperators, used to share
packets, are characterized by error-free conditions in order to evaluate the efficiency of the
cooperative strategy in the satellite land-vehicular scenario.
In the following, some results achieved through computer simulations are presented. First of
all, it is shown how the number of involved cooperators affects the system performance. In
particular, in Fig. 10, the performance comparison in terms of average PER (Packet Error Rate)
between the no cooperation and cooperation (with 2 cooperators and 4 cooperators) cases in
the highway environment is reported. The number of active users is considered equal to 2
in all simulated cases. Focusing mainly on this Figure, it can be seen that as the number of
cooperators increases, the PER values decrease considerably for fixed E
b
/N
0
values and, in
particular, it can be noted that, the case considering 4 cooperators has a PER floor at about
2
· 10
−3
for E
b
/N
0
values starting from 2 dB with respect to the no cooperation case which
0
0.2
0.4
0.6
0.8
1
1.2
1.4
1.6
1.8
0 5 10 15 20 25
Received Power
Time ms
Active Terminal n.1
Cooperator A helps Terminal n.1
Cooperator B helps Terminal n.1
(a) Active user: User1
0
0.2
0.4
0.6
0.8
1
1.2
1.4
1.6
1.8
0 5 10 15 20 25
Received Power
Time ms
Active Terminal n.2
Cooperator A helps Terminal n.2
Cooperator B helps Terminal n.2
(b) Active user: User2
Fig. 9. Received signal power of Active user, Cooperator A and Cooperator B
has, instead, a PER floor at 1.1
· 10
−1
. The presence of PER floors is due to the occurrence,
with the given probabilities already shown in Table 1, of Shadowed and Blocked state channel
conditions. However, the context taken into account for satellite broadband communications
is, mainly, that of elastic IP traffic generated by applications like e-mail, web browsing, FTP
and TELNET services, which are not completely compromised by a delay, loss or bandwidth
limitations, due also to the occurrence of NLOS channel conditions. For these reasons, it is
worth analysing how the cooperation strategy affects the system performance when the satel-
lite channel is only in LOS or in NLOS conditions in order to evaluate the realistic behaviour
of the system which works for the most part of the time in LOS conditions. The LOS state is,
as a matter of facts, the state with the highest absolute probability (89.22% in the considered
highway environment).
Fig. 11 shows, therefore, a comparison in terms of PER between no cooperation and coop-
eration (4 cooperators) cases considering the satellite channel being only in the LOS state or
Cooperative Strategies for Satellite Access 69
• f
d
= v · f
0
/c
• 2φ
= θ
3 dB
= 70λ/D
• D
= 65 cm
being D the antenna diameter, v the terminal speed defined above and f
0
= c/λ, the carrier
frequency at Ku band equal to 14 GHz.
4.1 Selective Forwarding Cooperation for Critical Satellite Scenarios
The analysis considers the adoption, in the scenario described above, of a cooperative strat-
egy which allows the users to share the uplink effort according to the Selective Forwarding
cooperation scheme. Fig. 8 shows an example of the used procedure which describes how
the resources are allocated and managed in the TDMA scheme. Groups of timeslots, named
frames, are assigned to active users and cooperators in order that they can transmit their traffic
bursts (in the following named simply “packets”).
User 1
User 2
Coop A Coop B
Frame 1
Frame 2
Frame 3 Frame 4
Fig. 8. Example of timeslot assignation in a superframe: 2 active users and 2 cooperators
Within each superframe, the active users (User1 and User2) convey their informative pack-
ets while the cooperators (Coop A and Coop B) repeat each one half User1’s packets and half
User2’s packets in an alternate way. In particular, Coop A retransmits before a User1’s packet
and then a User2’s packet, whereas, vice versa, Coop B starts repeating before a User2’s packet
and then a User1’s packet. Hence, in this case, two replicas of the same packet for each active
user are sent through the satellite and the receiver can apply a CRC mechanism in order to
detect the correct packets among those received. Such a method can be simply extended to a
different number of active users and cooperators.
The benefits of this procedure can be assessed observing Fig. 9 wherein the received signal
power of each active user and its cooperators, is reported. In some time portions, in fact, the
cooperators can experiment better satellite channel conditions than the active users and their
retransmission of packets becomes fundamental in order to not to lose some pieces of infor-
mation sent by the active users. The receiver can process differently corrupted replicas of the
same packet and the probability to detect packets successfully increases considerably.
In the model, the terrestrial wireless links between active users and cooperators, used to share
packets, are characterized by error-free conditions in order to evaluate the efficiency of the
cooperative strategy in the satellite land-vehicular scenario.
In the following, some results achieved through computer simulations are presented. First of
all, it is shown how the number of involved cooperators affects the system performance. In
particular, in Fig. 10, the performance comparison in terms of average PER (Packet Error Rate)
between the no cooperation and cooperation (with 2 cooperators and 4 cooperators) cases in
the highway environment is reported. The number of active users is considered equal to 2
in all simulated cases. Focusing mainly on this Figure, it can be seen that as the number of
cooperators increases, the PER values decrease considerably for fixed E
b
/N
0
values and, in
particular, it can be noted that, the case considering 4 cooperators has a PER floor at about
2
· 10
−3
for E
b
/N
0
values starting from 2 dB with respect to the no cooperation case which
0
0.2
0.4
0.6
0.8
1
1.2
1.4
1.6
1.8
0 5 10 15 20 25
Received Power
Time ms
Active Terminal n.1
Cooperator A helps Terminal n.1
Cooperator B helps Terminal n.1
(a) Active user: User1
0
0.2
0.4
0.6
0.8
1
1.2
1.4
1.6
1.8
0 5 10 15 20 25
Received Power
Time ms
Active Terminal n.2
Cooperator A helps Terminal n.2
Cooperator B helps Terminal n.2
(b) Active user: User2
Fig. 9. Received signal power of Active user, Cooperator A and Cooperator B
has, instead, a PER floor at 1.1
· 10
−1
. The presence of PER floors is due to the occurrence,
with the given probabilities already shown in Table 1, of Shadowed and Blocked state channel
conditions. However, the context taken into account for satellite broadband communications
is, mainly, that of elastic IP traffic generated by applications like e-mail, web browsing, FTP
and TELNET services, which are not completely compromised by a delay, loss or bandwidth
limitations, due also to the occurrence of NLOS channel conditions. For these reasons, it is
worth analysing how the cooperation strategy affects the system performance when the satel-
lite channel is only in LOS or in NLOS conditions in order to evaluate the realistic behaviour
of the system which works for the most part of the time in LOS conditions. The LOS state is,
as a matter of facts, the state with the highest absolute probability (89.22% in the considered
highway environment).
Fig. 11 shows, therefore, a comparison in terms of PER between no cooperation and coop-
eration (4 cooperators) cases considering the satellite channel being only in the LOS state or
Satellite Communications70
1e-06
1e-05
1e-04
1e-03
1e-02
1e-01
1e+00
1e+01
0 5 10 15 20
PER
Eb/No [dB]
HIGHWAY 3 states-no coop:PER ATM 1/3 192000
HIGHWAY 3 states-2coop:PER ATM 1/3 192000
HIGHWAY 3 states-4coop:PER ATM 1/3 192000
Fig. 10. PER performance for ATM cell, code rate 1/3, data rate 192 kbit/s, HIGHWAY envi-
ronment: 3 states - Ideal case 4 cooperators, 2 cooperators and no cooperation cases
only in the Shadowed state. The Blocked state, as already said, is characterised by no signal
availability so the achieved BER (Bit Error Rate) values are equal to 0.5.
The results concerning the LOS state are encouraging because they show that the adoption of
the cooperation (4 cooperators) allows improving the system performance achieving the PER
value 10
−6
with a gain equal to 1.4 dB with respect to the case of absence of cooperation.
1e-08
1e-07
1e-06
1e-05
1e-04
1e-03
1e-02
1e-01
1e+00
1e+01
0 1 2 3 4 5 6 7 8
PER
Eb/No [dB]
HIGHWAY LOS state-no coop:PER ATM 1/3 192000
HIGHWAY LOS state-4coop:PER ATM 1/3 192000
HIGHWAY SHADOWED state-no coop:PER ATM 1/3 192000
HIGHWAY SHADOWED state-4coop:PER ATM 1/3 192000
Fig. 11. PER performance for ATM cell, code rate 1/3, data rate 192 kbit/s, HIGHWAY envi-
ronment: LOS state and Shadowed state - Ideal case 4 cooperators and no cooperation cases
4.2 Coded-Cooperation in Mobile Satellite Systems
In the following, the adoption of Coded-Cooperation in the same return link scenario previ-
ously described, is taken into account. In this case, the analysis starts considering the i-th user
(with i
= 1 . . . N
u
) which aims at transmitting a message of size k bits. The message is first
encoded by the physical layer encoder, obtaining the codeword c
(i) of size n bits. Once all
1e-07
1e-06
1e-05
1e-04
1e-03
1e-02
1e-01
1e+00
1e+01
1e+02
0 2 4 6 8 10 12 14
CER
Eb/No [dB]
COOP RANDOM HIGHWAY 16 USERS:FER ATM 1/3 192000
COOP BLOCK INTER HIGHWAY 16 USERS:FER ATM 1/3 192000
COOP BLOCK HIGHWAY 16 USERS:FER ATM 1/3 192000
NO COOPERATION HIGHWAY:FER ATM 1/3 192000
AWGN+BEC CHANNEL - ERASURE RATE: 0.1
Fig. 12. Performance comparison in terms of CER between cooperative (16 users) and non-
cooperative schemes for ATM cell, code rate 1/3, data rate 192 kbit/s: HIGHWAY environ-
ment
codewords c
(i) are ready, they are exchanged through terrestrial links among the N
u
users.
At each user i, each generic message c
(j) coming from the other users, is divided in N
u
sub-
blocks, c
(j) = [c
1
(j), c
2
(j), . . . , c
N
u
(j)]. A new vector bit x(i), hereafter referred to as combined
codeword
2
, is then produced by the generic i-th user by combining N
u
sub-blocks belonging
to different users’ codewords. The vector x
(i) is, then, sent by the i-th user through the satel-
lite link. The selection of the sub-blocks involved in the combined codewords can be based on
predefined or random patterns depending on the considered Coded-Cooperation scheme, under
the constraint that all the sub-blocks of a codeword c
(i) are sent through different combined
codewords.
Some results which prove the effectiveness of such a procedure are presented in the follow-
ing. Performance has been analysed in terms of CER (Codeword Error Rate) vs. E
b
/N
0
at the
output of the FEC decoder in the gateway. In the plot in Fig. 12, a comparison among three
different coded-cooperative schemes considering sixteen users, and the non-cooperative case
is reported. In the first two schemes, named cooperation block and cooperation block inter, the
codeword of the i-th user, constituted by a systematic part and a parity part, is divided in as
many portions as the number of cooperative users and each of them transmits a combined
codeword, as previously explained. The difference between these two schemes is in the rule
that assigns each portion of the original codeword to each user. In the first scheme, a simple
rule is used: the first user transmits the first portion of the systematic part and the first portion
of the parity part of all codewords, the second one transmits the second portion of both parts
and so on for all users. In the second scheme, instead, the portions sent by each user are as-
signed pseudo-randomly bearing however in mind that all sub-blocks of each codeword c
(i)
shall be transmitted. So, for instance, the first user transmits the first portion of systematic
part but not the first one of the parity part. In the third scheme, named cooperation random,
the partitioning of the codeword between systematic part and parity part is not considered
2
Note that a combined codeword does not belong to a specific code book, i.e. it is not a result of an
encoding procedure. It represents a concatenation of portions belonging to different actual codewords.
Cooperative Strategies for Satellite Access 71
1e-06
1e-05
1e-04
1e-03
1e-02
1e-01
1e+00
1e+01
0 5 10 15 20
PER
Eb/No [dB]
HIGHWAY 3 states-no coop:PER ATM 1/3 192000
HIGHWAY 3 states-2coop:PER ATM 1/3 192000
HIGHWAY 3 states-4coop:PER ATM 1/3 192000
Fig. 10. PER performance for ATM cell, code rate 1/3, data rate 192 kbit/s, HIGHWAY envi-
ronment: 3 states - Ideal case 4 cooperators, 2 cooperators and no cooperation cases
only in the Shadowed state. The Blocked state, as already said, is characterised by no signal
availability so the achieved BER (Bit Error Rate) values are equal to 0.5.
The results concerning the LOS state are encouraging because they show that the adoption of
the cooperation (4 cooperators) allows improving the system performance achieving the PER
value 10
−6
with a gain equal to 1.4 dB with respect to the case of absence of cooperation.
1e-08
1e-07
1e-06
1e-05
1e-04
1e-03
1e-02
1e-01
1e+00
1e+01
0 1 2 3 4 5 6 7 8
PER
Eb/No [dB]
HIGHWAY LOS state-no coop:PER ATM 1/3 192000
HIGHWAY LOS state-4coop:PER ATM 1/3 192000
HIGHWAY SHADOWED state-no coop:PER ATM 1/3 192000
HIGHWAY SHADOWED state-4coop:PER ATM 1/3 192000
Fig. 11. PER performance for ATM cell, code rate 1/3, data rate 192 kbit/s, HIGHWAY envi-
ronment: LOS state and Shadowed state - Ideal case 4 cooperators and no cooperation cases
4.2 Coded-Cooperation in Mobile Satellite Systems
In the following, the adoption of Coded-Cooperation in the same return link scenario previ-
ously described, is taken into account. In this case, the analysis starts considering the i-th user
(with i
= 1 . . . N
u
) which aims at transmitting a message of size k bits. The message is first
encoded by the physical layer encoder, obtaining the codeword c
(i) of size n bits. Once all
1e-07
1e-06
1e-05
1e-04
1e-03
1e-02
1e-01
1e+00
1e+01
1e+02
0 2 4 6 8 10 12 14
CER
Eb/No [dB]
COOP RANDOM HIGHWAY 16 USERS:FER ATM 1/3 192000
COOP BLOCK INTER HIGHWAY 16 USERS:FER ATM 1/3 192000
COOP BLOCK HIGHWAY 16 USERS:FER ATM 1/3 192000
NO COOPERATION HIGHWAY:FER ATM 1/3 192000
AWGN+BEC CHANNEL - ERASURE RATE: 0.1
Fig. 12. Performance comparison in terms of CER between cooperative (16 users) and non-
cooperative schemes for ATM cell, code rate 1/3, data rate 192 kbit/s: HIGHWAY environ-
ment
codewords c
(i) are ready, they are exchanged through terrestrial links among the N
u
users.
At each user i, each generic message c
(j) coming from the other users, is divided in N
u
sub-
blocks, c
(j) = [c
1
(j), c
2
(j), . . . , c
N
u
(j)]. A new vector bit x(i), hereafter referred to as combined
codeword
2
, is then produced by the generic i-th user by combining N
u
sub-blocks belonging
to different users’ codewords. The vector x
(i) is, then, sent by the i-th user through the satel-
lite link. The selection of the sub-blocks involved in the combined codewords can be based on
predefined or random patterns depending on the considered Coded-Cooperation scheme, under
the constraint that all the sub-blocks of a codeword c
(i) are sent through different combined
codewords.
Some results which prove the effectiveness of such a procedure are presented in the follow-
ing. Performance has been analysed in terms of CER (Codeword Error Rate) vs. E
b
/N
0
at the
output of the FEC decoder in the gateway. In the plot in Fig. 12, a comparison among three
different coded-cooperative schemes considering sixteen users, and the non-cooperative case
is reported. In the first two schemes, named cooperation block and cooperation block inter, the
codeword of the i-th user, constituted by a systematic part and a parity part, is divided in as
many portions as the number of cooperative users and each of them transmits a combined
codeword, as previously explained. The difference between these two schemes is in the rule
that assigns each portion of the original codeword to each user. In the first scheme, a simple
rule is used: the first user transmits the first portion of the systematic part and the first portion
of the parity part of all codewords, the second one transmits the second portion of both parts
and so on for all users. In the second scheme, instead, the portions sent by each user are as-
signed pseudo-randomly bearing however in mind that all sub-blocks of each codeword c
(i)
shall be transmitted. So, for instance, the first user transmits the first portion of systematic
part but not the first one of the parity part. In the third scheme, named cooperation random,
the partitioning of the codeword between systematic part and parity part is not considered
2
Note that a combined codeword does not belong to a specific code book, i.e. it is not a result of an
encoding procedure. It represents a concatenation of portions belonging to different actual codewords.
Satellite Communications72
1e-08
1e-06
1e-04
1e-02
1e+00
1e+02
0 2 4 6 8 10 12 14
CER
Eb/No [dB]
COOP RANDOM HIGHWAY 4 USERS:FER ATM 1/3 192000
COOP RANDOM HIGHWAY 16 USERS:FER ATM 1/3 192000
COOP RANDOM HIGHWAY 24 USERS:FER ATM 1/3 192000
COOP RANDOM HIGHWAY 32 USERS:FER ATM 1/3 192000
NO COOP HIGHWAY:FER ATM 1/3 192000
AWGN+BEC CHANNEL - ERASURE RATE: 0.1
Fig. 13. Performance in terms of CER of the cooperation random scheme for different number
of users, for ATM cell, code rate 1/3, data rate 192 kbit/s: HIGHWAY environment
anymore. In this case, the codeword portions composing the combined codeword are consti-
tuted by the bits of the original codeword of each user, which are assigned to each user using a
random rule. Thus, the i-th user can transmit a portion composed by as many systematic bits
as parity bits depending on the distribution of the bits that the random rule has generated.
Using this last scheme the highest randomization level is guaranteed and, as it can be seen in
Fig. 12, the deleterious effects of fading can be more effectively counteracted. Also the perfor-
mance over the AWGN (Additive White Gaussian Noise) channel with erasures, in the follow-
ing named AWGN+BEC, is reported. This curve represents a reasonable reference which, for
high E
b
/N
0
values, could be taken as an acceptable lower bound to the system performance:
under the assumption that only the LOS state can be successfully decoded, and in case the di-
versity introduced by cooperation could break any channel correlation effect, each codeword
would in fact virtually face an uncorrelated channel with an erasure rate equal to the NLOS
share, given by the sum of P
SHADOWED
and P
BLOCKED
.
In Fig. 13, the cooperation random scheme is further investigated and it is shown how the num-
ber of users affects the system performance. It can be seen how, as the number of users in-
creases, the CER values decrease for a fixed E
b
/N
0
value. The performance improvement is
more remarkable for increasing E
b
/N
0
values. Using this scheme it is possible to achieve CER
values performing a feasible system which does not present anymore a high floor value as it
is, instead, for the non-cooperative case which has a CER floor at 10
−1
. In particular, it can be
noted that the CER value 10
−5
is achieved for E
b
/N
0
equal to 7.7 dB. This results is encour-
aging also because, if the channel state information were introduced in the simulation model,
the achieved improving could be more relevant.
5. Cooperation Techniques for Downlink Satellite Access
Generally, in a downlink scenario, the link from the satellite to the active terminal is compa-
rable with the links from the satellite to cooperating devices and, therefore, the Amplify and
Forward strategy can be particularly efficient in this kind of scenarios. For this reason, a par-
ticular downlink satellite scenario is taken into account in order to show how the use of such
a strategy can led to improvements in the system performance.
Active
Terminal
Cooperation
Terminal
f
g(1)
g(2)
g(3)
c(1)
c(2)
c(3)
Fig. 14. Downlink Satellite Cooperation Scenario
d
sat
36000 [Km] satellite terminal distance
d
coo p
10 [Km] cooperative terminal
L
sat
-205.34 [dB] satellite terminal path loss
L
coo p
-118.5 [dB] cooperative terminal path loss
B
sat
36 [MHz] transpoder bandwidth
P
sat
70 [dBW] satellite power
P
max
250 [mW] cooperative terminal maximum power
G/T
R x
-24 [dB/K] handheld receiver G/T
T
sys
290 [K] system temperature
F
c
2000 [MHz] cooperation channel frequency
F
d
11750 [MHz] downlink channel frequency
Table 2. Main operational parameters
The adopted downlink cooperation scenario is depicted in Fig. 14. A DVB-S2 hub processes
and sends digital signals to some users grouped in a cluster, through the satellite. A po-
tential mobile DVB-S2 receiver (the active terminal) combines the signals coming from the
satellite and from several mobile cooperators belonging to the same cluster. The satellite-
to-earth link is modelled with a Corazza-Vatalaro process, (Corazza & Vatalaro, 1994), while
the cooperator-to-active user link is represented only by an AWGN channel. The Corazza-
Vatalaro channel model is a combination of a Rice and a Log-normal factors, with shadowing
affecting both direct and diffused components. The cooperative path-loss value of 118 dB,
reported in Table 2, derives from the choice of a cooperation frequency F
c
= 2 GHz and a
cooperator distance d
coop
= 10 Km.
The fading effect on the cooperative links is not considered, as expected in environments
characterized by limited distances (within 10 Km) and good visibility among terminals. The
model considers a time resolution equal to:
1
2B
sgn
=
1
14.8
µs (10)
Cooperative Strategies for Satellite Access 73
1e-08
1e-06
1e-04
1e-02
1e+00
1e+02
0 2 4 6 8 10 12 14
CER
Eb/No [dB]
COOP RANDOM HIGHWAY 4 USERS:FER ATM 1/3 192000
COOP RANDOM HIGHWAY 16 USERS:FER ATM 1/3 192000
COOP RANDOM HIGHWAY 24 USERS:FER ATM 1/3 192000
COOP RANDOM HIGHWAY 32 USERS:FER ATM 1/3 192000
NO COOP HIGHWAY:FER ATM 1/3 192000
AWGN+BEC CHANNEL - ERASURE RATE: 0.1
Fig. 13. Performance in terms of CER of the cooperation random scheme for different number
of users, for ATM cell, code rate 1/3, data rate 192 kbit/s: HIGHWAY environment
anymore. In this case, the codeword portions composing the combined codeword are consti-
tuted by the bits of the original codeword of each user, which are assigned to each user using a
random rule. Thus, the i-th user can transmit a portion composed by as many systematic bits
as parity bits depending on the distribution of the bits that the random rule has generated.
Using this last scheme the highest randomization level is guaranteed and, as it can be seen in
Fig. 12, the deleterious effects of fading can be more effectively counteracted. Also the perfor-
mance over the AWGN (Additive White Gaussian Noise) channel with erasures, in the follow-
ing named AWGN+BEC, is reported. This curve represents a reasonable reference which, for
high E
b
/N
0
values, could be taken as an acceptable lower bound to the system performance:
under the assumption that only the LOS state can be successfully decoded, and in case the di-
versity introduced by cooperation could break any channel correlation effect, each codeword
would in fact virtually face an uncorrelated channel with an erasure rate equal to the NLOS
share, given by the sum of P
SHADOWED
and P
BLOCKED
.
In Fig. 13, the cooperation random scheme is further investigated and it is shown how the num-
ber of users affects the system performance. It can be seen how, as the number of users in-
creases, the CER values decrease for a fixed E
b
/N
0
value. The performance improvement is
more remarkable for increasing E
b
/N
0
values. Using this scheme it is possible to achieve CER
values performing a feasible system which does not present anymore a high floor value as it
is, instead, for the non-cooperative case which has a CER floor at 10
−1
. In particular, it can be
noted that the CER value 10
−5
is achieved for E
b
/N
0
equal to 7.7 dB. This results is encour-
aging also because, if the channel state information were introduced in the simulation model,
the achieved improving could be more relevant.
5. Cooperation Techniques for Downlink Satellite Access
Generally, in a downlink scenario, the link from the satellite to the active terminal is compa-
rable with the links from the satellite to cooperating devices and, therefore, the Amplify and
Forward strategy can be particularly efficient in this kind of scenarios. For this reason, a par-
ticular downlink satellite scenario is taken into account in order to show how the use of such
a strategy can led to improvements in the system performance.
Active
Terminal
Cooperation
Terminal
f
g(1)
g(2)
g(3)
c(1)
c(2)
c(3)
Fig. 14. Downlink Satellite Cooperation Scenario
d
sat
36000 [Km] satellite terminal distance
d
coo p
10 [Km] cooperative terminal
L
sat
-205.34 [dB] satellite terminal path loss
L
coo p
-118.5 [dB] cooperative terminal path loss
B
sat
36 [MHz] transpoder bandwidth
P
sat
70 [dBW] satellite power
P
max
250 [mW] cooperative terminal maximum power
G/T
R x
-24 [dB/K] handheld receiver G/T
T
sys
290 [K] system temperature
F
c
2000 [MHz] cooperation channel frequency
F
d
11750 [MHz] downlink channel frequency
Table 2. Main operational parameters
The adopted downlink cooperation scenario is depicted in Fig. 14. A DVB-S2 hub processes
and sends digital signals to some users grouped in a cluster, through the satellite. A po-
tential mobile DVB-S2 receiver (the active terminal) combines the signals coming from the
satellite and from several mobile cooperators belonging to the same cluster. The satellite-
to-earth link is modelled with a Corazza-Vatalaro process, (Corazza & Vatalaro, 1994), while
the cooperator-to-active user link is represented only by an AWGN channel. The Corazza-
Vatalaro channel model is a combination of a Rice and a Log-normal factors, with shadowing
affecting both direct and diffused components. The cooperative path-loss value of 118 dB,
reported in Table 2, derives from the choice of a cooperation frequency F
c
= 2 GHz and a
cooperator distance d
coop
= 10 Km.
The fading effect on the cooperative links is not considered, as expected in environments
characterized by limited distances (within 10 Km) and good visibility among terminals. The
model considers a time resolution equal to:
1
2B
sgn
=
1
14.8
µs (10)
Satellite Communications74
being B
sgn
the bandwidth of the modulated QPSK signal (FEC = 1/2) considering an useful
data rate of 7.2 Mbaud.
5.1 Amplify and Forward Cooperation for Mobile Satellite Terminals
The basic idea of Amplify and Forward strategy is that around a given terminal, there can be
other single-antenna terminals which can be used to enhance diversity by forming a virtual (or
distributed) multiantenna system where the satellite signal is received from the active termi-
nal and a number of cooperating relays. Cooperating terminals retransmit the received signal
after amplification. As said before, the AF strategy is particularly efficient when cooperat-
ing terminals are located close to the active one so that the cooperative links (c
(1),c(2),c(3)
in Fig. 14) are characterized by high signal-to-noise ratios and the link from the satellite to
the active terminal (f) is comparable with the links from the satellite to cooperating devices
(g
(1),g(2),g(3) in Fig. 14). Starting from Eq. (2), the considered amplification factor A is given
by:
A
2
i
=
P
max
P
sat
|g(i)|
2
+ N
(11)
where P
sat
is the satellite downlink power and P
max
the cooperative terminal maximum power,
g
(i) the i-th link pathloss and N = KT
sys
B
sat
the noise power at the earth terminals.
With this choice, the resulting C/N on the active terminal is given by the following expres-
sion, assuming that all of the cooperating terminals, M, have the same characteristics and the
cooperative channels, c, are similar:
C
N
=
P
sat
|f |
2
N
(1 + M
A
2
|c|
2
1 + A
2
|c|
2
) (12)
0 5 10 15 20
10
−3
10
−2
10
−1
10
0
E
b
/N
0
(dB)
BER
10 cooperators
5 cooperators
no cooperation
15 cooperators
Fig. 15. BER performance: QPSK, 5 −10 −15 cooperators, R = 1
System performance has been analysed in terms of BER and the resulting BER versus E
b
/N
0
curves for different configurations have been plotted. The curves of Fig. 15 show the advan-
tages deriving from the use of the cooperation AF with a QPSK modulation for various num-
ber of cooperators (5, 10 and 15). All the handsets share the same Rice factor R
= 1 (medium
0 5 10 15 20
10
−4
10
−3
10
−2
10
−1
10
0
E
b
/N
0
(dB)
BER
shadowing R=1
light shadowing R=4
heavy shadowing R=0.6
Fig. 16. BER performance: QPSK for variable Rice Factor R = 0.6 −1 −4 and 10 cooperators
shadowing), modeling the situation where the consumers cooperators all work under homo-
geneous operational conditions. Fig. 16 shows QPSK performances obtained by varying the
Rice factor R. The case of heavy shadowing (R
= 0.6), medium shadowing (R = 1) and
light shadowing (R
= 4) are compared. For R = 4 the performance is close to the target
(BER
= 10
−4
), while for R = 0.6 the BER values are higher than target, resulting unacceptable
for the DVB-S2 system.
0 5 10 15 20
10
−3
10
−2
10
−1
10
0
E
b
/N
0
(dB)
BER
all handsets in shadowing
5 handsets in shadowing
only active terminal in shadowing
Fig. 17. BER performance: QPSK, varying handset number in heavy shadowing for R = 0.6
Finally, Fig. 17 shows the BER performance in the case a varying number of handsets are in
heavy shadowing (R
= 0.6) while the remaining ones have R = 1. By considering such a less
critical situation, where only a subset of cooperating terminals are subject to heavy shadow-
ing, it can be seen that the system performance improves.
Cooperative Strategies for Satellite Access 75
being B
sgn
the bandwidth of the modulated QPSK signal (FEC = 1/2) considering an useful
data rate of 7.2 Mbaud.
5.1 Amplify and Forward Cooperation for Mobile Satellite Terminals
The basic idea of Amplify and Forward strategy is that around a given terminal, there can be
other single-antenna terminals which can be used to enhance diversity by forming a virtual (or
distributed) multiantenna system where the satellite signal is received from the active termi-
nal and a number of cooperating relays. Cooperating terminals retransmit the received signal
after amplification. As said before, the AF strategy is particularly efficient when cooperat-
ing terminals are located close to the active one so that the cooperative links (c
(1),c(2),c(3)
in Fig. 14) are characterized by high signal-to-noise ratios and the link from the satellite to
the active terminal (f) is comparable with the links from the satellite to cooperating devices
(g
(1),g(2),g(3) in Fig. 14). Starting from Eq. (2), the considered amplification factor A is given
by:
A
2
i
=
P
max
P
sat
|g(i)|
2
+ N
(11)
where P
sat
is the satellite downlink power and P
max
the cooperative terminal maximum power,
g
(i) the i-th link pathloss and N = KT
sys
B
sat
the noise power at the earth terminals.
With this choice, the resulting C/N on the active terminal is given by the following expres-
sion, assuming that all of the cooperating terminals, M, have the same characteristics and the
cooperative channels, c, are similar:
C
N
=
P
sat
|f |
2
N
(1 + M
A
2
|c|
2
1 + A
2
|c|
2
) (12)
0 5 10 15 20
10
−3
10
−2
10
−1
10
0
E
b
/N
0
(dB)
BER
10 cooperators
5 cooperators
no cooperation
15 cooperators
Fig. 15. BER performance: QPSK, 5 −10 −15 cooperators, R = 1
System performance has been analysed in terms of BER and the resulting BER versus E
b
/N
0
curves for different configurations have been plotted. The curves of Fig. 15 show the advan-
tages deriving from the use of the cooperation AF with a QPSK modulation for various num-
ber of cooperators (5, 10 and 15). All the handsets share the same Rice factor R
= 1 (medium
0 5 10 15 20
10
−4
10
−3
10
−2
10
−1
10
0
E
b
/N
0
(dB)
BER
shadowing R=1
light shadowing R=4
heavy shadowing R=0.6
Fig. 16. BER performance: QPSK for variable Rice Factor R = 0.6 −1 −4 and 10 cooperators
shadowing), modeling the situation where the consumers cooperators all work under homo-
geneous operational conditions. Fig. 16 shows QPSK performances obtained by varying the
Rice factor R. The case of heavy shadowing (R
= 0.6), medium shadowing (R = 1) and
light shadowing (R
= 4) are compared. For R = 4 the performance is close to the target
(BER
= 10
−4
), while for R = 0.6 the BER values are higher than target, resulting unacceptable
for the DVB-S2 system.
0 5 10 15 20
10
−3
10
−2
10
−1
10
0
E
b
/N
0
(dB)
BER
all handsets in shadowing
5 handsets in shadowing
only active terminal in shadowing
Fig. 17. BER performance: QPSK, varying handset number in heavy shadowing for R = 0.6
Finally, Fig. 17 shows the BER performance in the case a varying number of handsets are in
heavy shadowing (R
= 0.6) while the remaining ones have R = 1. By considering such a less
critical situation, where only a subset of cooperating terminals are subject to heavy shadow-
ing, it can be seen that the system performance improves.
Satellite Communications76
6. Conclusion
This chapter has presented the possible adoption of cooperation strategies in satellite access,
focusing on two case studies showing an uplink and downlink mobile satellite scenario. The
use of these different techniques and methodologies in various applications scenarios, can led
to the achievement of improvement of the system performance in terms of Bit Error Rate and
Packet Error Rate.
In particular, in the uplink scenario, the introduction of the Coded-Cooperation for DVB-RCS
terminals working in a land vehicular scenario, allows improving considerably, for increasing
E
b
/N
0
values, the system performance compared with the non-cooperative system, especially
if a codeword partitioning scheme maximising the level of randomness in the distribution of
the sub-blocks among different users is adopted. In the best simulated scenario, if it is consid-
ered a Codeword Error Rate value of 10
−5
, the system performance is, however, still roughly
3.8 dB away from the reference (AWGN with erasure rate equal to NLOS share) case, leav-
ing significant room for further optimisation of the system. However, a trade-off between the
number of cooperative users, the resulting system complexity and the achievable performance
is necessary. Moreover, also the adoption of a Selective Forwarding cooperation in a DVB-RCS
land-vehicular scenario, allows improving sensibly the system performance in the considered
environments, depending on the number of users involved in the cooperation process. The
simulation results have shown that, considering 4 cooperators which cooperate with 2 active
users, a cooperation gain equal to 1.4 dB can be achieved with respect to the case of absence
of cooperation.
As what concerns, instead, the downlink scenario the idea was to build a cooperation among
a set of mobile terminals, in a way that the signal received by each single device is the result
of the composition of more replicas of the same signal sent by other cooperating devices. Link
cooperation, in this case, enables the reception of satellite services from handheld terminals
when a cluster of cooperating users is present.
7. References
Alamouti, S. M. (1998). A Simple Transmit Diversity Technique for Wireless Communications,
IEEE Journal on Selected areas in Communications, Vol. 16, pp. 1451-1458, October 1998.
Corazza, G. & Vatalaro, F. (1994). A Statistical Model for Land Mobile Satellite Channels and
Its Applications to Nongeostationary Orbit Systems, IEEE Transactions on Vehicular
Technology, vol. 43, pp. 738-741, August 1994.
Darmawan, A. & Kim, S.W. & Morikawa, H. (2007). Amplify-and-Forward Scheme in Cooper-
ative Spatial Multiplexing, 16th IST Mobile and Wireless Communications Summit, July
2007, Budapest, Hungary.
Dubey, V.K. & Wee Teck Ng, (2002). Comments on On the Doppler spectrum at the mobile
unit employing a directional antenna, IEEE Communication Letters, Vol. 6, No. 11, pp.
472-474, November 2002.
Ernst, H. & Harles, G. & Scalise, S. (2008). Measurement and Modelling of the Land Mobile
Satellite Channel at Ku-Band, IEEE Transactions on Vehicular Technology, Vol. 57, No.
2, pp. 693-703, March 2008.
ETSI EN 301 790 v 1.4.1 (2005). Digital Video Broadcasting (DVB): Interaction channel for
satellite distribution systems, September 2005.
ETSI EN 302 307 v 1.2.1 (2009). Digital Video Broadcasting (DVB): Second generation framing
structure, channel coding and modulation system for Broadcasting, Interactive Ser-
vices, News Gathering and other broadband satellite applications (DVB-S2), August
2009.
Finn, M.I. & Flemming, H. (1977). Mobile Fading-Rayleigh and Lognormal Superimposed,
IEEE Transactions on Vehicular Technology, Vol. 26, No. 4, pp. 332-335, November 1977.
Hunter, T.E. & Nosratinia, A. (2002). Cooperation Diversity through Coding, IEEE International
Symposium on Information Theory (ISIT), July 2002, Lausanne, Switzerland.
Hunter, T.E. & Nosratinia, A. (2006). Diversity through Coded Cooperation, IEEE Transaction
on Wireless Communications, Vol. 5, No. 2, pp. 283-289, February 2006.
Janani, M. & Hedayat, A. & Hunter, T.E. & Nosratinia, A. (2004). Coded Cooperation in Wire-
less Communications: Space-Time Transmission and Iterative Decoding, IEEE Trans-
action on Signal Processing, Vol. 52, No. 2, pp. 362-371, February 2004.
Laneman, J.N. & Tse, D.N.C. & Wornell, G.W. (2004). Cooperative Diversity in Wireless Net-
works: Efficient Protocols and Outage Behavior, IEEE Transaction on Information The-
ory, Vol. 50, No. 12, pp. 3062-3080, December 2004.
Law, C.L. & Yoshida, S. & Xu, C.Q. (2001). On the Doppler power spectrum at the mobile unit
employing a directional antenna, IEEE Communication Letters, Vol. 5, No. 1, pp. 13-15,
January 2001.
Lee, D.K. & Chugg, K.M. (2006). A Pragmatic Approach to Cooperative Communication, IEEE
Military Communications Conference (MILCOM), October 2006, Washington, D.C.
Lin, D.B. & Lin, H.P. & Tseng, M.C. (2005). Performance analysis of M-ary PSK adaptive mod-
ulation system over Rayleigh-lognormal fading channel, IEEE Vehicular Technology
Conference Spring (VTC2005Spring), May 2005, Stockholm, Sweden.
Nosratinia, A. & Hunter, T.E. & Hedayat, A. (2004). Cooperative Communication in Wireless
Networks, IEEE Communications Magazine, Vol. 42, No. 10, pp. 74-80, October 2004.
Pätzold, M. (2002). Mobile Fading Channels, Wiley, January 2002.
Ribeiro, A. & Giannakis, G.B. (2006). Fixed and Random Access Cooperative Networks,
EURASIP Newsletter, pp. 3-24, March 2006.
Sendonaris, A. & Erkip, E. & Aazhang, B. (2003). User cooperation diversity - part I: Sys-
tem Description, IEEE Transactions on Communications, Vol. 51, No. 11, pp. 1927-1938,
November 2003.
Sendonaris, A. & Erkip, E. & Aazhang, B. (2003). User cooperation diversity - part II: Imple-
mentation Aspects and Performance Analysis, IEEE Transactions on Communications,
Vol. 51, No. 11, pp. 1939-1948, November 2003.
Suzuki, H. (1977). A Statistical Model for Urban Radio Propagation, IEEE Transactions on Com-
munications, Vol. 25, No. 7, pp. 673-680, July 1977.
Cooperative Strategies for Satellite Access 77
6. Conclusion
This chapter has presented the possible adoption of cooperation strategies in satellite access,
focusing on two case studies showing an uplink and downlink mobile satellite scenario. The
use of these different techniques and methodologies in various applications scenarios, can led
to the achievement of improvement of the system performance in terms of Bit Error Rate and
Packet Error Rate.
In particular, in the uplink scenario, the introduction of the Coded-Cooperation for DVB-RCS
terminals working in a land vehicular scenario, allows improving considerably, for increasing
E
b
/N
0
values, the system performance compared with the non-cooperative system, especially
if a codeword partitioning scheme maximising the level of randomness in the distribution of
the sub-blocks among different users is adopted. In the best simulated scenario, if it is consid-
ered a Codeword Error Rate value of 10
−5
, the system performance is, however, still roughly
3.8 dB away from the reference (AWGN with erasure rate equal to NLOS share) case, leav-
ing significant room for further optimisation of the system. However, a trade-off between the
number of cooperative users, the resulting system complexity and the achievable performance
is necessary. Moreover, also the adoption of a Selective Forwarding cooperation in a DVB-RCS
land-vehicular scenario, allows improving sensibly the system performance in the considered
environments, depending on the number of users involved in the cooperation process. The
simulation results have shown that, considering 4 cooperators which cooperate with 2 active
users, a cooperation gain equal to 1.4 dB can be achieved with respect to the case of absence
of cooperation.
As what concerns, instead, the downlink scenario the idea was to build a cooperation among
a set of mobile terminals, in a way that the signal received by each single device is the result
of the composition of more replicas of the same signal sent by other cooperating devices. Link
cooperation, in this case, enables the reception of satellite services from handheld terminals
when a cluster of cooperating users is present.
7. References
Alamouti, S. M. (1998). A Simple Transmit Diversity Technique for Wireless Communications,
IEEE Journal on Selected areas in Communications, Vol. 16, pp. 1451-1458, October 1998.
Corazza, G. & Vatalaro, F. (1994). A Statistical Model for Land Mobile Satellite Channels and
Its Applications to Nongeostationary Orbit Systems, IEEE Transactions on Vehicular
Technology, vol. 43, pp. 738-741, August 1994.
Darmawan, A. & Kim, S.W. & Morikawa, H. (2007). Amplify-and-Forward Scheme in Cooper-
ative Spatial Multiplexing, 16th IST Mobile and Wireless Communications Summit, July
2007, Budapest, Hungary.
Dubey, V.K. & Wee Teck Ng, (2002). Comments on On the Doppler spectrum at the mobile
unit employing a directional antenna, IEEE Communication Letters, Vol. 6, No. 11, pp.
472-474, November 2002.
Ernst, H. & Harles, G. & Scalise, S. (2008). Measurement and Modelling of the Land Mobile
Satellite Channel at Ku-Band, IEEE Transactions on Vehicular Technology, Vol. 57, No.
2, pp. 693-703, March 2008.
ETSI EN 301 790 v 1.4.1 (2005). Digital Video Broadcasting (DVB): Interaction channel for
satellite distribution systems, September 2005.
ETSI EN 302 307 v 1.2.1 (2009). Digital Video Broadcasting (DVB): Second generation framing
structure, channel coding and modulation system for Broadcasting, Interactive Ser-
vices, News Gathering and other broadband satellite applications (DVB-S2), August
2009.
Finn, M.I. & Flemming, H. (1977). Mobile Fading-Rayleigh and Lognormal Superimposed,
IEEE Transactions on Vehicular Technology, Vol. 26, No. 4, pp. 332-335, November 1977.
Hunter, T.E. & Nosratinia, A. (2002). Cooperation Diversity through Coding, IEEE International
Symposium on Information Theory (ISIT), July 2002, Lausanne, Switzerland.
Hunter, T.E. & Nosratinia, A. (2006). Diversity through Coded Cooperation, IEEE Transaction
on Wireless Communications, Vol. 5, No. 2, pp. 283-289, February 2006.
Janani, M. & Hedayat, A. & Hunter, T.E. & Nosratinia, A. (2004). Coded Cooperation in Wire-
less Communications: Space-Time Transmission and Iterative Decoding, IEEE Trans-
action on Signal Processing, Vol. 52, No. 2, pp. 362-371, February 2004.
Laneman, J.N. & Tse, D.N.C. & Wornell, G.W. (2004). Cooperative Diversity in Wireless Net-
works: Efficient Protocols and Outage Behavior, IEEE Transaction on Information The-
ory, Vol. 50, No. 12, pp. 3062-3080, December 2004.
Law, C.L. & Yoshida, S. & Xu, C.Q. (2001). On the Doppler power spectrum at the mobile unit
employing a directional antenna, IEEE Communication Letters, Vol. 5, No. 1, pp. 13-15,
January 2001.
Lee, D.K. & Chugg, K.M. (2006). A Pragmatic Approach to Cooperative Communication, IEEE
Military Communications Conference (MILCOM), October 2006, Washington, D.C.
Lin, D.B. & Lin, H.P. & Tseng, M.C. (2005). Performance analysis of M-ary PSK adaptive mod-
ulation system over Rayleigh-lognormal fading channel, IEEE Vehicular Technology
Conference Spring (VTC2005Spring), May 2005, Stockholm, Sweden.
Nosratinia, A. & Hunter, T.E. & Hedayat, A. (2004). Cooperative Communication in Wireless
Networks, IEEE Communications Magazine, Vol. 42, No. 10, pp. 74-80, October 2004.
Pätzold, M. (2002). Mobile Fading Channels, Wiley, January 2002.
Ribeiro, A. & Giannakis, G.B. (2006). Fixed and Random Access Cooperative Networks,
EURASIP Newsletter, pp. 3-24, March 2006.
Sendonaris, A. & Erkip, E. & Aazhang, B. (2003). User cooperation diversity - part I: Sys-
tem Description, IEEE Transactions on Communications, Vol. 51, No. 11, pp. 1927-1938,
November 2003.
Sendonaris, A. & Erkip, E. & Aazhang, B. (2003). User cooperation diversity - part II: Imple-
mentation Aspects and Performance Analysis, IEEE Transactions on Communications,
Vol. 51, No. 11, pp. 1939-1948, November 2003.
Suzuki, H. (1977). A Statistical Model for Urban Radio Propagation, IEEE Transactions on Com-
munications, Vol. 25, No. 7, pp. 673-680, July 1977.
Satellite Communications78
MIMO Channel Models for Satellite Communications 79
MIMO Channel Models for Satellite Communications
Abbas Mohammed and Asad Mehmood
X
MIMO Channel Models
for Satellite Communications
Abbas Mohammed and Asad Mehmood
Blekinge Institute of Technology
Sweden
1. Introduction
In recent years considerable attention has been drawn to the systems with multiple element
transmitter and receiver arrays. It has been demonstrated both in theory and practice that
multiple-input multiple-output (MIMO) systems offer the promise of increased capacity,
high spectral efficiency and high gains by exploiting space-time processing techniques in
particular space-time coding (STC) techniques under different propagation environments.
This superior performance is achieved by the decomposition of the radio channel into a set
of independent spatially uncorrelated channels. The basic method to achieve diverse
channels, in addition to the exploitation of time and frequency dimensions, is to use the
additional dimension of space, i.e., antennas are spatially separated from each other
resulting in space-time processing. The advantages obtained by MIMO channels are highly
dependent on the orientations of scatterers and the correlations among signal carriers which
limit the performance of MIMO systems. The antenna separation, in terms of wavelength of
the operating frequency, has significant impact on the spatial correlation. To achieve
uncorrelated fading paths adequate antenna spacing along with rich scattering environment
is necessary. An alternative solution to achieve low fading correlation is to use antenna
arrays with cross polarizations, i.e., antenna arrays with polarizations in orthogonal or near
orthogonal orientations without increasing the bandwidth and in particular, the concept of
three-dimensional (3D) polarization has a significant role in achieving diversity by
polarization. It has been shown in recent research that it is possible to attain even more
channels by using benefits of the combined spatial and polarization diversity in rich
scattering environments.
Satellite communication systems are not immune from this wave of innovation. However,
due to difference in the propagation conditions in satellite and terrestrial links, the
applicability and designs of MIMO systems are different as well. Due to very large path
lengths, transmit and/or receive antennas must be placed at appropriate distances from
each other to realize diverse paths. To achieve this, the possible diversity sources, i.e.,
satellite diversity and site diversity can be exploited in forming the MIMO channels for
satellites. In the case of satellite diversity, the satellites are far apart from each other to
achieve diversity and as a result the path lengths and the time of arrival of signals can vary
4
Satellite Communications80
vastly between the satellites and the ground terminals resulting in synchronization problem.
These issues can be dealt with by employing cooperative satellite diversity concept or the
use of compact antennas in which the problem of synchronization does not exist. The frame
work for the most recent developments in satellite communications includes satellite land
mobile and fixed communication systems, satellite navigation systems, Earth Observation
systems and the state of art propagation models and evaluation tools for these systems. The
influence of radio channel is a critical issue for the design, performance assessment and real-
time operation of these highly reconfigurable hybrid (satellite and terrestrial) radio
networks providing voice, text and multimedia services operating at RF frequencies ranging
from 100 MHz to 100 GHz and optical frequencies.
The organization of the chapter is as follows: in section 2, a brief introduction to directional
channel modelling including MIMO channel modelling is presented. In section 3 we present
an overview of MIMO channel models for satellite communications. Section 4 describes
MIMO channel models for satellites based on polarization concept. Finally, conclusions and
suggestions are given in section 5.
2. Directional Channel Modelling
The difficulties in modelling a radio channel are due to complex and varying propagation
environments. In case of land mobile satellite (LMS) communications the signal travelling
between a land mobile and a satellite suffers from different propagation impairments
(chapter 1). The diverse nature of propagation media (e.g., ionosphere, troposphere and
local effects) adds further a dimension of complexity in predicting the affects of propagation
impairments on radio signals. It is important to note that the level of information obtained
from a channel model about an environment is highly dependent on the type of system
under assessment. In order to predict the performance of single sensor narrowband system
it may be sufficient to consider the time varying amplitude distribution and the received
signal power. Thus, classical channel models which provide information about signal power
level distributions and Doppler shifts may be adequate for narrowband systems. Broadband
communication systems build on the classical understanding of the received signal power
distributions and Doppler spread also exploit spatial processing to operate in highly
complex and diverse propagation environments. Thus, it is necessary to incorporate new
concepts such as adaptive antenna arrays, angles of arrival (AoA), angles of departure
(AoD), delay spread and multiple antennas at both the ends of a communication link, the so-
called MIMO systems.
When investigating MIMO channels, the additional dimension that comes into play is space
which needs to be modelled in a similar way as frequency and time variations have been
modelled for the wideband single-input single-output (SISO) systems. In contrast to the
systems which deal with only temporal spreading, the MIMO channels require the angular
distribution of energy at both the ends of the communication link. The impulse response of
the double directional channel between a transmitter positioned at
t
P and a receiver
positioned at
r
P with n paths in 3D space can be written as (Steinbauer et al., 2001):
n
i
rtrtirtrt
pphPPh
1
),,,,(),,,,(
(1)
where
,
t
and
r
denote the delay, AoD and AoA, both in 3D space, respectively and
i
h is the contribution of the
th
i component, i.e.,
)()()(),,,,(
,, irritti
ij
irtrti
epph
(2)
where
,
i
,
i
,
i
it ,
and
ir,
represent the amplitude, phase, time delay, AoD and AoA
of the
th
i
multipath contribution, respectively.
These parameters are determined by the relative location of the transmitter and the receiver.
When either the transmitter or the receiver moves, these variables become a function of time
and can change drastically over large periods of time (long distances). Therefore a more
compact representation of time variant double-directional channel impulse response is
given by,
n
i
rtkrt
thth
1
),,,(),,,(
(3)
In addition to these parameters, the double directional channel impulse response is also
dependent on the antenna patterns and the modelling bandwidth.
2.1 The MIMO Propagation Channel
If multiple antennas are deployed at both the ends of a communication link, a MIMO system
is obtained as shown in Fig. 1. The key idea underlying MIMO theory is that signals
sampled in the spatial domain at both the ends are combined in such a way that multiple
parallel channels are created. The double-direction description of the channel can be
extended to MIMO channel by considering
t
n transmit and
r
n receive spatially separated
antennas at both the ends. The corresponding MIMO channel matrix can be defined as:
),(),(),(
),(),(),(
),(),(),(
),(
21
22221
11211
ththth
ththth
ththth
tH
nmnn
m
m
(4)
where
(.)
nm
h denotes the narrowband channel (wide sense stationary uncorrelated
scattering process) between the
th
m transmit and
th
n receive antenna. The elements of the
channel matrix (i.e., individual narrowband SISO channels) are taken as independent
circularly symmetric complex Gaussian variables with equal variance.
MIMO Channel Models for Satellite Communications 81
vastly between the satellites and the ground terminals resulting in synchronization problem.
These issues can be dealt with by employing cooperative satellite diversity concept or the
use of compact antennas in which the problem of synchronization does not exist. The frame
work for the most recent developments in satellite communications includes satellite land
mobile and fixed communication systems, satellite navigation systems, Earth Observation
systems and the state of art propagation models and evaluation tools for these systems. The
influence of radio channel is a critical issue for the design, performance assessment and real-
time operation of these highly reconfigurable hybrid (satellite and terrestrial) radio
networks providing voice, text and multimedia services operating at RF frequencies ranging
from 100 MHz to 100 GHz and optical frequencies.
The organization of the chapter is as follows: in section 2, a brief introduction to directional
channel modelling including MIMO channel modelling is presented. In section 3 we present
an overview of MIMO channel models for satellite communications. Section 4 describes
MIMO channel models for satellites based on polarization concept. Finally, conclusions and
suggestions are given in section 5.
2. Directional Channel Modelling
The difficulties in modelling a radio channel are due to complex and varying propagation
environments. In case of land mobile satellite (LMS) communications the signal travelling
between a land mobile and a satellite suffers from different propagation impairments
(chapter 1). The diverse nature of propagation media (e.g., ionosphere, troposphere and
local effects) adds further a dimension of complexity in predicting the affects of propagation
impairments on radio signals. It is important to note that the level of information obtained
from a channel model about an environment is highly dependent on the type of system
under assessment. In order to predict the performance of single sensor narrowband system
it may be sufficient to consider the time varying amplitude distribution and the received
signal power. Thus, classical channel models which provide information about signal power
level distributions and Doppler shifts may be adequate for narrowband systems. Broadband
communication systems build on the classical understanding of the received signal power
distributions and Doppler spread also exploit spatial processing to operate in highly
complex and diverse propagation environments. Thus, it is necessary to incorporate new
concepts such as adaptive antenna arrays, angles of arrival (AoA), angles of departure
(AoD), delay spread and multiple antennas at both the ends of a communication link, the so-
called MIMO systems.
When investigating MIMO channels, the additional dimension that comes into play is space
which needs to be modelled in a similar way as frequency and time variations have been
modelled for the wideband single-input single-output (SISO) systems. In contrast to the
systems which deal with only temporal spreading, the MIMO channels require the angular
distribution of energy at both the ends of the communication link. The impulse response of
the double directional channel between a transmitter positioned at
t
P and a receiver
positioned at
r
P with n paths in 3D space can be written as (Steinbauer et al., 2001):
n
i
rtrtirtrt
pphPPh
1
),,,,(),,,,(
(1)
where
,
t
and
r
denote the delay, AoD and AoA, both in 3D space, respectively and
i
h is the contribution of the
th
i component, i.e.,
)()()(),,,,(
,, irritti
ij
irtrti
epph
(2)
where
,
i
,
i
,
i
it ,
and
ir,
represent the amplitude, phase, time delay, AoD and AoA
of the
th
i
multipath contribution, respectively.
These parameters are determined by the relative location of the transmitter and the receiver.
When either the transmitter or the receiver moves, these variables become a function of time
and can change drastically over large periods of time (long distances). Therefore a more
compact representation of time variant double-directional channel impulse response is
given by,
n
i
rtkrt
thth
1
),,,(),,,(
(3)
In addition to these parameters, the double directional channel impulse response is also
dependent on the antenna patterns and the modelling bandwidth.
2.1 The MIMO Propagation Channel
If multiple antennas are deployed at both the ends of a communication link, a MIMO system
is obtained as shown in Fig. 1. The key idea underlying MIMO theory is that signals
sampled in the spatial domain at both the ends are combined in such a way that multiple
parallel channels are created. The double-direction description of the channel can be
extended to MIMO channel by considering
t
n transmit and
r
n receive spatially separated
antennas at both the ends. The corresponding MIMO channel matrix can be defined as:
),(),(),(
),(),(),(
),(),(),(
),(
21
22221
11211
ththth
ththth
ththth
tH
nmnn
m
m
(4)
where
(.)
nm
h denotes the narrowband channel (wide sense stationary uncorrelated
scattering process) between the
th
m transmit and
th
n receive antenna. The elements of the
channel matrix (i.e., individual narrowband SISO channels) are taken as independent
circularly symmetric complex Gaussian variables with equal variance.
Satellite Communications82
2
x
1
x
1
Y
2
Y
1
z
2
z
2
x
1
x
1
Y
2
Y
1
z
2
z
Fig. 1. The MIMO propagation channel.
The representation of a MIMO channel by individual SISO channels in not complete
description of the multiple antenna systems. In order to get full benefit from MIMO systems
(i.e., diversity gain, spatial multiplexing gain and array gain) certain trade-offs exist between
these gains to achieve an adequate bit error rate at all times in an interference and noise
limited system and at the same time maximizing throughput. The performance of MIMO
techniques requires the exploitation of spatial correlation between all channel matrix
elements. In (3) the elements of the channel matrix are assumed to be independent and
therefore any two elements are uncorrelated. Practically, there is always some correlation
between the channel matrix elements. These correlations are owing to small antenna array
separation, antenna geometry and small amount of angular spread at the transmitter or the
receiver side or both. Different studies have been found in literature to investigate the effects
of correlation on the performance of systems employing multiple antenna techniques. In
(Lokya, 2001) n equal power and equal rate parallel sub-channels are considered with ’r’ as
correlation coefficient between any two sub-channels. The capacity of such a channel can be
written as:
)1(
1log11log.)(
22
rn
rn
r
n
nrC
(5)
where
''
represents the signal-to-noise ratio (SNR). When 0
r the above equation reduces
to the well-known formula for capacity:
bps/Hz 11log.)(
2
r
n
nrC
(6)
Comparison of (5) and (6) illustrate that the SNR decreases inversely with increase in the
value of correlation coefficient (e.g.,
7.0
r results in 3 dB reduction in SNR). The MIMO
channel capacity versus correlation coefficient for different values of ‘n’ at SNR value of
30 dB is shown in Fig. 2.
0 0.1 0.2 0.3 0.4 0.5 0.6 0.7 0.8 0.9 1
0
5
10
15
20
25
Correlation Coefficient, 'r'
Channel Capac ity (bps/Hz)
MIMO channel capacity against different values of spatial correlations
n = 2
n = 6
n = 10
n = 20
n = 40
Fig. 2. MIMO channel capacity for ’n’ channels against different values of correlation
coefficient ‘r’.
The other factors that limit the performance of MIMO channels are: number of scatterers,
presence of line-of-sight (LOS) path, correlation between antenna elements at the transmitter
or receiver side or both, keyholes, antenna patterns and geometry etc.
3. MIMO Channel Models for Satellite Communications
The wireless world has seen substantial increase in the demand of high quality broadband
wireless services during recent years which results in the evolution of MIMO
communication systems. The satellite communication systems are not immune to this
change. In order to evaluate the performance of these systems employing MIMO
technology, radio propagation models with high accuracy are required which can capture
all those effects that affect different aspects of these systems whilst remaining
computationally simple and require less simulation times.
Different approaches can be used to build a channel model with certain trade-offs (Almer et
al., 2007). For example, physical or deterministic channel models based on ray-tracing
algorithms can provide accurate results for a particular scenario, however due to global
coverage of satellites this approach is not often used. On the other hand statistical models
are built around measurement data and provide reasonable accuracy for the environments
similar to that for which the model was built. However, they provide little insight into the
propagation mechanisms and depend on the accuracy of measured data. An intermediate
approach between these models is physical-statistical model. The physical-statistical
modelling approach is the most appropriate in predicting the ‘ON/OFF’ nature and finding
the small scale fading effects over large coverage areas applicable to LMS communication
systems (Saunders et al., 2007). In this section some of the recently developed MIMO
channel models based on different channel modelling approaches are presented.
MIMO Channel Models for Satellite Communications 83
2
x
1
x
1
Y
2
Y
1
z
2
z
2
x
1
x
1
Y
2
Y
1
z
2
z
Fig. 1. The MIMO propagation channel.
The representation of a MIMO channel by individual SISO channels in not complete
description of the multiple antenna systems. In order to get full benefit from MIMO systems
(i.e., diversity gain, spatial multiplexing gain and array gain) certain trade-offs exist between
these gains to achieve an adequate bit error rate at all times in an interference and noise
limited system and at the same time maximizing throughput. The performance of MIMO
techniques requires the exploitation of spatial correlation between all channel matrix
elements. In (3) the elements of the channel matrix are assumed to be independent and
therefore any two elements are uncorrelated. Practically, there is always some correlation
between the channel matrix elements. These correlations are owing to small antenna array
separation, antenna geometry and small amount of angular spread at the transmitter or the
receiver side or both. Different studies have been found in literature to investigate the effects
of correlation on the performance of systems employing multiple antenna techniques. In
(Lokya, 2001) n equal power and equal rate parallel sub-channels are considered with ’r’ as
correlation coefficient between any two sub-channels. The capacity of such a channel can be
written as:
)1(
1log11log.)(
22
rn
rn
r
n
nrC
(5)
where
''
represents the signal-to-noise ratio (SNR). When 0
r the above equation reduces
to the well-known formula for capacity:
bps/Hz 11log.)(
2
r
n
nrC
(6)
Comparison of (5) and (6) illustrate that the SNR decreases inversely with increase in the
value of correlation coefficient (e.g.,
7.0
r results in 3 dB reduction in SNR). The MIMO
channel capacity versus correlation coefficient for different values of ‘n’ at SNR value of
30 dB is shown in Fig. 2.
0 0.1 0.2 0.3 0.4 0.5 0.6 0.7 0.8 0.9 1
0
5
10
15
20
25
Correlation Coefficient, 'r'
Channel Capac ity (bps/Hz)
MIMO channel capacity against different values of spatial correlations
n = 2
n = 6
n = 10
n = 20
n = 40
Fig. 2. MIMO channel capacity for ’n’ channels against different values of correlation
coefficient ‘r’.
The other factors that limit the performance of MIMO channels are: number of scatterers,
presence of line-of-sight (LOS) path, correlation between antenna elements at the transmitter
or receiver side or both, keyholes, antenna patterns and geometry etc.
3. MIMO Channel Models for Satellite Communications
The wireless world has seen substantial increase in the demand of high quality broadband
wireless services during recent years which results in the evolution of MIMO
communication systems. The satellite communication systems are not immune to this
change. In order to evaluate the performance of these systems employing MIMO
technology, radio propagation models with high accuracy are required which can capture
all those effects that affect different aspects of these systems whilst remaining
computationally simple and require less simulation times.
Different approaches can be used to build a channel model with certain trade-offs (Almer et
al., 2007). For example, physical or deterministic channel models based on ray-tracing
algorithms can provide accurate results for a particular scenario, however due to global
coverage of satellites this approach is not often used. On the other hand statistical models
are built around measurement data and provide reasonable accuracy for the environments
similar to that for which the model was built. However, they provide little insight into the
propagation mechanisms and depend on the accuracy of measured data. An intermediate
approach between these models is physical-statistical model. The physical-statistical
modelling approach is the most appropriate in predicting the ‘ON/OFF’ nature and finding
the small scale fading effects over large coverage areas applicable to LMS communication
systems (Saunders et al., 2007). In this section some of the recently developed MIMO
channel models based on different channel modelling approaches are presented.
Satellite Communications84
3.1 The Physical-Statistical MIMO Channel Model
This physical-statistical MIMO channel (King et al., 2005) for LMS communications is based
on ‘clusters’ concept and uses the same methodology given in (Correia, 2001; Molisch, 2004).
The ray-tracing algorithm has been exercised to find different propagation effects like roof-
top diffraction, specular reflection, shadowing caused by trees and foliage and blockage by
buildings in LMS communication links in urban and high-way environments. The model
can generate high resolution time series data and power delay profile for communication
links between the satellite and mobile terminal antennas and can also predict the correlation
between these links. In this model, obstacles (e.g., buildings, trees etc) are grouped into
clusters of spherical shapes where clusters centers are randomly positioned. The building
heights follow lognormal distribution. Twenty scatterers are placed randomly around the
cluster centre each with dimension following Laplacian distribution (Correia, 2001). The
building densities are assumed to be 90% in clusters representing urban environment,
whereas trees are considered 90% of time in clusters for high-way environment. In order to
validate the model, the parameters used are obtained from measurements data collected in
Munich, Germany at L-band (1.54 GHz), for urban and high-way environments.
When signals reflected by distant clusters are blocked by buildings in the local clusters,
these contributions are rejected. The signals from the satellite antennas to the mobile
antennas are selected through appropriate clusters of scatters. Each scatterer in the cluster is
assigned randomly the same reflection coefficient from a uniform magnitude distribution
between 0 and 1 and phase 0 to 2
. This channel model considers three paths between a
satellite and moving mobile terminal: a line-of-sight (LOS) path, a blocked LOS path and an
attenuated path by trees. The time series data ‘I’ for a satellite or a high altitude platform
(HAP) antenna M and each moving mobile antenna N can be written as:
n
1i
iN,M,iN,M,iiNM,NM,
n
1i
iN,M,iN,M,iiNM,NM,
iN,M,iN,M,i
n
1i
iNM,
Path LOS )exp(jkdPΓTbPT
Path Blocked )exp(jkdPΓTbPD
Path Clear )exp(jkdPFTbP
N,M
(7)
where
NM
P
,
,
NM
D
,
and
NM
T
,
denote the LOS path loss, the diffraction loss and the LOS
trees loss, respectively, between satellite antenna M and moving mobile terminal antenna N.
The term ‘b’ is the clutter factor derived from measurements in each environment,
i
T is the
tree attenuation from scatter i,
i
is the reflection coefficient at scatterer i,
iNM
P
,,
is the path
loss and
iNM
D
,,
is the distance between satellite antenna M and mobile terminal antenna N
via scatterer i. The small scale fading parameters such as AoA distribution, shadowing
depth and wideband parameters like root mean square (RMS) delay spread or coherence
bandwidth can be approximated in each environment using the output time series and
spatial power delay profile data of the model.
3.2 Analytical MIMO LMS channel model at Ku-Band and above
The physical-statistical channel model described earlier is designed for L (1-2 GHz) and S (2-
4 GHz) frequency bands for LMS communication systems. The application of MIMO
systems for satellite communications at Ku frequency band (12-18 GHz) and above has been
discussed in (Liolis et al., 2007). In this model, two features of MIMO technology are
presented: (i) a 2x2 MIMO spatial multiplexing system is used to achieve capacity
improvements and a closed form expression for the outage capacity is derived (ii) MIMO
spatial diversity scheme with receive antenna selection is applied in order to reduce
interference in LMS communication links. In addition, an analytical closed form expression
for interference mitigation on forward link of a satellite 2x2 MIMO diversity system with
antenna selection is also obtained. In order to discuss the features of MIMO techniques, the
model assumes propagation phenomena such as clear LOS, high antenna directivity, rain
fading and rainfall spatial homogeneity. The propagation delay offset (synchronization
problem) in LMS communications is also considered and a practical solution to this problem
is found where matched filters are applied, first to the received signals for the detection of
propagation delay offset and then the resulting signals are fed to the timing aligner.
Subsequently, the delay offsets are eliminated by adjusting the timing of a signal serial-to-
parallel converter.
The figure of merit for the analysis of MIMO fading channel is the outage capacity. A dual-
satellite MIMO communication channel at Ku-band and above is shown in Fig. 1 in (Liolis et
al., 2007). The terminal station is equipped with two highly directive collocated antennas to
communicate with two satellites S1 and S2. The separation,
,
between the antennas is
kept large enough so that the spatial correlation due to rain along the relevant paths is as
low as possible. Considering the clear LOS between the terminal station and each satellite
and that each terminal station antenna is at bore-sight with the corresponding satellite, the
total path loss along each link can be written as follows (Liolis et al., 2007):
2 1,i AFSLA
Riii
(8)
where
2
10
)/ 4(log10 cfdFSL
ii
is the free space loss along each link, f is the operating
frequency and c is the speed of light. The term
Ri
A represents the rain induced attenuation.
The convective raincell model using Crane’s assumptions is employed for the description of
vertical variation of the rain fall structure using the same approach as in (Panagopoulos &
Kanellopoulis, 2002). Based on these suppositions if
is sufficiently large, the spatial
correlation between random variables
Ri
A representing channel coefficients is low and a
decorrelated (ideal) MIMO satellite channel model is obtained.
To find out the capacity of dual satellite MIMO channel, it is assumed that the two satellites
transmit different and independent data streams and the channel is perfectly known at the
terminal side while the transmitting satellites have no information about the channel. Equal
powers are allocated to the two satellites owing to distributive nature of the system in the
absence of channel state information (CSI). The capacity of the dual satellite MIMO channel
based on the standard MIMO theory, taking into the account above assumptions, can be
written as follows:
MIMO Channel Models for Satellite Communications 85
3.1 The Physical-Statistical MIMO Channel Model
This physical-statistical MIMO channel (King et al., 2005) for LMS communications is based
on ‘clusters’ concept and uses the same methodology given in (Correia, 2001; Molisch, 2004).
The ray-tracing algorithm has been exercised to find different propagation effects like roof-
top diffraction, specular reflection, shadowing caused by trees and foliage and blockage by
buildings in LMS communication links in urban and high-way environments. The model
can generate high resolution time series data and power delay profile for communication
links between the satellite and mobile terminal antennas and can also predict the correlation
between these links. In this model, obstacles (e.g., buildings, trees etc) are grouped into
clusters of spherical shapes where clusters centers are randomly positioned. The building
heights follow lognormal distribution. Twenty scatterers are placed randomly around the
cluster centre each with dimension following Laplacian distribution (Correia, 2001). The
building densities are assumed to be 90% in clusters representing urban environment,
whereas trees are considered 90% of time in clusters for high-way environment. In order to
validate the model, the parameters used are obtained from measurements data collected in
Munich, Germany at L-band (1.54 GHz), for urban and high-way environments.
When signals reflected by distant clusters are blocked by buildings in the local clusters,
these contributions are rejected. The signals from the satellite antennas to the mobile
antennas are selected through appropriate clusters of scatters. Each scatterer in the cluster is
assigned randomly the same reflection coefficient from a uniform magnitude distribution
between 0 and 1 and phase 0 to 2
. This channel model considers three paths between a
satellite and moving mobile terminal: a line-of-sight (LOS) path, a blocked LOS path and an
attenuated path by trees. The time series data ‘I’ for a satellite or a high altitude platform
(HAP) antenna M and each moving mobile antenna N can be written as:
n
1i
iN,M,iN,M,iiNM,NM,
n
1i
iN,M,iN,M,iiNM,NM,
iN,M,iN,M,i
n
1i
iNM,
Path LOS )exp(jkdPΓTbPT
Path Blocked )exp(jkdPΓTbPD
Path Clear )exp(jkdPFTbP
N,M
(7)
where
NM
P
,
,
NM
D
,
and
NM
T
,
denote the LOS path loss, the diffraction loss and the LOS
trees loss, respectively, between satellite antenna M and moving mobile terminal antenna N.
The term ‘b’ is the clutter factor derived from measurements in each environment,
i
T is the
tree attenuation from scatter i,
i
is the reflection coefficient at scatterer i,
iNM
P
,,
is the path
loss and
iNM
D
,,
is the distance between satellite antenna M and mobile terminal antenna N
via scatterer i. The small scale fading parameters such as AoA distribution, shadowing
depth and wideband parameters like root mean square (RMS) delay spread or coherence
bandwidth can be approximated in each environment using the output time series and
spatial power delay profile data of the model.
3.2 Analytical MIMO LMS channel model at Ku-Band and above
The physical-statistical channel model described earlier is designed for L (1-2 GHz) and S (2-
4 GHz) frequency bands for LMS communication systems. The application of MIMO
systems for satellite communications at Ku frequency band (12-18 GHz) and above has been
discussed in (Liolis et al., 2007). In this model, two features of MIMO technology are
presented: (i) a 2x2 MIMO spatial multiplexing system is used to achieve capacity
improvements and a closed form expression for the outage capacity is derived (ii) MIMO
spatial diversity scheme with receive antenna selection is applied in order to reduce
interference in LMS communication links. In addition, an analytical closed form expression
for interference mitigation on forward link of a satellite 2x2 MIMO diversity system with
antenna selection is also obtained. In order to discuss the features of MIMO techniques, the
model assumes propagation phenomena such as clear LOS, high antenna directivity, rain
fading and rainfall spatial homogeneity. The propagation delay offset (synchronization
problem) in LMS communications is also considered and a practical solution to this problem
is found where matched filters are applied, first to the received signals for the detection of
propagation delay offset and then the resulting signals are fed to the timing aligner.
Subsequently, the delay offsets are eliminated by adjusting the timing of a signal serial-to-
parallel converter.
The figure of merit for the analysis of MIMO fading channel is the outage capacity. A dual-
satellite MIMO communication channel at Ku-band and above is shown in Fig. 1 in (Liolis et
al., 2007). The terminal station is equipped with two highly directive collocated antennas to
communicate with two satellites S1 and S2. The separation,
,
between the antennas is
kept large enough so that the spatial correlation due to rain along the relevant paths is as
low as possible. Considering the clear LOS between the terminal station and each satellite
and that each terminal station antenna is at bore-sight with the corresponding satellite, the
total path loss along each link can be written as follows (Liolis et al., 2007):
2 1,i AFSLA
Riii
(8)
where
2
10
)/ 4(log10 cfdFSL
ii
is the free space loss along each link, f is the operating
frequency and c is the speed of light. The term
Ri
A represents the rain induced attenuation.
The convective raincell model using Crane’s assumptions is employed for the description of
vertical variation of the rain fall structure using the same approach as in (Panagopoulos &
Kanellopoulis, 2002). Based on these suppositions if
is sufficiently large, the spatial
correlation between random variables
Ri
A representing channel coefficients is low and a
decorrelated (ideal) MIMO satellite channel model is obtained.
To find out the capacity of dual satellite MIMO channel, it is assumed that the two satellites
transmit different and independent data streams and the channel is perfectly known at the
terminal side while the transmitting satellites have no information about the channel. Equal
powers are allocated to the two satellites owing to distributive nature of the system in the
absence of channel state information (CSI). The capacity of the dual satellite MIMO channel
based on the standard MIMO theory, taking into the account above assumptions, can be
written as follows: