Báo cáo hóa học: " Electromodulated reflectance study of self-assembled Ge/Si quantum dots" pptx
Bạn đang xem bản rút gọn của tài liệu. Xem và tải ngay bản đầy đủ của tài liệu tại đây (303.74 KB, 4 trang )
NANO EXPRESS Open Access
Electromodulated reflectance study of
self-assembled Ge/Si quantum dots
Andrew Yakimov
*
, Aleksandr Nikiforov, Aleksei Bloshkin, Anatolii Dvurechenskii
Abstract
We perform an electroreflectance spectroscopy of Ge/Si self-assembled quantum dots in the near-infrared and in
the mid-infrared spectral range. Up to three optical transitions are observed. The low-energy resonance is proposed
to correspond to a band-to-continuum hole transition in the Ge valence band. The other two modulation signals
are attributed to the spatially direct transitions between the electrons confined in the L and Δ(4) valleys of the Ge
conduction band, and the localized hole states at the Γ point.
Introduction
In order to realize Si-based optoelectronics, Ge quantum
dots (QDs) in Si matrices have a ttracted a large interest
during the past years. Detailed knowledge on the elec-
tronic band structure and related optical transitions is
very important when us ing self-assembled Ge/Si QDs in
Si-based photonic devices. To date, most work on the
optical properties of Ge/Si QDs is based on the photolu-
minescence (PL) spectroscopy [1-4]. However, as a rule,
PL measurements provide information on the ground-
state transitions only. To study high-energy excited
states, it is more useful to perform absorption [5] or
reflectance [6,7] experiments. In this study, the optical
transitions in layers of Ge/Si QDs are investigated by
electroreflectance (ER) spectroscopy as a function of
applied electric field.
Experimental details
For controlled tuning of the electric field, the Ge QDs are
embedded in the intrinsic region of a Si pin diode, allow-
ing fields to be applied parallel the growth direction. To
rule out spurious effects and to correctly assign the spec-
tral feat ures due to the presence of the dots, three sets of
samples were grown by means of molecular beam epitaxy
(MBE) on a p-Si(001) substrate with a resistivity of 150 Ω
cm. The first one contains no Ge and hence can be con-
sidered as a referenc e sam ple. The second s ample con-
tains twenty Ge wetting layers (WLs), each 4 monolayer
(ML) thick. A WL represents thin Ge planar layer which
forms during the early stage of Ge deposition. And
finally, there is a sample with 20 layers of Ge QDs lying
on WLs (Figure 1). The growth temperature was gener-
ally 500°C for all layers. First, a 500-nm Sb- doped n
+
-
type Si buffer layer with doping concentration of 5 × 10
18
cm
-3
followed by a 200-nm Si undoped layer were grown.
Then 20 Ge layers separated b y 10-nm Si spacer layer,
followed by a 100-nm undoped Si layer, were fabricated
at a rate of 0.02 ML/s. F or all samples the Ge coverage is
about 6 ML. The Ge QDs formation was controlled by
reflection high energy electron diffraction when the pat-
tern changed from streaky to spotty. Immediately after
the deposition of Ge, the temperature was lowered to T
s
= 350-400°C and the Ge islands are covered by a 1-nm Si
layer. This procedure is necessary to minimize Ge-Si
intermixing and to preserve island shape and size from
the effect of a further higher temperature deposition. The
average Ge content of 80% in the nanoclusters was deter-
mined from Raman measurements. The samples were
completed by capping a 300-nm-thick p
+
-doped Si layer
(B, 3 × 10
18
cm
-3
) to form a p-i-n junction. The resulting
devices were isolated from each other by etching 1.1-μm-
deep mesas.
The Si intrinsic region is not intentionally doped, never-
the less we estimated a residual MBE background doping
at about 10
16
cm
-3
of p-type. From scanning tunneling
microscopy experiments, we observe the Ge nanoislands
to be approximately 15 nm in lateral size and about
1.5 nm in height. They have the f orm of hut clusters
bounded by {105} facets. The density of the dots i s about
10
11
cm
-2
. A typical PL spectrum of the dot sample
* Correspondence:
Institute of Semiconductor Physics, Siberian Branch of the Russian Academy
of Sciences, Novosibirsk, Russia
Yakimov et al. Nanoscale Research Letters 2011, 6:208
/>© 2011 Yakimov et al; licensee Springer. This is an Open Access article distributed under the terms of the Creative Commons
Attribution L icense (http:// creativecommons.org/licenses/by/2.0), which permits unrestricted use, distribution, and reproduction in
any medium, provided the original work is properly cited.
(not shown here) is dominated by a broadband emission
peaked around 820 meV.
The ER measurements were performed at room tem-
perature using a step-scan VERTEX-70 Fourier-trans-
form infrared spectrometer. The incident light from a
tungsten halogen lamp was unpolarized and the devices
were under normal incidence. A 2-kHz sine-wave vol-
tage with a peak-to-peak amplitude of 200 mV served as
an ac modulation source. Various values of reverse dc
bias voltage U
b
was employed. The modulation reflec-
tance of the samples was filtered with a lock-in amplifier
before the Fourier transform. The phase correction
recorded for b ackground spectrum without the sample
was used.
Results and discussion
First w e checked the photocurrent(PC)responsefrom
the devices under investigation. The applied bias was 0
V and the PC was measured in a short circuit configura-
tion. A 2-mm-thick Si wafer serving as a filter was
introduced to remove the strong PC signal due to the
band-to-band transitions in the Si epitaxial layers for
energies larger than 1.1 eV. Below the Si band gap
energy,thereisonlyaweakPCsignalforthesample
with Ge WLs (Figure 2). The spectral response of the
device with QDs clearly covers a broader spectral range
extending down to a half of eV.
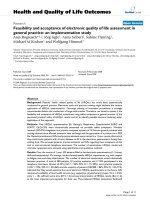
Figure 3a shows typical results of ER spectroscopy.
We did not observe any ER signal in a reference sample
and in a sample with Ge WLs. Instead, there is an
apparent, well-defined ER response from a sample c on-
taining Ge QDs. We thus associate this electromodula-
tion with Ge nanoislands. In order to accurately
determine the transition energies, we fit the data with a
first-deriv ative Gaussian-type function [8]. The Gaussian
line-shape analysis is appropriate for the inhomogeneous
broadening relat ed to the si ze fluctuations in ensembl e
of QDs. A typical curve fit is demonstrated in Figure 3b
Figure 1 Schematic cross section of the QD device used to
make photocur-rent and ER measurements. The structure is that
of a p-i-n diode with 20 layers of Ge QDs in the depleted intrinsic
region.
0.3 0.5 0.7 0.9 1.1
0.0
0.5
1.0
1.5
2.0
Photocurrent (arb. units)
Photon energy (eV)
T=95 K
U
B
=0 V
QD sample
WL sample (x100)
E
g
(Si)
Figure 2 PC spectra of the QD and WL structures measured in
a short circuit configuration at T =95K.
0.5 1.0 1.5 0.5 1.0 1.5
ΔR/R
WL sample
QD sample
no Ge
U
B
=1.5 V
10
-5
(a) (b)
0
0
0
Photon energy (eV)
10
-5
A
450 meV
B
832 meV
C
1207 meV
Figure 3 ER spectra for different samples under investigation.
(a) ER spectra for the reference sample (no Ge was deposited) as
well as for the WL and QD samples measured at reverse bias U
b
=
1.5 V. (b) Experimental ER spectrum (circles) and curve fit (solid
lines) for the QD sample. The obtained values of the energies are
represented by bars in the figure.
Yakimov et al. Nanoscale Research Letters 2011, 6:208
/>Page 2 of 4
for the reverse bias of 1.5 V. As shown by the full line, a
satisfactory fitting is achieved when one assumes the
presence of three transitions (A, B, and C) wit h the
energies denoted by thin vertical lines. Note that the
position of the low-energy feature is close to the lo ng-
wave PC onset. Figure 4 sho ws the ER as a function of
reverse bias applied to th e diode. The low-energy reflec-
tancemodulationat400meVdisappearsatlarge
applied voltage wh en the residual holes are evacuated
from the dots and the Ge i slands become co mpletely
depleted. We assume that this resonance corresponds to
the hole i ntraband transition between the ground state
in Ge QDs and the valence band continuum. This
assignment is further support ed by theoretical consid-
eration presented below.
We consider a realistic situation when both Si matrix
and Ge nanoclusters are inhomogeneously strained due
to the lattice mismatch between Si and Ge. The QD is
assumed to have a pyramid shape w ith the base oriented
along the [100] and [010] directions. The pyramid base is
15 nm and the height is 1.5 nm. The pyramid lies on a
4 ML Ge W L. First, the f inite element calculations of
three-dimensional spatial distribution of strain compo-
nents are performed. The strain modifies the band struc-
ture through the deformation potentials. A furth er
numerical analysis of the band structure is based on a
six-band k·p approach for the valence band and a single-
band effective-mass approximation for the conduction
band (CB) [9]. Coulomb interaction between the electron
and hole is included into the problem.
The band diagram for the three lowest interband tran-
sitionsisshowninFigure5.Duetothetensilestrain,
the sixfold-degenerate conductio n-band minimum at the
Δ point of Si around the Ge dot splits into the fourfold-
degenerate in-plane Δ(4) valleys and the twofold-deg en-
erate Δ(2) valleys along the [001] growth direction. The
lowest CB edge just above and below the Ge island is
formed by the Δ(2) valleys [10]. In the valence band,
thereisalargeoffsetandtheholesareconfinedinside
the Ge dot, yielding type-II band-edge alignment. Since
the electron a nd hole are spatially separated the elec-
tron-hole overlap (f ) is as small as 0.18. The oscillator
strength is greatly increased for the spatially direct inter-
band transit ions. The lowest direct transition inside the
dot involves the Δ(4) CB ( f = 0.56) and the second one
includes the L valley (f = 0.86). The calculated energy
difference between the spatially direct Δ(4) - Γ and spa-
tially indirect Δ(2) - Γ transit ions, 35 meV, is consistent
with that obtained previously from PL spectroscopy, 34-
52 meV [4]. It i s worth to note that although the ener-
gies of these transitions are close to each other (0.7 eV),
the oscillator strength (∝ f
2
) of the direct transition is
larger by one order of magnitude to dominate in the
absorption spectra. Therefore, it is unlikely to observe
the indirect transition in absorption or reflectance
experiments. However, it can be easily detected in PL
measurements as they can probe selectively the ground-
state emission energy.
From the comparison between the calculated transi-
tion energies (Figure 5) and the experimental ER
0.0 0.5 1.0 1.5
experiment
fit
ΔR/R
Photon energy (eV)
10
-5
2.25 V
2.0 V
1.75 V
1.5 V
1.25 V
1.0 V
0.5 V
0 V
Figure 4 ER spectra for QD sample under various bias voltages
shifted vertically for clarity.
430 meV
Γ
Δ
(2)
CB
VB
740 meV
705 meV
Pyramid apex
Energy
CB
1200 meV
Δ(4)
Si Ge Si
L
Figure 5 Calculated band-edge diagram of the strained Ge
pyramid in Si(001) along the growth axis with the relevant
interband transitions. For CB Δ and L points are shown. The
electron and hole energy levels are indicated by horizontal dashed
lines.
Yakimov et al. Nanoscale Research Letters 2011, 6:208
/>Page 3 of 4
spectrum (Figure 3) we may conclude that the low-
energy r esonance corresponds to a band-to-continuum
hole transition in the Ge valence band. The other two
modulation signals are attributed to the spatially direct
transitions between the electrons confined in the L and
Δ(4) valleys of the Ge CB, and the localized hole states
at the Γ point.
The assignment of the high-energy electromodulation
signals to the direct transitions is supported by analysis
of the transition energies as a function of electric field. It
is known that e lectric field applied perpendicular to
quantum wells causes the shift of the electronic transi-
tion energy, the quantum-confined Stark effect (QCSE)
[11]. Type-I systems, wherein the narrow-gap dot mate-
rial presents a potential wel l for both electron and hole,
exhibit a quadratic r ed-shift of the transition energy
[7,11,12], while there should be a linear blue-shift of the
spatially indirect transition for the systems with type-II
band alignment [13,14]. In Figure 6, we plot the transi-
tion energies of peaks B and C as a function of applied
reverse bias. As the bias increases, both peaks are red
shifted by the QCSE, implying a type-I band-edge lineup.
According to the studies by Larsson et al. [3,4] and by
Adnane et al. [15], it is possible to observe the spatially
direct recombination proc esses in th e Ge/Si dot systems by
using the PL measure ments in specific experimental condi-
tions which are elevated temperatures, higher excitation
power [3,4] or employment of PL excitation spectroscopy
[15]. Unfortunately, all these conditions are inaccessible in
our experimental setup, so we did not observe direct tran-
sitions mentioned above in our PL experiments.
Abbreviations
CB: conduction band; ER: electroreflectance; MBE: molecular beam epitaxy;
PL: photo-luminescence; QDs: quantum dots; WLs: wetting layers.
Acknowledgements
The authors like to thank V.A. Volodin for Raman measurements. This study
has been supported by the Russian Foundation for Basic Research (Grant No.
09-02-12393).
Authors’ contributions
AY designed the study, carried out the ER measurements, participated in the
simulations and coordination, and drafted the manuscript. AN prepared the
samples using MBE technique. AB performed numerical analysis of the
electronic structure and assisted in ER experiments. AD supervised the
project work. All authors read and approved the final manuscript.
Competing interests
The authors declare that they have no competing interests.
Received: 13 August 2010 Accepted: 9 March 2011
Published: 9 March 2011
References
1. Schittenhelm P, Gail M, Brunner J, Nützel JF, Abstreiter G: Appl Phys Lett
1995, 67:1292.
2. Denker U, Stoffel M, Schmidt OG, Sigg H: Appl Phys Lett 2003, 82:454.
3. Larsson M, Elfing A, Holtz PO, Hansson GV, Ni W-X: Appl Phys Lett 2003, 82:4785.
4. Larsson M, Elfing A, Ni W-X, Hansson GV, Holtz PO: Phys Rev B 2006,
73:195319.
5. Stockes KL, Persan PD: Phys Rev B 1996, 54:1892.
6. Chang W-H, Hsu TM, Yeh NT, Chyi J-I: Phys Rev B 2000, 62:13040.
7. Jin P, Li CM, Zhang ZY, Liu FQ, Chen YH, Ye XL, Xu B, Wang ZG: Appl Phys
Lett 2004, 85:2791.
8. Huang YS, Qiang H, Pollak FH, Lee J, Elman B: J Appl Phys 1991, 70:3808.
9. Yakimov AI, Bloshkin AA, Dvurechenskii AV: Appl Phys Lett 2008, 93:132105.
10. Yakimov AI, Dvurechenskii AV, Nikiforov AI, Bloshkin AA, Nenashev AV,
Volodin VA: Phys Rev B 2006, 73:115333.
11. Miller DA, Chemla DS, Damen TC, Gossard AC, Weigmann W, Wood TH,
Burrus CA: Phys Rev Lett 1984, 53:2173.
12. Kuo Y-H, Lee YK, Ge Y, Ren S, Roth JE, Kamins TI, Miller DAB, Harris JS:
Nature 2005, 437:1332.
13. Yakimov AI, Dvurechenskii AV, Nikiforov AI, Ulyanov VV, Milekhin AG,
Govorov AO: Phys Rev B 2003, 67:125318.
14. Larsson M, Holtz PO, Elfving A, Hansson GV, Ni W-X: Phys Rev B 2005,
71:113301.
15. Adnane B, Karlsson KF, Hansson GV, Holtz PO, Ni W-X: Appl Phys Lett 2010,
96:181107.
doi:10.1186/1556-276X-6-208
Cite this article as: Yakimov et al.: Electromodulated reflectance study of
self-assembled Ge/Si quantum dots. Nanoscale Research Letters 2011
6:208.
Submit your manuscript to a
journal and benefi t from:
7 Convenient online submission
7 Rigorous peer review
7 Immediate publication on acceptance
7 Open access: articles freely available online
7 High visibility within the fi eld
7 Retaining the copyright to your article
Submit your next manuscript at 7 springeropen.com
0.82
0.84
0.5 1.0 1.5 2.0 2.5
1.16
1.20
1.24
experiment
parabolic fit
Transition energy (eV)
Peak B
Reverse bias U
B
(V)
experiment
parabolic fit
Peak C
Figure 6 The bias voltage dependence of the interband
transition energy for peaks B and C. The solid curves are a fit to
parabolic law.
Yakimov et al. Nanoscale Research Letters 2011, 6:208
/>Page 4 of 4