An Introduction to Financial Option Valuation_4 pot
Bạn đang xem bản rút gọn của tài liệu. Xem và tải ngay bản đầy đủ của tài liệu tại đây (432.15 KB, 22 trang )
9
More on hedging
OUTLINE
• practical illustration of hedging
• behaviour of delta near expiry
• Long-Term Capital Management
9.1 Motivation
The hedging idea that was used to derive the Black–Scholes PDE forms the most
important concept in this book. In this chapter, we therefore take time out to re-
iterate the steps involved and develop the process into an algorithm that can be
illustrated numerically.
9.2 Discrete hedging
Having found the explicit formulas (8.19) and (8.24), we may differentiate with
respect to S to obtain the required asset holding A
i
in (8.10). This partial derivative
∂V/∂ S is called the delta of an option, and the hedging strategy that we discussed
is known as delta hedging. Performing the differentiation leads to
∂C
∂ S
= N(d
1
)(delta of a European call), (9.1)
and
∂ P
∂ S
= N(d
1
) − 1 (delta of a European put). (9.2)
Confirmation of these expressions is deferred until Chapter 10, where various par-
tial derivatives are computed.
Returning to the delta hedging process, we know from (8.7) that
i+1
, the value
of the portfolio at t
i
+ δt, satisfies
i+1
= A
i
S
i+1
+ (1 +rδt)D
i
. (9.3)
87
88 More on hedging
The asset holding is rebalanced to A
i+1
and in order to compensate, the cash ac-
count is altered to D
i+1
.Since no money enters or leaves the system, the new
portfolio value, A
i+1
S
i+1
+ D
i+1
, must equal
i+1
in (9.3), so
D
i+1
= (1 +rδt)D
i
+ (A
i
− A
i+1
)S
i+1
. (9.4)
We may summarize the overall hedging strategy as follows.
Set A
0
= ∂V
0
/∂ S, D
0
= 1(arbitrary),
0
= A
0
S
0
+ D
0
For each new time t = (i + 1)δt
Observe new asset price S
i+1
Compute new portfolio value
i+1
in (9.3)
Compute A
i+1
=
∂V
i+1
∂ S
Compute new cash holding D
i+1
in (9.4)
New portfolio value is A
i+1
S
i+1
+ D
i+1
end
More precisely, this strategy is discrete hedging as the rebalancing act is done
at times iδt. Because we cannot let δt → 0inpractice, there will be some error in
the risk elimination.
For the purpose of illustration, it is possible to simulate an asset path and im-
plement discrete hedging. To write down the resulting algorithm, we use {ξ
i
} to
denote samples from an N(0, 1) pseudo-random number generator that are used in
simulating the asset path, and we let δt = T/N.
Set A
0
= ∂V
0
/∂ S, D
0
= 1(arbitrary),
0
= A
0
S
0
+ D
0
For i = 0toN − 1
Compute S
i+1
= S
i
e
(µ−
1
2
σ
2
)δt+
√
δtσξ
i
Set
i+1
= A
i
S
i+1
+ (1 +rδt)D
i
Compute A
i+1
=
∂V
i+1
∂ S
Set D
i+1
= (1 +rδt)D
i
+ (A
i
− A
i+1
)S
i+1
end
To describe the next set of experiments, it is convenient to use some financial
jargon. At time t,aEuropean call option is said to be
in-the-money if S(t)>E,
out-of-the-money if S(t)<E, and
at-the-money if S(t) = E.
The jargon extends in an obvious fashion to other options. In general, in-the-money
means that there will be a positive payoff if the asset price stays as it is. Out-of-
the-money means that the asset must change by some non-negligible amount in
9.3 Delta at expiry 89
order for a positive payoff to ensue. At-the-money defines the boundary between
in- and out-of-the-money.
Computational example Here we implement the discrete hedging simulation
above for a European call option with S
0
= 1, E = 1.5, µ = 0.055, r = 0.05,
T = 5 and δt = 10
−2
,soN = 500. The upper plot in Figure 9.1 displays the
particular discrete asset path (t
i
, S
i
), for t
i
= iδt, that arose. The strike price
E is shown as a dashed line. We see that for this particular asset path, the call
option stays out-of-the-money (asset price below E) until just after t = 1, and
then makes a number of excursions in/out-of-the-money before giving a very
small payoff at expiry. The upper-middle plot shows the deltas, (t
i
,∂C
i
/∂ S),
along the asset path. This shows the time-varying amount of asset held in the
portfolio. The lower-middle plot gives the cash level (t
i
, D
i
) and the solid curve
in the lower plot gives the portfolio value (t
i
,
i
). The idea behind delta hedging
is to guarantee that the portfolio C − grows at the risk-free interest rate. It
follows that
(S(t), t) = C(S(t), t) −
(
C(S
0
, 0) − (S
0
, 0)
)
e
rt
(9.5)
should hold. To test this, we computed the right-hand side of (9.5) at each time t
i
,
using the Black–Scholes formula (8.19) to compute C(S
i
, t
i
).Every tenth value
has been plotted as a circle in the lower picture.
1
The circles appear to lie on top
of the
i
curve, so (9.5) is approximated well. The discrepancy in (9.5) at the
expiry date,
C(S(T), T) − (S(T), T) −
(
C(S
0
, 0) − (S
0
, 0)
)
e
rT
, (9.6)
was found to be 0.0364. Reducing δt to 10
−4
(and hence computing a different
asset path), we found that this discrepancy was lowered to 0.0029. ♦
Computational example In Figure 9.2 we repeat the computation in Figure 9.1
with E set to the value 2.5. In this case the option finishes out-of-the-money.
Again we observe from the lower picture that (9.5) is close to being exact. ♦
9.3 Delta at expiry
Looking carefully at Figures 9.1 and 9.2 we see that
• in the first experiment, where the option expires in-the-money, the delta approaches the
value 1 at expiry, whereas
1
Plotting every value would make the picture too cluttered.
90 More on hedging
0 0.5 1 1.5 2 2.5 3 3.5 4 4.5 5
0
1
2
3
Asset path
E
0 0.5 1 1.5 2 2.5 3 3.5 4 4.5 5
0
0.5
1
Delta
0 0.5 1 1.5 2 2.5 3 3.5 4 4.5 5
0
0.5
1
1.5
Cash
0 0.5 1 1.5 2 2.5 3 3.5 4 4.5 5
1
1.5
2
2.5
Portfolio
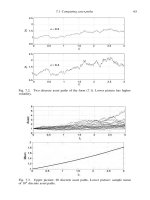
Fig. 9.1. Discrete hedging simulation. Option expires in-the-money. Upper: dis-
crete asset path. Upper-middle: delta values (also asset holding in portfolio).
Lower-middle: cash holding in portfolio. Lower: portfolio value (solid), theoreti-
cal portfolio value (9.5) (circles).
• in the second experiment, where the option expires out-of-the-money, the delta ap-
proaches the value 0 at expiry.
This is no accident. Using the characterization (9.1), some analysis shows that
lim
t→T
−
∂C(S, t)
∂ S
=
1, if S(T)>E,
1
2
, if S(T) = E,
0, if S(T)<E,
(9.7)
see Exercise 9.3. Hence, the delta always finishes at 1 for options that expire in-the-
money and 0 for options that expire out-of-the-money. If S(t) ≈ E for times close
to expiry, then the delta is liable to swing wildly between values at ≈ 1 (when S(t)
goes above E) and ≈ 0 (when S(t) dips below E). Our next experiment illustrates
this effect.
Computational example Here we repeat the computation that produced
Figures 9.1 and 9.2 with the strike price reset to E = 1.9, so that the option
frequently jumps in/out-of-the-money near expiry. Figure 9.3 shows that the cor-
responding delta value lurches dramatically as expiry is approached. ♦
9.3 Delta at expiry 91
0 0.5 1 1.5 2 2.5 3 3.5 4 4.5 5
0
1
2
3
Asset path
E
0 0.5 1 1.5 2 2.5 3 3.5 4 4.5 5
0
0.5
1
Delta
0 0.5 1 1.5 2 2.5 3 3.5 4 4.5 5
0.5
1
1.5
2
Cash
0 0.5 1 1.5 2 2.5 3 3.5 4 4.5 5
1
1.5
2
Portfolio
Fig. 9.2. Discrete hedging simulation. Option expires out-of-the-money. Upper:
discrete asset path. Upper-middle: delta values (also asset holding in portfolio).
Lower-middle: cash holding in portfolio. Lower: portfolio value (solid), theoreti-
cal portfolio value (9.5) (circles).
The delta behaviour near expiry that was observed in Figures 9.1 to 9.3, and is
encapsulated in (9.7), has a simple financial interpretation. For t ≈ T there is little
time left for the asset value to change – if it is currently in/out-of-the-money then it
will probably remain in/out-of-the-money. In particular, if the call option is in-the-
money then any upward or downward movement in the asset corresponds almost
directly to the same upward or downward movement in the payoff. In other words,
the call option and the asset are very highly correlated – they share the same risk.
Since the portfolio is designed to replicate the risk in the option, it follows that it
will hold approximately 1 unit of asset, so
i
≈ 1. Conversely, if the call option is
out-of-the-money close to expiry then the payoff is very likely to be zero whatever
happens to the asset – there is no risk, so we should not be holding any asset.
The analogous results to (9.7) for a European put option are
lim
t→T
−
∂ P(S, t)
∂ S
=
0, if S(T)>E,
−
1
2
, if S(T) = E,
−1, if S(T)<E,
(9.8)
see Exercise 9.4, and a similar financial argument applies, see Exercise 9.5.
92 More on hedging
0 0.5 1 1.5 2 2.5 3 3.5 4 4.5 5
0
1
2
3
Asset path
E
0 0.5 1 1.5 2 2.5 3 3.5 4 4.5 5
0
0.5
1
Delta
0 0.5 1 1.5 2 2.5 3 3.5 4 4.5 5
0
1
2
Cash
0 0.5 1 1.5 2 2.5 3 3.5 4 4.5 5
1
1.5
2
Portfolio
Fig. 9.3. Discrete hedging simulation. Option expires almost at-the-money. Up-
per: discrete asset path. Upper-middle: delta values (also asset holding in port-
folio). Lower-middle: cash holding in portfolio. Lower: portfolio value (solid),
theoretical portfolio value (9.5) (circles).
9.4 Large-scale test
We finish with an experiment that looks at the success of discrete hedging over a
large number of sample paths, and also illustrates that the option value is indepen-
dent of the drift parameter, µ,inthe asset price model.
Computational example Here we take a European put option with S
0
= 5, E =
5, r = 0.05 and σ = 0.3, with T = 3. We computed 500 discrete asset paths
with time-spacings δt = 10
−2
. The upper picture in Figure 9.4 plots S(T) on the
horizontal axis against
(S(T ), T) +
(
P(S
0
, 0) − (S
0
, 0)
)
e
rT
(9.9)
on the vertical axis for the case µ = 0.2. There are 500 such points, one for
each asset path. We computed P(S
0
, 0) in (9.9) from the Black–Scholes formula
(8.24). If the discrete hedging is successful, then an analogous identity to (9.5)
holds for P(S(t), t).Inparticular, it holds at expiry, so (9.9) should agree with
the put payoff max(E − S(T), 0). This ‘hockey stick’ payoff curve is superim-
posed as a dashed line. We see that the dots lie close to the dashed line, and
hence the discrete hedging algorithm behaves as predicted. The lower picture in
9.5 Long-Term Capital Management 93
0 5 10 15 20 25 30
−1
0
1
2
3
4
5
S(T)
Payoff
µ = 0.2
0 5 10 15 20 25 30
−1
0
1
2
3
4
5
S(T)
Payoff
µ = 0.4
Fig. 9.4. Large-scale discrete hedging example for a European put. Dots repre-
sent normalized final payoff (9.9) for 500 asset paths. Exact hockey stick payoff is
superimposed as a dashed line. Upper picture, µ = 0.2. Lower picture, µ = 0.4.
Figure 9.4 shows the same computations with µ changed to 0.4. This illustrates
the phenomenon that the option value does not depend upon µ. ♦
9.5 Long-Term Capital Management
There are many instances of academics with an expertise in mathematical finance
turning their hands to real-life trading. The most high-profile and, ultimately,
sobering example involves Long-Term Capital Management (LTCM). This was
a hedge fund that invested money supplied by its partners and a limited number of
wealthy clients. Two of the partners, closely involved in day-to-day trading strate-
gies, were Robert Merton and Myron Scholes – founding fathers of the ‘rocket
science’ of option valuation theory. The fund, set up in 1994, was extremely suc-
cessful at raising capital and for a period of around four years produced impres-
sively high returns. Although sometimes referred to as an arbitrage unit, LTCM
typically scoured the international markets looking for low risk opportunities to
make relatively small percentage gains. The fund used leverage –investing bor-
rowed money – to scale up these tiny margins into large profits. One commentator
likened their trades to ‘picking up nickels in front of bulldozers’ (Lowenstein,
2001, page 102). At the peak of the fund’s success, Merton and Scholes received
94 More on hedging
their Nobel Prizes. However, in mid-1998 a combination of extreme events in the
market plunged LTCM into deep trouble. One of the key difficulties they then
faced was illiquidity.LTCM became desperate to offload a vast range of com-
plicated portfolios, but the small set of potential buyers were, quite reasonably,
holding out in the expectation that prices would drop further. (The assumption of
liquidity – there always being a ready supply of buyers and sellers – is implicit in
the Black–Scholes theory.) The bulldozers were moving in. The decline of LTCM
and the enormity of its potential debts were brought to the attention of The Fed-
eral Reserve Bank of New York (the Fed), a major component of the US Federal
Reserve System. Quite remarkably, the Fed became concerned that bankruptcy of
LTCM could create such a hole that the overall stability of the market was at threat.
Very rapidly, the Fed managed to persuade a consortium of major banks and in-
vestment houses to bail out LTCM in order to prevent the very real possibility of a
total meltdown of the financial system.
1
Overall, a dollar invested in LTCM grew to a height of around $2.85, but
dropped sharply to a paltry 23 cents, and the partners lost personal fortunes. A
fast-paced and highly informative account of the LTCM debacle, with input from
a number of first-hand witnesses, is given in (Lowenstein, 2001).
9.6 Notes
If you understand the hedging idea, it is perfectly reasonable for you to ask why
options exist, that is,
given that it is possible to reproduce the payoff of an option using only cash and the under-
lying asset, why is there a market for options?
One answer is that the Black–Scholes theory relies on assumptions that are not
universally valid, and it is neither convenient nor feasible for most of us to carry
out hedging. On one side there is a large group of investors who view options as
an excellent means to alleviate their exposure to risk, and another large group who
see options as a great way to speculate on the market. On the other side there is a
complementary group of well-connected players, with the resources to manipulate
complicated portfolios and negotiate relatively small transaction costs, who are
willing to accept the Black–Scholes value plus a small premium.
EXERCISES
9.1. Show from (9.1) and (9.2) that ∂C/∂S > 0 and ∂ P/∂ S < 0.
1
Lowenstein (Lowenstein, 2001, page 198) quotes Sandy Warner from J. P. Morgan: ‘Boys, we’re going to a
picnic and the tickets cost $250 million’.
9.6 Notes 95
%CH09 Program for Chapter 9
%
% Illustrates delta hedging by computing an approximate
% replicating portfolio for a European call
%
% Portfolio is ‘asset’ units of asset and an amount ‘cash’ of cash
% Plot actual and theoretical portfolio values
randn(’state’,100)
clf
%%%%%%%%% Problem parameters %%%%%%%%%%%%
Szero = 1; sigma = 0.35;r=0.03; mu = 0.02;T=5;E=2;
Dt = 1e-2;N=T/Dt;t=[0:Dt:T];
%%%%%%%%%%%%%%%%%%%%%%%%%%%%%%%%
S=zeros(N,1); asset = zeros(N,1); cash = zeros(N,1);
portfolio = zeros(N,1); Value = zeros(N,1);
[C,Cdelta,P,Pdelta] = ch08(Szero,E,r,sigma,T-t(1));
S(1) = Szero;
asset(1) = Cdelta;
Value(1) = C;
cash(1) = 1;
portfolio(1) = asset(1)*S(1) + cash(1);
for i = 1:N
S(i+1) = S(i)*exp((mu-0.5*sigmaˆ2)*Dt+sigma*sqrt(Dt)*randn);
portfolio(i+1) = asset(i)*S(i+1) + cash(i)*(1+r*Dt);
[C,Cdelta,P,Pdelta] = ch08(S(i+1),E,r,sigma,T-t(i+1));
asset(i+1) = Cdelta;
cash(i+1) = cash(i)*(1+r*Dt) - S(i+1)*(asset(i+1) - asset(i));
Value(i+1) = C;
end
Vplot = Value - (Value(1) - portfolio(1))*exp(r*t)’;
plot(t(1:5:end),Vplot(1:5:end),’bo’)
hold on
plot(t(1:5:end),portfolio(1:5:end),’r-’,’LineWidth’,2)
xlabel(’Time’), ylabel(’Portfolio’)
legend(’Theoretical Value’,’Actual Value’)
grid on
Fig. 9.5. Program of Chapter 9: ch09.m.
96 More on hedging
9.2. By making reference to the limit definition
∂C
∂ S
= lim
δS→0
C(S + δS, t) − C(S, t)
δS
,
give an intuitive reason why ∂C/∂ S ≥ 0. Do the same for ∂ P/∂ S ≤ 0.
9.3. Using the expression (9.1), confirm the limiting behaviour for
∂C(S, t)/∂ S displayed in (9.7).
9.4. Using the expression (9.2), confirm the limiting behaviour for
∂ P(S, t)/∂ S displayed in (9.8).
9.5. Give a financial argument that explains why ∂ P(S, t)/∂S →−1atexpiry
for an in-the-money put option and ∂ P(S, t)/∂S → 0atexpiry for an out-
of-the-money put option.
9.7 Program of Chapter 9 and walkthrough
Our program ch09 implements a discrete hedging simulation and produces a picture like the lower
plots in Figures 9.1–9.3. It is listed in Figure 9.5. Here, S, asset, Value and cash are N by 1 arrays
whose ith entries store the asset price, asset holding, Black–Scholes option value and cash holding at
time t(i),respectively. After initializing parameters, we set up a for loop that updates the portfolio
as described in Section 9.2. The Black–Scholes function ch08 from Chapter 8 is used to find the
option value and the delta.
On exiting the loop we superimpose the left- and right-hand sides of (9.5), plotting at every fifth
time point.
PROGRAMMING EXERCISES
P9.1. Adapt ch09.m to investigate how the average discrepancy at expiry, (9.6),
varies as a function of δt.
P9.2. Perform a large-scale test for a call option in the style of Figure 9.4.
Quotes
The professors were brilliant at reducing a trade to pluses and minuses;
they could strip a ham sandwich to its component risks;
but they could barely carry on a normal conversation.
ROGER LOWENSTEIN (Lowenstein, 2001)
After closing about 200 000 option transactions
(that is separate option tickets)
over12years and studying about 70 000 risk management reports,
I felt that I needed to sit down and reflect on the thousands
of mishedges I had committed.
NASSIM TALEB (Taleb, 1977)
9.7 Program of Chapter 9 and walkthrough 97
It is probably safe to say that
the derivatives industry would be stuck in the psychedelic 60s,
and many talented mathematicians would still be
teaching freshman algebra for $20,000 a year
had Black, Scholes, and Merton not made their contribution.
DON M. CHANCE, ‘Rethinking Implied Volatility’ Financial Engineering News, January/
February 2003.
10
The Greeks
OUTLINE
• formulas for the Greeks
• financial interpretations
• confirmation that the Black–Scholes PDE is solved
10.1 Motivation
The Black–Scholes option valuation formulas (8.19) and (8.24) depend upon S, t
and the parameters E, r and σ .Inthis chapter we derive expressions for partial
derivatives of the option values with respect to these quantities. These results are
useful for a number of reasons.
• Traders like to know the sensitivity of the option value to changes in these quantities.
The sensitivities can be measured by these partial derivatives; see Exercise 10.1.
• Computing the partial derivatives allows us to confirm that the Black–Scholes PDE has
been solved.
• Examining the signs of the derivatives gives insights into the underlying formulas.
• The derivative ∂V/∂S is needed in the delta hedging process.
• The derivative ∂V/∂σ comes into play in Chapter 14, where we compute the implied
volatility.
We focus on the case of a call option. Exercise 10.7 asks you to do the same
things for a put.
10.2 The Greeks
Certain partial derivatives of the option value are so widely used that they have
been assigned Greek names and symbols,
1
:=
∂C
∂ S
(delta),
1
Vega is not actually a Greek name, and does not even qualify for a symbol.
99
100 The Greeks
:=
∂
2
C
∂ S
2
(gamma),
ρ :=
∂C
∂r
(rho),
:=
∂C
∂t
(theta),
vega :=
∂C
∂σ
(vega).
By differentiating C in (8.19), using (8.20) and (8.21), it is possible to find
explicit expressions for these quantities. Before launching into this process we
make note of two useful facts. First, it follows from (3.18) that
N
(x) =
1
√
2π
e
−
1
2
x
2
.
Our second fact,
SN
(d
1
) − e
−r(T−t)
EN
(d
2
) = 0, (10.1)
is to be proved in Exercise 10.2.
Differentiating with respect to S in (8.19) we have
= N(d
1
) + SN
(d
1
)
∂d
1
∂ S
− Ee
−r(T−t)
N
(d
2
)
∂d
2
∂ S
= N(d
1
) +
N
(d
1
)
σ
√
T − t
− Ee
−r(T−t)
N
(d
2
)
Sσ
√
T − t
.
Appealing to (10.1), we see that the second and third terms on the right-hand side
cancel, giving
= N(d
1
), (10.2)
a result that we used in Chapter 9. We then have
=
∂
∂ S
= N
(d
1
)
∂d
1
∂ S
=
N
(d
1
)
Sσ
√
T − t
. (10.3)
Next, differentiating C with respect to r we find that
ρ :=
∂C
∂r
= SN
(d
1
)
∂d
1
∂r
+ (T − t)Ee
−r(T−t)
N(d
2
) − Ee
−r(T−t)
N
(d
2
)
∂d
2
∂r
= SN
(d
1
)
T − t
σ
√
T − t
+ (T − t)Ee
−r(T−t)
N(d
2
)
− Ee
−r(T−t)
N
(d
2
)
T − t
σ
√
T − t
.
10.4 Black–Scholes PDE solution 101
As before, (10.1) allows us to cancel terms, and we find that
ρ = (T − t)Ee
−r(T−t)
N(d
2
). (10.4)
Similar analysis shows that
=
−Sσ
2
√
T − t
N
(d
1
) −rEe
−r(T−t)
N(d
2
) (10.5)
and
vega = S
√
T − tN
(d
1
), (10.6)
see Exercises 10.3 and 10.4.
10.3 Interpreting the Greeks
It is possible to interpret some of the Greek formulas from a financial viewpoint
and to check that they agree with intuition.
First we recall that the limiting behaviour of delta was characterized and inter-
preted in Section 9.3. We also know from Exercise 9.1 that >0uptoexpiry.
This makes sense, because an increase in the asset price increases the likely profit
at expiry.
From (10.4) we see that ρ>0 before expiry. To explain this we note that in-
creasing the interest rate is equivalent to lowering the exercise price E. (The value
of a fixed amount E at some fixed time in the future becomes less if the interest
rate increases.) This makes a payoff more likely, which increases the value of the
option.
The expression (10.5) shows that <0. This property could also be deduced
directly from the general, asset-model-independent argument in Section 2.6 con-
cerning the monotonicity of the time-zero call option value with respect to the
expiry date, see Exercise 10.5.
The vega in (10.6) is always positive before expiry. This can be understood by
considering that an increase in volatility leads to a wider spread of asset prices.
However, assets moving deeper out-of-the-money have no effect on the option
price (the payoff remains zero) while assets moving deeper into-the-money lead to
a greater payoff. Because of this asymmetry, increasing σ has a net positive effect.
We return to vega in Chapter 14.
10.4 Black–Scholes PDE solution
Having worked out the partial derivatives, we are in a position to confirm that
C(S, t) in (8.19) satisfies the Black–Scholes PDE (8.15). Using our expressions
102 The Greeks
for , , ρ and ,wehave
∂C
∂t
+
1
2
σ
2
S
2
∂
2
C
∂ S
2
+rS
∂C
∂ S
−rC =
−Sσ
2
√
T − t
N
(d
1
) −rEe
−r(T−t)
N(d
2
)
+
1
2
σ
2
S
2
N
(d
1
)
Sσ
√
T − t
+rSN(d
1
)
−r
SN(d
1
) − Ee
−r(T−t)
N(d
2
)
= 0.
10.5 Notes and references
Many texts present the formulas for the Greeks without getting into the nitty-gritty
of differentiation. Exceptions are (Kwok, 1998; Nielsen, 1999). For more infor-
mation on interpreting the Greek formulas, see (Hull, 2000; Kwok, 1998; Nielsen,
1999), for example.
EXERCISES
10.1. If F : R → R is differentiable, use the definition of the differentiation
process to explain why F
(x) measures the sensitivity of F to changes in
x.
10.2. Verify the identity
log
SN
(d
1
)
e
−r(T−t)
EN
(d
2
)
= 0,
and hence derive (10.1).
10.3. Establish (10.5) and (10.6).
10.4. Give a financial explanation why <0 for a put option (proved in
Exercise 9.1).
10.5. Show that the condition ∂C/∂t ≤ 0 can be deduced directly from the
conclusion in Section 2.6 that the time-zero call option value is a non-
decreasing function of the expiry date.
10.6. Using (10.1), show that the partial derivative ∂C/∂ E (which, sadly,
does not have a Greek name) satisfies
∂C
∂ E
=−e
−r(T−t)
N(d
2
).
Deduce that ∂C/∂ E < 0 and interpret this result.
10.7. Using the put–call parity identity (8.23), for each expression for a
partial derivative of C that appears in this chapter obtain an expression
10.5 Notes and references 103
function [C, Cdelta, Cvega, P, Pdelta, Pvega] = ch10(S,E,r,sigma,tau)
% Program for Chapter 10
% This is a MATLAB function
%
% Input arguments: S = asset price at time t
% E=exercise price
% r=interest rate
% sigma = volatility
% tau = time to expiry (T-t)
%
% Output arguments: C = call value, Cdelta = delta value of call
% Cvega = vega value of call
% P=Put value, Pdelta = delta value of put
% Pvega = vega value of put
%
% function [C, Cdelta, Cvega, P, Pdelta, Pvega] = ch10(S,E,r,sigma,tau)
if tau > 0
d1 = (log(S/E) + (r + 0.5*sigmaˆ2)*(tau))/(sigma*sqrt(tau));
d2 = d1 - sigma*sqrt(tau);
N1 = 0.5*(1+erf(d1/sqrt(2)));
N2 = 0.5*(1+erf(d2/sqrt(2)));
C=S*N1-E*exp(-r*(tau))*N2;
Cdelta = N1;
Cvega = S*sqrt(tau)*exp(-0.5*d1ˆ2)/sqrt(2*pi);
P=C+E*exp(-r*tau) - S;
Pdelta = Cdelta - 1;
Pvega = Cvega;
else
C=max(S-E,0);
Cdelta = 0.5*(sign(S-E) + 1);
Cvega = 0;
P=max(E-S,0);
Pdelta = Cdelta - 1;
Pvega = 0;
end
Fig. 10.1. Program of Chapter 10: ch10.m.
for the corresponding partial derivative of P.For each discussion of the
sign of a partial derivative of the call option value, give a discussion of the
corresponding sign for the put. In particular, show by example that ∂ P/∂t
may be positive or negative. Using your expressions, confirm that P(S, t)
satisfies the Black–Scholes PDE (8.15).
104 The Greeks
10.6 Program of Chapter 10 and walkthrough
The program ch10, listed in Figure 10.1, is an extended version of the function ch08 that returns
values of the call and put vega. These values will be needed by the program ch14 in Chapter 14. The
call vega formula is given by (10.6) and the put vega formula was derived in Exercise 10.7.
An example of the function in use is
>>S=2;E=2.5; r = 0.03; sigma = 0.25; tau = 1;
>> [C, Cdelta, Cvega, P, Pdelta, Pvega] = ch10(S,E,r,sigma,tau)
which outputs
C=0.0691
Cdelta = 0.2586
Cvega = 0.6470
P=0.4953
Pdelta = -0.7414
Pvega = 0.6470
PROGRAMMING EXERCISES
P10.1. Adapt function ch10.m to return more Greeks.
P10.2. Investigate the use of MATLAB’s symbolic toolbox to confirm the results
in this chapter.
Quotes
Proof: Use the Black–Scholes formula (6.46) and take derivatives.
The (brave) reader is invited to carry this out in detail.
The calculations are sometimes quite messy.
THOMAS BJ
¨
ORK (on calculating the Greeks) (Bj
¨
ork, 1998)
Iamsoglad I am a Beta,
the Alphas work so hard.
And we are much better than the Gammas and Deltas.
ALDOUS HUXLEY from Brave New World, 1932 (1894–1963)
You can overintellectualize these Greek letters.
One Greek word that ought to be in there is hubris.
DAVID PFLUG, source (Lowenstein, 2001)
Neither Black nor Scholes,
at first,
knew how to derive the solution to these complicated equations, . . .
MARK. P . KRITZMAN (Kritzman, 2000) with reference to the Black–Scholes PDE
11
More on the Black–Scholes formulas
OUTLINE
• irrelevance of the asset growth rate
• behaviour as time increases
• Black–Scholes surfaces
• re-scaling the formulas
11.1 Motivation
We now take the opportunity to reflect a little more on the Black–Scholes option
valuation formulas. In particular, Figure 11.3 is an attempt to squeeze everything
we have learnt into a single picture.
11.2 Where is µ?
The Black–Scholes formulas allow us to determine a fair price at time zero for
a European call or put option in terms of the initial asset price, S
0
, the exercise
price, E, the asset volatility, σ , the risk-free interest rate, r, and the expiry date,
T. Each of these quantities is known, with the exception of the asset volatility, σ .
Chapters 14 and 20 are concerned with the task of estimating σ using information
available from the market. A big surprise, and perhaps the most remarkable aspect
of the Black–Scholes theory, is that the option price does not depend on the drift
parameter, µ, which, from (6.11), determines the expected growth of the asset. A
consequence is that two investors could have wildly different views about what is
an appropriate value of µ for a particular asset and yet, if they agreed on the volatil-
ity and accepted the assumptions that go into the Black–Scholes analysis, they
would come up with the same value for the option. This phenomenon, which may
seem highly questionable at first glance, is a consequence of the fact that Black–
Scholes determines a fair value for the option – a value that can be recovered
105
106 More on the Black–Scholes formulas
using the risk-free delta hedging strategy and hence the value, in the presence of
arbitrageurs, that the forces of supply and demand dictate for the market.
Suppose that there are two speculators,
• Speculator A, who believes that the asset price will follow (6.9) with drift µ
A
and volatil-
ity σ , and
• Speculator B, who believes that the asset price will follow (6.9) with drift µ
B
and volatil-
ity σ .
Suppose the speculators wish to take a naked, long position on a European call
option – that is, they wish to buy the option without performing any accompany-
ing hedging. If µ
A
µ
B
then, presumably, Speculator A would find the Black–
Scholes option value more attractive than Speculator B. This does not contradict
the previous theory. A speculator who is willing to accept some risk may value
an option differently to the Black–Scholes formula. However, if you are selling
the option and wish to hedge in order to eliminate risk (and if you believe in the
Black–Scholes assumptions) then (8.19) and (8.24) are the relevant values.
11.3 Time dependency
Figure 11.1 shows the Black–Scholes values of a call and a put option, as func-
tions of asset price S, for certain fixed times t.Weused E = 1, r = 0.05, σ = 0.6
and took expiry date T = 1. Figure 11.2 shows the same information in three-
dimensional form.
In both cases, we see that as t approaches the expiry date T, the option value
approaches the hockey-stick payoff function. This will always be the case, as we
showed in Exercise 8.1. In the case of a call option, for each S, the value appears
to converge to the hockey stick monotonically from above as t approaches expiry.
This is also generic, since, as we saw in Section 10.3, the time derivative, theta,
is always negative. On the other hand, for the put option, the convergence is not
uniformly from above or below. This is consistent with Exercise 10.7, where you
were asked to show that a put’s time derivative can be negative or positive, see
Exercise 11.2.
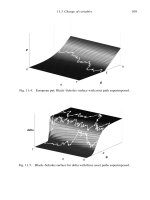
11.4 The big picture
Figure 11.3 draws the Black–Scholes European call option value, C(S, t),asa
surface above the (S, t)-plane, This emphasizes that C(S, t) is a smooth function
of S and t. Onto the C(S, t)-surface a solid white line adds the corresponding
C(S
i
, t
i
) values mapped out by a discrete asset path. This picture illustrates that
11.4 The big picture 107
0 0.2 0.4 0.6 0.8 1 1.2 1.4 1.6 1.8 2
0
0.2
0.4
0.6
0.8
1
S
C
Call
time= 0
time= 0.25
time= 0.5
time= 0.75
time=1
0 0.2 0.4 0.6 0.8 1 1.2 1.4 1.6 1.8 2
0
0.2
0.4
0.6
0.8
1
S
P
Put
time= 0
time= 0.25
time= 0.5
time= 0.75
time=1
Fig. 11.1. Option value in terms of asset price at five different times. Upper:
European call. Lower: European put.
0
0.5
1
1.5
2
0
0.2
0.4
0.6
0.8
1
0
0.5
1
1.5
S
t
C
0
0.5
1
1.5
2
0
0.2
0.4
0.6
0.8
1
0
0.5
1
t
S
P
Fig. 11.2. Three-dimensional version of Figure 11.1.
108 More on the Black–Scholes formulas
E
0
T
S
t
C
Fig. 11.3. European call: Black–Scholes surface with asset path superimposed.
• the Black–Scholes option value surface is smooth,
• an asset path is jagged,
• as time varies, an asset path maps out a jagged ‘option path’ over the smooth option
value surface.
Figure 11.4 repeats the exercise for a put option.
In Figure 11.5 we plot the delta surface, ∂C/∂ S, for a call option and superim-
pose three option paths. One option expires in-, one out-of- and one almost at-the-
money. As discussed in Section 9.3, the rapid gradient of the delta surface induces
large variations (and hence large swings in the amount of asset in the replicating
portfolio) when the option is close to being at-the-money. Note from (9.1)–(9.2)
that, since the vertical axis in the figure has no markings, the corresponding picture
for a put option would be identical.
11.5 Change of variables
On the face of it, the Black–Scholes value of a European call or put option depends
on the strike price, E,the expiry time, T , the volatility σ and the interest rate, r,
as well as the asset price S and time t.However, by a judicious re-scaling, we can
reduce the length of this list to two.