Re Academic Press Private Real Estate Investment_6 ppt
Bạn đang xem bản rút gọn của tài liệu. Xem và tải ngay bản đầy đủ của tài liệu tại đây (242.91 KB, 26 trang )
File: {Elsevier}Brown/Revises-II/3d/Brown-ch007.3d
Creator: iruchan/cipl-un1-3b2-1.unit1.cepha.net Date/Time: 23.12.2004/4:07pm Page:159/188
Most of academic finance and economics ‘‘assumes away’’ the complication
of income taxes. This can frustrate the reader who knows that taxes are a
reality and usually affect one’s decisions. In defense of academics, it should be
noted that working with U.S. income tax rates is frustrating. The code is a
moving target. Working with graduated tax rates requires use of a step
function, a rather inconvenient mathematical device. As this chapter deals
directly with taxes, we may not assume them away lest the entire subject
disappear. However, some assumptions are necessary in the interest of
simplicity. One of these is a flat tax rate. The alert reader knows that U.S.
income tax rates change with income levels, but our conclusions here will not
change by relaxing the flat tax assumption.
There are lessons for readers outside the United States. First, Section 1031
has been in the U.S. tax code since its inception. Congress intended citizens
have the right to defer tax on gains when transferring from one location to
another while remaining in the same business. This fosters important
incentives that contribute to the development of society. Second, taxation
policy affects behavior. The U.S. tax code in its present form is not a work of
art. Even the administration of Section 1031 transfers has become needlessly
complicated under the guise of ‘‘simplification.’’ Policymakers in other
countries may wish to proceed with caution before following the U.S. model.
Recent amendments to Section 1031 have had unintended consequences that
influence the market.
A primary justification for ignoring income taxes in other writings is that
all economic agents operate in a common income tax environment. The
marginal difference in tax brackets spanning different ranges of income
certainly affects the accuracy of any particular calculation, but these may be
viewed as de minimus. The central message of this chapter is that some capital
gain taxes may be delayed and some may actually be eliminated. This is a more
powerful effect than one of merely assuming all taxpayers are not taxed or
taxed at the same rate. Indeed, the point of this chapter is that some taxpayers
holding particular assets and transferring them in certain ways may reduce,
delay, or eliminate some taxes altogether.
Organized around a set of stylized examples, this chapter explores not only
the obvious benefits of exchanging, but some of the less obvious
disadvantages of a poorly thought-out exchange strategy. We will take the
usual approach to determine if the benefits exceed the costs.
Given that the investor has entrepreneurial abilities and tendencies, we will
look at:
The value of tax deferral three ways: (1) in nominal dollar terms, (2) as a
percentage of the capital gains tax due on a normal sale, and (3) as a
percentage of the value of the property to be acquired
The Tax Deferred Exchange 159
File: {Elsevier}Brown/Revises-II/3d/Brown-ch007.3d
Creator: iruchan/cipl-un1-3b2-1.unit1.cepha.net Date/Time: 23.12.2004/4:07pm Page: 160/188
The effect of tax deferral on risk
The cost of exchanging, not just the hard costs, but implicit costs often
overlooked
The alternatives of sale and repurchase, refinance, or simply hold for a
longer period
Examples in this chapter build on earlier examples. In a complex world it
is important to be able to isolate the most important variables on which
investment decisions rest. As we move through the exchange strategy, we
retain the burdensome minutiae that we labored over in earlier chapters. But
as many of those calculations involve nothing new, having mastered them in
earlier chapters, we now put them out of view. For instance, real estate is
usually financed with self-amortizing financing. There is no reason to have the
loan amortization calculation in the forefront of our present discussion.
Exchange or no exchange, loans are a fact of life, and their amortization is not
mysterious. The same can be said for depreciation, sale proceeds, and capital
gain calculations. All of these are computed with fairly simple algebraic
equations that need not be at center stage with the more important concept of
the tax deferred exchange.
VARIABLE DEFINITIONS
The examples in this chapter are similar to those in Chapter 4 describing basic
investment analysis.
2
For pedagogical reasons we included a number of
variables in Chapter 4 that are not needed here. For example, because
operational variables prior to net operating income are mathematically trivial,
they have been ignored here so that all examples in this chapter begin with
net operating income (NOI). The list of variables used in this chapter has
considerable overlap with that in Chapter 4 to which we add variables that
permit growth rates to be different in different years.
lc ¼ logistic constant when using the modified logistic growth
function
af ¼ acceleration factor when using the modified logistic growth
function
The electronic files that accompany this chapter provide a fully elaborated
set of examples in Excel format.
2
The important difference is that in Chapter 4 value is a function of a market rate of growth. Here
value is a function of both income growth and capitalization rate. The effect and importance of
this difference is illustrated in the electronic files for this chapter.
160 Private Real Estate Investment
File: {Elsevier}Brown/Revises-II/3d/Brown-ch007.3d
Creator: iruchan/cipl-un1-3b2-1.unit1.cepha.net Date/Time: 23.12.2004/4:07pm Page: 161/188
THE STRUCTURE OF THE EXAMPLES
The examples illustrating the ideas in this chapter are organized as follows.
1. The Base Case: Purchase–Hold–Sell. An initial ‘‘base case’’ (base)
is examined to provide background and context. In the base case
the investor merely purchases, holds for six years, and sells a
single property. During the holding period the value grows mono-
tonically.
2. Example 1: Modifying the Growth Projection. Example 1 (dataEG1)
deviates from the base case only by introducing the idea of growth at
different rates over different time periods (the logistic growth idea
discussed in Chapter 4) during the six-year holding period.
3. Example 2: The Tax Deferred Exchange Strategy. The second variation
from the base case involves two properties (dataEG2a and dataEG2b)
that are each held for three years in sequence. The second property is
acquired via exchange of the first property. Thus, the ownership of the
two properties spans the same time period as Example 1. Each property
grows in value under the same conditions as those assumed for
dataEG1.
4. The Sale-and-Repurchase Strategy: Tax Deferral as a Risk Modifier. The
outcome of the exchange strategy is then contrasted with the results
achieved via the taxable sale of the first property (dataEG2a) at the end
of year three, the purchase of the second property (dataEG2c) with the
after-tax proceeds of the sale of the first, and concluding with the
taxable sale of the second property at the end of three more years (again
a total of six).
5. The Sale-and-Better-Repurchase Strategy: The Cost of Exchanging.
The sale-and-repurchase strategy portion of Example 2 is re-examined
(dataEG2a and dataEG2d) using a lower price for the second
purchase, presumed to be achieved with superior negotiation
following the taxable sale of the first property. This addresses the
question of how much price discount is needed upon acquisition of
the second property to offset the value of tax deferral if exchanging is
not an option.
6. Example 3: Exchanging and ‘‘the Plodder.’’ In the last variation
(dataEG3a and dataEG3b) we repeat the same analysis as in Example 2,
but return to the monotonic growth of the base case. We then compare
the exchange outcome under those conditions with the sale and
purchase alternative (dataEG3a and dataEG3c). Finally, we return to
the base case assumptions to consider a longer term, 12-year buy-and-
hold strategy of a single property.
The Tax Deferred Exchange 161
File: {Elsevier}Brown/Revises-II/3d/Brown-ch007.3d
Creator: iruchan/cipl-un1-3b2-1.unit1.cepha.net Date/Time: 23.12.2004/4:07pm Page: 162/188
Each example and variation illustrates a different strength or weakness of
holding, selling, exchanging, and/or reacquiring property.
THE BASE CASE: PURCHASE–HOLD–SELL
Data for our base case project is entered in Table 7-1, followed by the rules of
thumb measures in Table 7-2. The final year of the multi-year projection is
shown in Table 7-3. For the terminal year reversion, we need calculations
TABLE 7-1 Base Case Inputs
dp $360,000 i
.095
⁄
12
noi $119,925 initln $875,000
txrt 0.35 t 360
dprt
1
⁄
27.5
r 0.13
land 0.3 k 6
cr
o
0.0936 scrt 0.075
g 0.03 cgrt 0.15
lc 0 recaprt 0.25
af 0 ppmt 0
units 22
TABLE 7-2 Rules of Thumb
Capitalization rate 0.0971
Price per unit $56,136
Cash-on-cash return 0.0824
Debt coverage ratio 1.36
Loan-to-value ratio 0.7085
TABLE 7-3 Terminal Year Operating Performance
Net operating income $139,025.94
Debt service $88,289.70
Depreciation $31,436.40
Income tax $9,785.96
After-tax cash flow $40,950.30
162 Private Real Estate Investment
File: {Elsevier}Brown/Revises-II/3d/Brown-ch007.3d
Creator: iruchan/cipl-un1-3b2-1.unit1.cepha.net Date/Time: 23.12.2004/4:07pm Page: 163/188
made at the time of sale, shown in Table 7-4. The npv and irr results for the
base case are shown in Table 7-5.
It is important to point out that the IRR in Table 7-5 is the after-tax IRR.
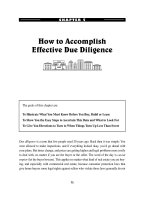
Graphically, in Figure 7-1, we see the components of the sale proceeds in the
base case. This sets the scene for the primary purpose of this chapter, which is
to examine the ramifications of NOT having to pay capital gains tax.
The Base Case represents a quite standard discounted cash flow (DCF)
analysis with monotonic growth over a fixed holding period terminating in a
taxable sale. Next, combining the modified logistic growth function described
in Chapter 4 with the exchange strategy, we relax some of these assumptions.
EXAMPLE 1—MODIFYING THE GROWTH
PROJECTION
First, we modify our data to reflect the entrepreneurial growth associated with
an early transformation period. Note that in the base case data the variables
for the logistic growth curve, lc and af, were zero. In Table 7-6 we see that in
TABLE 7-4 Terminal Year Equity Reversion
Sale price $1,474,655
Beginning loan balance $875,000
Ending loan balance $833,449
Original cost $1,235,000
Sale costs $110,599
Accumulated depreciation $188,618
Capital gain $317,674
Capital gains tax $66,513
Pre-tax net equity $530,607
After-tax net equity $464,094
TABLE 7-5 Base Case Net Present Value and Internal Rate
of Return
Base case
NPV $557
IRR 0.130351
The Tax Deferred Exchange
163
File: {Elsevier}Brown/Revises-II/3d/Brown-ch007.3d
Creator: iruchan/cipl-un1-3b2-1.unit1.cepha.net Date/Time: 23.12.2004/4:07pm Page: 164/188
Allocation of Sales Proceeds
$1,474,654
Loan Balance
$833,448
Sale Costs
$110,599
Equity Reversion
$464,094
CGTax
$66,512
FIGURE 7-1 Allocation of final sales proceeds for the base case.
TABLE 7-6 Input dataEG1 for Example 1
dp $360,000 i
.095
⁄
12
noi $119,925 initln $875,000
txrt 0.35 t 360
dprt
1
⁄
27.5
r 0.13
land 0.3 k 6
cr
o
0.0936 scrt 0.075
g 0.03 cgrt 0.15
lc 1.5 recaprt 0.25
af 2 ppmt 0
units 22
164 Private Real Estate Investment
File: {Elsevier}Brown/Revises-II/3d/Brown-ch007.3d
Creator: iruchan/cipl-un1-3b2-1.unit1.cepha.net Date/Time: 23.12.2004/4:07pm Page: 165/188
dataEG1 these variables take on real values. The first year measures (rules of
thumb) for this data are identical to the base case. The difference appears in
the ‘‘out’’ years as seen in Table 7-7.
There are considerable differences in terminal year outcomes (Table 7-8)
arising from the meaningful difference in cash flows over time (Table 7-7) due
to the entrepreneurial effort applied.
As usual, we are interested in the NPV and IRR measures under these
changed conditions (see Table 7-9). They are, understandably, superior to the
base case.
As the IRR for Example 1 is so much above the required rate of return
and the NPV is so large, one might argue that provided the required rate
of return, r, was chosen appropriately for a ‘‘normal’’ real estate investment of
TABLE 7-7 Six-Year After-Tax Cash Flow Comparison of
Base Case with Example 1
Year Base case CF($) EG1 CF ($)
1 29,677 29,677
2 31,828 71,039
3 34,031 74,98
4 36,28 77,34
5 38,59 79,471
6 40,950 81,54
TABLE 7-8 Terminal Year Comparison of Base Case with Example 1
Base ($) Data EG1 ($)
Sale price 1,474,655 Sale price 2,074,789
Beginning loan balance 875,000 Beginning loan balance 875,000
Ending loan balance 833,449 Ending loan balance 833,449
Original cost 1,235,000 Original cost 1,235,000
Sale costs 110,599 Sale costs 155,609
Accumulated depreciation 188,618 Accumulated depreciation 188,618
Capital gain 317,674 Capital gain 872,798
Capital gains tax 66,513 Capital gains tax 149,781
Pre-tax net equity 530,607 Pre-tax net equity 1,085,731
After-tax net equity 464,094 After-tax net equity 935,949
The Tax Deferred Exchange
165
File: {Elsevier}Brown/Revises-II/3d/Brown-ch007.3d
Creator: iruchan/cipl-un1-3b2-1.unit1.cepha.net Date/Time: 23.12.2004/4:07pm Page: 166/188
this type—independent of its need for renovation—the excess IRR or the entire
NPV represents the return due the investor for his entrepreneurial efforts. Be
that as it may, just changing the way value increases has considerably
increased the productivity of this investment (and the productivity of the
investor’s time). In Figure 7-2 we see that the total outcome and relative size
of the components are, as expected, considerably different.
Note that in both cases, at the time of sale meaningful investor capital goes
to the government in the form of capital gains tax. There are two points to be
made here. One, the obvious, is that an investor has a greater incentive to
defer taxes the larger the tax liability he faces. More importantly, if one
accepts the proposition that the excess IRR or the positive NPV represents a
return on his time, the act of deferring the tax on that portion of the gain
represents an act of deferring taxes on compensation for the investor’s efforts. The
benefit is analogous to that offered employees via corporate retirement and
401(k) plans. But in this case, the outcome is more directly influenced by the
investor’s entrepreneurial management style. In the long run, this homegrown
TABLE 7-9 Base Case and Example
1 IRR and NPV Comparisons
Base NPV $557
DataEG1 NPV $353,158
Base IRR 0.130351
DataEGI IRR 0.298681
Allocation of Sales Proceeds
$2,074,788
(b)
Loan Balance
$833,448
Sale Costs
$155,609
CG Tax
$149,781
Equity Reversion
$935,949
Allocation of Sales Proceeds
$1,474,654
(a)
Loan Balance
$833,448
Sale Costs
$110,599
CG Tax $66,512
Equity Reversion
$464,094
FIGURE 7-2 Allocation of sales proceeds for base case and Example 1.
166 Private Real Estate Investment
File: {Elsevier}Brown/Revises-II/3d/Brown-ch007.3d
Creator: iruchan/cipl-un1-3b2-1.unit1.cepha.net Date/Time: 23.12.2004/4:07pm Page: 167/188
deferred compensation plan amounts to a pre-tax conversion of human capital
into non-human capital.
EXAMPLE 2—THE TAX DEFERRED
EXCHANGE STRATEGY
To examine this further, we look at the same investment period, six years,
during which, rather than hold a single property, we acquire two properties in
sequence. Each will be held three years, each require entrepreneurial effort,
and each will undergo the early year rapid improvement in value due to those
efforts. Thus, the entrepreneurial impact occurs twice, and the tax otherwise
due on the gain attributable to entrepreneurial effort associated with the first
property will be deferred into the second property.
We will keep many of the same assumptions regarding growth rates,
income tax rates, expense ratios, and rules of thumb from the base case
example. Thus, both properties in this example will be presumed to be
acquired on the same economic terms, with the second property differing
from the first only in scale.
The data for the first property (dataEG2a) shown in Table 7-10 are the
same as the data in Example 1, except for the shorter holding period resulting
from a terminal year of 3.
Hence, the acquisition standards for the first property, as represented by
the rules of thumb reflecting first year performance, remain identical to those
in Table 7-2.
To make the comparison as fair as possible, for the second property we will
again replicate the acquisition standards from the first property. That is, we
wish the first year rule of thumb ratios in the second property to be the same
as those for the first property. The purpose of this is to hold constant a kind of
risk standard, the assumption being that two properties with the same loan-
to-value (LTV) ratio and debt coverage ratio (DCR) expose the investor to
approximately the same risk. While not perfect, this approach is useful in a
stylized example such as this for reasons that will become apparent later. To
accomplish this we will ‘‘back in’’ to some of the values in the second property
in order to hold first year rule of thumb measures constant. One consequence
of this is that some of the values may reflect unrealistic odd numbers, which
in practice would likely be rounded to the nearest $1,000.
The ability to sell a property and defer payment of income taxes is indeed
cause to celebrate. But there is a price attached. Any gain not recognized for
tax purposes on disposition cannot be included in the tax basis of the newly
acquired property and thus is not eligible for depreciation. The practical effect
of this is to transfer the basis from the old property to the new, an
The Tax Deferred Exchange 167
File: {Elsevier}Brown/Revises-II/3d/Brown-ch007.3d
Creator: iruchan/cipl-un1-3b2-1.unit1.cepha.net Date/Time: 23.12.2004/4:07pm Page: 168/188
accounting task known as an exchange basis adjustment. The exchange basis
adjustment then determines the depreciation deduction available for the
second property.
Most of the accounting complexity in the exchange basis adjustment arises
from partially tax deferred, delayed, or reverse exchanges. In the interest of
simplicity, we will assume the exchange is concurrent and fully tax deferred.
Qualifying for this is not difficult. One need only acquire a property with
at least as much equity and at least as much debt as the property disposed.
Stated differently, except as may be necessary to pay transaction costs, one
may not take any money out of the transaction (such money, known as ‘‘boot
received’’ must be zero) and one must not be relieved of debt when the
comparing debt on the new property to debt on the old (net mortgage
relief must be zero).
EXCHANGE VARIABLE DEFINITIONS
Exchange variable definitions, having their primary influence on the exchange
basis adjustment, are shown below.
New loan ¼ new loan on acquired property
Old loan ¼ loan on disposed property at time of
disposition
Mortgage relief ¼ mortgage relief in the exchange
Total boot ¼ total boot received from the transaction
Boot paid ¼ total boot paid into the transaction
Acquired equity (new equity) ¼ equity in acquired property (forced to
be equal to the pre-tax sales proceeds
from the prior property)
TABLE 7-10 Data Input dataEG2a for Example 2a
dp $360,000 i
.095
⁄
12
noi $119,925 initln $875,000
txrt 0.35 t 360
dprt
1
⁄
27.5
r 0.13
land 0.3 k 3
cr
o
0.0936 scrt 0.075
g 0.03 cgrt 0.15
lc 1.5 recaprt 0.25
af 2 ppmt 0
units 22
168 Private Real Estate Investment
File: {Elsevier}Brown/Revises-II/3d/Brown-ch007.3d
Creator: iruchan/cipl-un1-3b2-1.unit1.cepha.net Date/Time: 23.12.2004/4:07pm Page: 169/188
Net mortgage relief ¼ net mortgage relief after credit for boot
paid
Accumulated depreciation ¼ the accumulated depreciation taken
on the first property during holding
period one
Indicated gain (potential gain) ¼ indicated if property is sold
Recognized gain ¼ gain recognized for tax purposes
New adjusted cost basis ¼ new adjusted cost basis in acquired
property
New land portion ¼ new land allocation of acquired
property
New building portion ¼ new building allocation of acquired
property
New annual depreciation ¼ new depreciation allowance on
acquired property
Some of the data for the exchange of tax basis into the second property
comes from the pre-tax conclusion of holding the first property, as shown in
Table 7-11.
The exchange of basis adjustment results in the new property having what
is called a ‘‘carryover basis,’’ the complete computations for which may be
found in the electronic files for this chapter. A summary of the values for this
example is shown in Table 7-12. Note that the last item on the list is the
annual depreciation deduction for the new property. This deduction is smaller
than it would be if the same size property were purchased instead of acquired
by exchange. This is a disadvantage of exchanging that must be overcome by
some compensating benefit. One of our tasks here is to explore and quantify
that benefit.
Note that the pre-tax equity reversion for the first property equals the
equity acquired in the second property. The equity reversion for the first
TABLE 7-11 Data for Exchange of Tax Basis
Potential gain $671,448 New equity $954,986
Original cost $1,235,000 Boot paid 0
Accumulated
depreciation
$94,309 Total boot 0
Sale costs $146,930 Building depreciation rate
1
⁄
27.5
Old loan $857,154 New land percent of property 0.3
New value $3,276,132
The Tax Deferred Exchange
169
File: {Elsevier}Brown/Revises-II/3d/Brown-ch007.3d
Creator: iruchan/cipl-un1-3b2-1.unit1.cepha.net Date/Time: 23.12.2004/4:07pm Page: 170/188
property is computed after the payment of mortgage balance and sales costs,
but before payment of capital gain tax.
Table 7-13 shows the input data for the two properties. Comparing the
two, we see many similarities. In fact, the only differences are in the size of the
property (in dollar value and number of units), the loan, the down payment,
and the net income. We assume ratios, financing conditions, tax rates, land
allocations, and growth expectations are the same.
We assume the properties are located in the same area, thus making
somewhat realistic the fact that the acquisition standards of the second
property are similar to those of the first property. In any stylized example, one
can find contradictions. The price per unit for both properties at the time of
the exchange transaction (disposition of the first property and acquisition of
the second property) has been forced to be approximately the same, but the
capitalization rate for the acquired property is below the one sold (which
means that cri
2b
< cro
2a
). An argument could be made for reversing these, but
because any such argument would rely on the introduction of specific facts,
such argument is no better than the one that can be made for the data as
presented.
Based on the above, the second property is acquired under the same
general income/price conditions as the first property. The rules of thumb for
the two properties in Table 7-14 are the same except for price per unit
(because the second property is acquired three years later) and after-tax cash
on cash return (because of the reduced depreciation arising from the
carryover basis). Important to our discussion later in this chapter, note that
two risk variables, loan-to-value ratio and debt coverage ratio, are the same.
The net effect is that, midway in our investor’s six-year real estate
investment, he has sold a property, the value of which he had maximized, and
TABLE 7-12 Carryover Basis for Second Property
New loan $2,321,146
Mortgage relief 0
Net mortgage relief 0
Equity acquired $954,986
Value acquired $3,276,132
Indicated gain $671,448
Recognized gain 0
New adjusted cost basis $2,604,683
New land allocation $781,405
New building allocation $1,823,278
New annual depreciation $66,301
170 Private Real Estate Investment
File: {Elsevier}Brown/Revises-II/3d/Brown-ch007.3d
Creator: iruchan/cipl-un1-3b2-1.unit1.cepha.net Date/Time: 23.12.2004/4:07pm Page: 171/188
acquired a property to which he will apply the same entrepreneurial effort.
It is meaningful that the transfer of his maximized equity to a property in
need of his talent has been done without the payment of income taxes
(something not easily accomplished when one invests in financial assets).
TABLE 7-13 Example 2 Input Data for the First Property (dataEG2a) and the Second Property
(dataEG2b)
dataEG2a dataEG2b
down payment 360000 down payment 954986
initial net operating income 119925 initial net operating income 318130
investor income tax rate 0.35 investor income tax rate 0.35
building depreciation rate 0.0363636 building depreciation rate 0.0363636
land percent of property 0.3 land percent of property 0.3
capitalization rate at sale 0.10048 capitalization rate at purchase 0.0971053
monotonic growth 0.03 monotonic growth 0.03
logistic constant 1.5 logistic constant 1.5
acceleration factor 2 acceleration factor 2
interest rate 0.00791667 interest rate 0.00791667
initial loan balance 875000 intial loan balance 2321146
total amortization period 360 total amortization period 360
investor required rate of return 0.13 investor required rate of return 0.13
terminal year 3 terminal year 3
selling cost rate 0.075 selling cost rate 0.075
capital gain rate 0.15 capital gain rate 0.15
recapture rate 0.25 recapture rate 0.25
prepayment penalty 0 prepayment penalty 0
number of units 22 number of units 37
TABLE 7-14 Rules of Thumb for Two Properties in the Exchange Sequence
dataEG2a dataEG2b
Capitalization rate 0.0971053 Capitalization rate 0.0971053
Price per unit $56,136.4 Price per unit $88,544.1
Cash-on-cash return 0.0824367 Cash-on-cash return 0.0761728
Debt coverage ratio 1.35831 Debt coverage ratio 1.35831
Loan-to-value ratio 0.708502 Loan-to-value ratio 0.708502
The Tax Deferred Exchange
171
File: {Elsevier}Brown/Revises-II/3d/Brown-ch007.3d
Creator: iruchan/cipl-un1-3b2-1.unit1.cepha.net Date/Time: 23.12.2004/4:07pm Page: 172/188
The final step is to combine the performance of the two Example 2
properties (dataEG2a and dataEG2b) over a six-year holding period and to
compare that outcome to Example 1 wherein a single property was held for
six years. Although one can also illustrate intertemporal income and cash
flow, Figure 7-3 reflects only the results of selling the property at the end of
six years. The exchange strategy, of course, yields a larger outcome.
Using the exchange strategy, the NPV is $1,039,897 and the IRR is
46.205%. Both of these are calculated over the entire six years, including the
cash flows from both properties and the after-tax equity reversion from the
second property. For simplicity, we assume the second property is disposed of
in a taxable sale, although there is no reason one could not merely continue
with another exchange.
One may compute an IRR of 42.15% for the second property only using its
cash flows and after-tax sale reversion. But there is a problem with this in that
the equity reversion for property two includes the payment of tax on capital
gains deferred from property one. Thus the IRR for property two is calculated
using a capital gain that arises, in part, from depreciation attributable to
property one. But the calculation does not consider the associated benefit of
property one cash flows. Thus, such an IRR solely for property two is not
correct. To avoid this distortion, individual properties in a series of exchanges
after the first one should only be evaluated on a pre-tax basis for IRR and NPV
purposes.
The fact that after-tax IRRs should be only calculated on the cumulative
and aggregate outcomes of all properties in a series underscores an important
point. The decision to acquire investment realty is often a lifestyle decision.
The investment is long term not only from the standpoint of how long one
holds individual properties, but from the length of time measured by how
long one holds a series of properties. In a way this introduces a different sort
of ‘‘portfolio,’’ one that includes a number of properties held sequentially
rather than at the same time. Investors who put all their eggs in one basket
LnBal SC CGT ER
500,000
1,000,000
1,500,000
2,000,000
Allocation of Sales Proceeds
$5,196,898 EG2
$2,074,789 EG1
FIGURE 7-3 Sale proceeds comparison between Example 1 and Example 2.
172 Private Real Estate Investment
File: {Elsevier}Brown/Revises-II/3d/Brown-ch007.3d
Creator: iruchan/cipl-un1-3b2-1.unit1.cepha.net Date/Time: 23.12.2004/4:07pm Page: 173/188
and watch (also change and improve) that basket move their eggs from basket
to basket tax free and measure the results of their portfolios at the end of
the last investment after the outcome of a sequence of property investments
is known.
There are ramifications for policymakers in emerging capitalist countries
where income tax laws are being formulated. The early architects of the U.S.
tax code believed it was important to the development of society to keep
capital in the hands of private entrepreneurs. The decision to permit tax
deferred exchanging in a society has repercussions on the development of that
society’s built environment and long term investment.
We mentioned at the beginning of this chapter that for some investors
capital gain taxes may be completely eliminated. This happens if the sum of
all holding periods exceeds the investor’s remaining life, because under
present U.S. estate tax law capital gain taxes are forgiven at death. The
practical result of this is that the estate tax effectively takes the place of the
capital gains tax. As estate tax rates for large estates may be more than capital
gain rates, care should be taken not to overuse the exchange strategy.
3
THE VALUE OF TAX DEFERRAL
An interesting empirical question arises over whether investors, seeking tax
deferral, pay more for property they acquire via an exchange than they would
have if they had merely purchased the property. Some investors view the
deferral of taxes as ‘‘an interest free loan from the government.’’ This is
questionable reasoning in that it assumes that investors have no money of
their own, but are merely custodians of the government’s money. Regardless,
the incentives are aligned to make tax deferral attractive, and investors are
tempted to pay extra to get it. One needs to know the value of tax deferral.
Using the tools in this chapter we can explore this value.
The capital gains tax on the $671,448 potential gain shown in Table 7-11,
should property one in Example 2 (dataEG2a) be sold, is $110,148. Given the
three-year holding period of the first property, one representation of the value
of the tax deferral is nothing more than the value (present or otherwise) of the
earnings on the taxes unpaid on the sale of property one that become due
upon the sale of property two. A critical choice is the rate of return used to
3
As this is being written, the U.S. estate tax code is in a state of considerable uncertainty. The
taxable portion of estates is dropping, and the entire tax is due to expire in several years and then
a year later to be restored to the condition it was prior to the changes. No one can predict the
destination of this very political matter, and current tax law should be consulted at the time plans
are made.
The Tax Deferred Exchange
173
File: {Elsevier}Brown/Revises-II/3d/Brown-ch007.3d
Creator: iruchan/cipl-un1-3b2-1.unit1.cepha.net Date/Time: 23.12.2004/4:07pm Page: 174/188
calculate those earnings. If we assume the IRR from these two properties is the
investor’s average return, the nominal dollar value of tax deferral is simply
Deferred Tax Ãð1þIRRÞ
holding period of property two
ÀDeferred Tax
ð7-1Þ
Knowing this, we may also be interested in how the value of tax deferral
compares to the tax itself. Additionally, we could be interested in how the
value of tax deferral compares to the purchase price of the property acquired.
4
Using the 46.205% achieved IRR as the expected future rate of return and a
holding period of three years, Table 7-15 shows that the value of the tax
deferral is roughly twice the amount of the tax and about 7% of the value of
the target acquisition property. These two measures give us some sense of
scale as to how important the tax benefits are in the big picture.
The nominal dollar amount is considerable, but obviously sensitive to the
compounding rate chosen. If a more modest return such as 15% is used, the
value for the same holding period is, however measured, less, as seen in
Table 7-16.
This reduction may be overcome by increasing the holding period, as in
Table 7-17.
The graph in Figure 7-4 demonstrates the power of this strategy as the
return to one’s entrepreneurial effort and/or holding period increases.
Those with the ability to optimize opportunities, not surprisingly, benefit
more from tax deferral, but so do those who hold the property longer, even if
the IRR is moderate.
TABLE 7-15 The Value of Tax Deferral
Value (IRR ¼ 0.46205, HP ¼ 3 years) $234,094
Value as a percent of capital gains tax due 2.125
Value as a percent of acquisition price of new property 0.0715
TABLE 7-16 The Value of Tax Deferral if Investment Return is Less
Value (IRR ¼ 0.15, HP ¼ 3 years) $57,373
Value as a percent of capital gains tax due 0.520875
Value as a percent of acquisition price of new property 0.017513
4
Taking the present value of any of these measures is, of course, possible and would reduce them
all. This introduces the additional complexity of deciding what discount rate to use, something we
leave for the reader’s reflection and experimentation.
174 Private Real Estate Investment
File: {Elsevier}Brown/Revises-II/3d/Brown-ch007.3d
Creator: iruchan/cipl-un1-3b2-1.unit1.cepha.net Date/Time: 23.12.2004/4:07pm Page: 175/188
If one pays an additional ‘‘premium’’ to the seller to accommodate the
exchange, several things happen. Most importantly, the value of the deferral is
reduced because the price of the second property is higher. There are ancillary
effects, some of which ease the pain of the higher price. The basis is higher, so the
depreciation deduction is higher. Also, the gain on sale is less, thus capital gain
taxes are less. Overpaying for the property does not necessarily entitle the
buyer to market appreciation on the overpayment. So it is unreasonable to
assume that nominal dollar growth will increase. Finally, paying a higher
price involves either adding equity or debt, a decision that has its own set
of ramifications.
The net of these effects can never be positive, thus never recommends
paying a higher price. The moral of the story is the same as it has always been:
It always cheaper to pay taxes than lose money. One should not make busi-
ness decisions based on tax consequences, even when those tax consequences
are superficially as compelling as deferring a large capital gains tax.
TABLE 7-17 The Value of Tax Deferral if Investment Return is Less, but the
Property is Held Over a Longer Holding Period
Value (IRR ¼ 0.15, HP ¼ 8.15 years) $233,936
Value as a percent of capital gain tax due 2.12382
Value as a percent of acquisition price of new property 0.071406
15%
25%
35%
Rate of Return
2
4
6
8
Holdin
g
Period
0
$1Mil
$2 Mil
Value
FIGURE 7-4 Value of tax deferral as return and holding period changes.
The Tax Deferred Exchange
175
File: {Elsevier}Brown/Revises-II/3d/Brown-ch007.3d
Creator: iruchan/cipl-un1-3b2-1.unit1.cepha.net Date/Time: 23.12.2004/4:07pm Page: 176/188
THE SALE-AND-REPURCHASE STRATEGY:TAX
DEFERRAL AS A RISK MODIFIER
Next, let us investigate just what affect tax deferral has on the final outcome as
measured by the NPV and IRR. The way to approach this is first to calculate
the outcome if the first property had been sold and a second property had
been purchased with the after-tax proceeds of property one. We begin by
recalling from the left side of Table 7-13 the data inputs that lead to the profile
and outcome of the first property in Example 2, dataEG2a. The three-year
operating history produces the annual cash flow and reversion shown in
Table 7-18.
One consequence of the payment of capital gains tax is that the funds
available for purchasing another property are less than they would have been
if the first property was exchanged. A decision must be made regarding the
size of the second property. One may either (a) purchase a smaller property
using the same proportion of debt; (b) purchase the same size property by
adding cash from other sources in the amount of the cash paid in taxes;
(c) incur additional debt to increase the size of the purchase; or (d) combine
the foregoing alternatives in various ways. For the moment we will assume
that leverage approximates risk, and if we wish to hold risk constant we will
employ no more leverage in our sale-and-repurchase strategy than we
would have if we exchanged. This assumption leads to determining the size
of the second property purchased by the loan-to-value ratio (ltv). Some
algebraic rearrangement of the basic real estate valuation identities will
convince you that one can produce the net operating income from
capitalization rate, ltv and down payment, three variables that may be
derived from dataEG2a.
noi ¼ capitalization rate down paymentþ
down payment Ãltv
1 À ltv
ð7-2Þ
TABLE 7-18 Three-Year Summary of the First Property in
Example 2 (dataEG2a)
Year Cash flow Reversion Total
1 $29,677 — $29,677
2 $71,039 — $71,039
3 $74,986 $844,838 $919,824
176 Private Real Estate Investment
File: {Elsevier}Brown/Revises-II/3d/Brown-ch007.3d
Creator: iruchan/cipl-un1-3b2-1.unit1.cepha.net Date/Time: 23.12.2004/4:07pm Page: 177/188
A closer look at the last term in Equation (7-2) discloses that it is the initial
loan balance expressed in terms of the ltv and down payment.
initial loan balance ¼
down payment Ãltv
1 À ltv
ð7-3Þ
We will assume, as we have before, that the second property is purchased
in the same geographic area as the first property and has a similar
capitalization rate. We will initially assume that the second property is
acquired with the same percentage of debt (ltv) as both the first property and
as the exchange property would have been. With these assumptions we begin
to build a set of data inputs for a new second property to purchase. Recall the
going-out capitalization rate for property one (dataEG2a in Table 7-13) was
0.10048. Using this capitalization rate, the after-tax equity reversion of
property one as down payment, and the assumed debt ratio, net operating
income for the second property becomes $291,216 and the initial loan is
$2,053,425. Inserting this information into the dataset using equations
dependent on ltv for the initial loan amount and net operating income, we
have inputs for a second, this time purchased, property two (dataEG2c). Using
a 70.8502% ltv, we can produce the value of all the inputs for purchased
property two (see Table 7-19).
Adding down payment to initial loan gives the value of the purchased
property two of $2,898,262, which is $377,870 less than the $3,276,132 value
of the exchange-acquired property two (dataEG2b). This $377,870 difference
is, therefore, unavailable to grow under the owner’s entrepreneurial direction.
Our interest is in learning how the absence of this capital affects the return
after crediting back certain advantages of the purchase-and-sale strategy.
TABLE 7-19 Data Input dataEG2c for Example 2c
dp $844,838 i
.095
⁄
12
noi $291,216 initln $2,053,425
txrt 0.35 t 360
dprt
1
⁄
27.5
r 0.13
land 0.3 k 3
cr
o
0.103971 scrt 0.075
g 0.03 cgrt 0.15
lc 1.5 recaprt 0.25
af 2 ppmt 0
units 33
The Tax Deferred Exchange
177
File: {Elsevier}Brown/Revises-II/3d/Brown-ch007.3d
Creator: iruchan/cipl-un1-3b2-1.unit1.cepha.net Date/Time: 23.12.2004/4:07pm Page: 178/188
One such advantage is the higher depreciation deduction. Table 7-20 shows
a comparison of the results under the two strategies.
Suppose we attempt to replicate the exchange NPV and IRR results in the
sale-and-repurchase strategy by adding leverage. Some trial and error with the
ltv argument leads us to an equivalent NPV if we borrow 73.93% rather than
70.85% of the purchase price. This demonstrates that tax deferred exchanging
can be viewed as a risk modifier. The NPV for the exchange strategy was
achieved with less leverage than the NPV for the sale-and-repurchase strategy.
Provided one accepts leverage as a measure of risk, the exchange strategy may
be seen as involving less risk than the sale-and-repurchase strategy. Oddly,
this result imparts some credibility to the flawed ‘‘interest free loan from the
government’’ idea. By exchanging the investor retains his capital in his
investment free of tax. Therefore, he does not have to borrow the same funds
from a lender to whom he would pay interest.
THE SALE-AND-BETTER-REPURCHASE STRATEGY:THE
COST OF EXCHANGING
Earlier we said that one should never make business decisions based on tax
consequences. This is a corollary of a broader truism: It is cheaper to pay
taxes than lose money, something that is always true when tax rates are less
than 100%. Recall above that, given a moderate IRR of 15% and a short
holding period, the $57,373 value of tax deferral as a percentage of the acquired
property from Table 7-16 was a rather modest 1.7513%. Suppose that tax
deferred exchanges carry additional transaction costs. They do in a real sense
in that specially qualified brokers, attorneys, tax accountants, and escrow
holders are required, all of whom are aware of the tax benefit and how their
special skills make tax deferral possible. Suppose further that some aspect of
the exchange inconveniences the seller of the target property in that he is
exposed to additional complexity, risk the transaction does not close, and
possible delays. Equally plausible is the fact that the seller is aware that the
buyer will enjoy tax benefits from the seller’s accommodation of the exchange
process, for which he attempts to extract a premium price. All of these costs
TABLE 7-20 Exchange vs. Sale and Repurchase
Exchange Sale and repurchase
NPV $1,039,897 $957,920
IRR 0.46205 0.447485
178 Private Real Estate Investment
File: {Elsevier}Brown/Revises-II/3d/Brown-ch007.3d
Creator: iruchan/cipl-un1-3b2-1.unit1.cepha.net Date/Time: 23.12.2004/4:07pm Page: 179/188
may be avoided if the buyer approaches the seller with a cash offer to
purchase free of exchange complications.
With that in mind, let us equate these costs with ‘‘losing money’’ in the
pursuit of tax deferral. We will assume an IRR of 25%, about midway between
the moderate 15% and the aggressive 46% used in earlier discussions making
the value of tax deferral $104,985. We are interested in the overall results of a
taxable sale followed by a purchase that is economically ‘‘better’’ than the
exchange. This would be a purchase characterized by savings—in the form of
a lower price—at least equal to the value of the tax deferral. Taking the
opposite perspective, we ask the question: What discount must be offered the
buyer as an offset in a case where tax deferral is unavailable?
Thus, the new property which under dataEG2b was to be acquired for
$3,276,132 is purchased at a $104,985 discount for $3,171,147. Suppose
further that the entire discount is applied to the downpayment, making it
$850,001 rather than $954,986. The problem is that the after-tax equity
reversion from the sale of property 2a is $844,838, which is slightly less than
the $850,001 downpayment required. To overcome this we assume the
downpayment on the discounted property is the minimum of either (1) the
amount that would have been invested less the discount or (2) the amount
realized from the sale after taxes. The minimum in this case is $844,838. This
makes the initial loan balance at purchase $2,326,309 and completes the
dataset needed for this example, which we name dataEG2d (see Table 7-21).
5
The IRR for the aggregate of the two properties is 45.9464%. This IRR is
about one-quarter of a percent below that which would have been achieved if
the second property had been acquired at a higher price but with tax deferred
exchange proceeds. Ignoring the 0.0025 as trivial and assuming the actual
value is the lower price, the net effect of an exchange at a higher price is to
employ untaxed dollars to pay the premium necessary to achieve tax deferral.
In essence, this gives all the benefits of tax deferral to the seller. One must not
lose sight of the fact that the taxes, even if deferred, are eventually due
(suggesting that taxes are inevitable).
All of this leads us to believe that while tax deferral is a powerful benefit,
one cannot justify ‘‘paying’’ for tax deferral. Only if the target property can be
acquired via exchange under the same conditions as it would have been purchased
outright can the exchange acquisition be justified. For the buyer–exchangor we
have modeled here, we find that he must keep all the benefits of the exchange
and not transfer any of them to the seller in the form of a higher price. Under
5
The reader may find slight differences between the amounts produced by Mathematica which
was used to produce the text, and those produced by Excel which produced the electronic files on
the CD Rom. These differences may be traced to the different ways the two programs round
decimals.
The Tax Deferred Exchange
179
File: {Elsevier}Brown/Revises-II/3d/Brown-ch007.3d
Creator: iruchan/cipl-un1-3b2-1.unit1.cepha.net Date/Time: 23.12.2004/4:07pm Page: 180/188
these assumptions, the taxes remain due and are paid after a short deferral.
The value of tax deferral is comparatively slight and must be protected.
One must keep in mind the effect of the alternative use of the funds and the
holding period. As the potential IRR available in the acquired property and/or
the holding period for the acquired property increases, the importance of the
conclusion in any specific case changes. But the conclusion itself never does.
One can never gain by giving tax dollars both to the seller and a few years
later to the government.
If the exchangor at the time of his taxable disposition of the last property
can find a buyer with exchange motives from whom he can extract an
offsetting benefit in the form of a higher price, he may recover, albeit delayed,
all or part of any premium he may have paid at the time of his tax deferred
acquisition. Everyone participating in such market activity contributes to a
sort of ‘‘tax bubble’’ that bursts if Congress suddenly changes some part of the
law that reduces or eliminates the tax benefit of exchanging.
6
The last buyer
who paid for tax benefits in the form of a higher price will find no one when
it is time to sell who is willing to pay an equivalent increment after the tax
benefit is reduced or missing.
At the beginning of this chapter we said that we would avoid the many
intricate details necessary to consummate a qualified tax deferred exchange.
But we also alluded to one such matter in a passing reference to the delayed or
so-called ‘‘Starker’’ exchange. This detail deserves special attention. When
originally conceived, the qualified tax deferred exchange was conducted as a
concurrent transfer of one property for another. The delayed technique grew
out of a series of IRS court cases in the 1970s involving family members
TABLE 7-21 Data Input dataEG2d for Example 2d
dp $844,838 i
.095
⁄
12
noi $318,130 initln $2,326,309
txrt 0.35 t 360
dprt
1
⁄
27.5
r 0.12
land 0.3 k 3
cr
o
0.10381 scrt 0.075
g 0.03 cgrt 0.15
lc 1.5 recaprt 0.25
af 2 ppmt 0
units 33
6
Congress did just that as this book was being written. Capital gain tax rates were lowered in
2003, reducing the benefit of exchanging incrementally.
180 Private Real Estate Investment
File: {Elsevier}Brown/Revises-II/3d/Brown-ch007.3d
Creator: iruchan/cipl-un1-3b2-1.unit1.cepha.net Date/Time: 23.12.2004/4:07pm Page: 181/188
of T. J. Starker that led to the authorization of a non-simultaneous exchange.
But among the different districts of the U.S. Tax Court, the authorization
was uneven, with some more permissive and some more restrictive. In 1986
Congress stepped in and codified procedures that became Treasury
regulations in 1991. These procedures are intricate and should be carefully
followed by anyone planning an exchange. However, there are important
general caveats that must not be overlooked.
In order to conduct a non-simultaneous exchange and still qualify for tax
deferral, among other things, one has 45 days after the close of his original
disposition to identify the target acquisition property. The taxpayer then has
the shorter of (a) 180 days (which includes the 45 days) or (b) the period
elapsing between the close of the original disposition and the close of the tax
year (as evidenced by the filing of a tax return) to complete the acquisition. A
common scenario goes like this: The seller lists his property and begins
looking for a target acquisition. A buyer is located who, for whatever reason,
must close the purchase on his own, shorter time schedule (perhaps his 180
day period is about to expire). The seller is encouraged by his broker to close
the sale, promising that he will find the seller a replacement property within
the 45 days. The seller may nominate no more than three potential properties
to acquire and then actually acquire one of them in the time limit specified,
otherwise the capital gain realized on the sale of the original property is
recognized and taxable.
Only the naive will fail to see the opportunity for mischief here. This may
be generally classified as ‘‘Starker risk,’’ a kind of transaction risk that will be
discussed below and is completely avoided by sophisticated exchangors.
Assuming that the broker is diligent and does actually locate three
properties, a series of practical difficulties arise. The pool of potential
acquisitions is limited to those that are available between the time of closing
and 45 days thereafter. Once selected, the three properties must represent the
best of all possibilities. The seller—now buyer—can only make an offer on
one property at a time. While the other party is contemplating such an offer,
owners of the other two properties find buyers. The pool of potential
acquisitions shrinks to one. Is this not every seller’s dream, to have a buyer
whose only permissible acquisition is his property? Is there not a perverse
incentive for the broker to delay a serious search for the target acquisition
until the 44
th
day?
Time is running throughout all of this. The passing days are a gun to the
exchangor’s head held there by the tax man.
Starker risk may be divided into three categories:
1. The misplaced motivation to purchase, based on expiring tax benefits,
that leads to an unwise acquisition.
The Tax Deferred Exchange 181
File: {Elsevier}Brown/Revises-II/3d/Brown-ch007.3d
Creator: iruchan/cipl-un1-3b2-1.unit1.cepha.net Date/Time: 23.12.2004/4:07pm Page: 182/188
2. An adverse finding during the due diligence process that either
eliminates the only permissible acquisition or, in a variation of #1
above, requires the exchangor to acquire a substandard property.
3. A host of technical malfunctions such as the death or incapacity of the
seller, lender inability to fund the loan, or other procedural matter that
delays the closing beyond the maximum permitted time allowed.
What alternatives exist for the careful investor? One is to select and qualify
the target property well before the closing of the sale of his property, allowing
him to recover from a malfunction. Better yet, is to require the other parties to
participate in an old-fashioned simultaneous exchange. This is anathema to
the modern broker raised to repeat the mantra, ‘‘Don’t worry, we will find
something in 45 days’’ and may reduce the pool of target acquisitions as
brokers avoid an investor with difficult, albeit rational, objectives. Congress
may have allowed the conduct of a deferred exchange, but they did not outlaw
the conduct of the alternative. The best brokers are ones who know this and
are willing to conduct a simultaneous exchange in the client’s best interest.
A set of simple rules appear here. Do not enter into a contract to transfer
your property unless the terms of the transaction are so beneficial that you
can afford to pay the taxes on the sale. If this is not possible and a proposed
sale is only justified if an exchange is involved, require that such an exchange
be simultaneous. Failing to observe these rules implicitly leaves the investor
open to violating the important advice to never make business decisions based
on tax motives.
EXAMPLE 3—EXCHANGING AND
THE PLODDER
To this point we have focused on the way a tax deferral strategy affects the
entrepreneurial type who adds labor to his investment to improve its value
rapidly in the early years of ownership. There are other, perhaps more
numerous, real estate investors who are ‘‘buy-and-hold’’ types. They rely on
neighborhood or regional growth over time to increase the value of their
investments, perhaps offsetting inflation better than financial assets would
over the same period of time. To illustrate this type of investor, we will return
to the inputs from the base case in Table 7-1 for the first half of Example 3.
Table 7-22 provides a new set of exchange inputs to perform the basis
carryover calculations. We will continue for the moment with our convention
of using the capitalization rate for the property sold of 9.71% to value the
property acquired. In Table 7-23 we show the exchange of basis values for a
new acquisition.
182 Private Real Estate Investment
File: {Elsevier}Brown/Revises-II/3d/Brown-ch007.3d
Creator: iruchan/cipl-un1-3b2-1.unit1.cepha.net Date/Time: 23.12.2004/4:07pm Page: 183/188
The computation leading to the acquisition of the new property will, as
before, depend on the sale of the first property and will assume that all
proceeds are reinvested, new loans are at least as much in nominal amount as
old loans, and the exchange is fully tax deferred. Comparing the two
properties in Table 7-24, note the size of each building expressed in number
of units. Final year operating and sale results are modestly profitable,
producing an NPV of $14,918 and an IRR of 13.57%.
It is useful to note that in this stylized example the primary motivation for
the exchange is to return to the original leverage. Since all other inputs are
constant, one ‘‘buys’’ the extra increment of the larger property with the
increased equity from the smaller property, employing the same ltv as used for
the first acquisition. Due to sales costs, this is an expensive approach. To
accomplish the same objective one could refinance the original property back
to its original debt ratio and use the net refinance proceeds to purchase
TABLE 7-22 Data for Base Case Exchange of Tax Basis
Potential gain $317,674 new equity $530,607
original cost $1,235,000 boot paid 0
accumulated depreciation $188,618 total boot 0
sale costs $110,599 building depreciation rate
1
⁄
27.5
old loan $833,449 new land percent of property 0.03
new value $1,820,277
TABLE 7-23 Carryover Basis for Property Acquired with Base
Case Property
New loan $1,289,670
Mortgage relief 0
Net mortgage relief 0
Equity acquired $530,607
Value acquired $1,820,277
Indicated gain $317,674
Recognized gain 0
New adjusted cost basis $1,502,603
New land allocation $450,781
New building allocation $1,051,822
New annual depreciation $38,248
The Tax Deferred Exchange
183