báo cáo hóa học: " Evaluation of 18F-nifene binding to a4b2 nicotinic receptors in the rat brain using microPET imaging" ppt
Bạn đang xem bản rút gọn của tài liệu. Xem và tải ngay bản đầy đủ của tài liệu tại đây (717.83 KB, 9 trang )
ORIGINAL RESEARCH Open Access
Evaluation of
18
F-nifene binding to a4b2 nicotinic
receptors in the rat brain using microPET imaging
Ritu Kant, Cristian C Constantinescu, Puja Parekh, Suresh K Pandey, Min-Liang Pan, Balu Easwaramoorthy and
Jogeshwar Mukherjee
*
Abstract
MicroPET imaging studies using
18
F-nifene, a new positron emission tomography (PET) radiotracer for nicotinic
acetylcholinergic receptors (nAChR) a4b2 receptors in rats, have been carried out. Rats were imaged for 90 min
after in travenous injection of
18
F-nifene (0.8 to 1 mCi), and binding potential (BP
ND
) was measured.
18
F-Nifene
binding to thalamic and extrathalamic brain regions was consistent with the a4b2 nAChR distribution in the rat
brain. Using the cerebellum as a reference, the values for the thalamus varied less than 5% (BP
ND
= 1.30, n = 3),
confirming reproducibility of
18
F-nifene binding.
18
F-Nifene microPET imaging was also used to evaluate effects of
nicotine in a group of Sprague-Dawley rats under isoflurane anesthesia. Nicotine challenge postadministration of
18
F-nifene demonstrated reversibility of
18
F-nifene binding in vivo. For a4b2 nAChR receptor occupancy
(nAChR
OCC
), various doses of nicotine (0, 0.02, 0.1, 0.25, and 0.50 mg/kg nicotine free base) 15 min prior to
18
F-
nifene were administered. Low-dose nicotine (0.02 mg) reached > 80% nAChR
OCC
while at higher doses (0.25 mg)
> 90% nAChR
OCC
was measured. The small amount of
18
F-nifene binding with reference to the cerebellum affects
an accurate evaluation of nAChR
OCC
. Effort s are underway to identify alte rnate reference regions for
18
F-nifene
microPET studies in rodents.
Background
Nicotinic a4b2 receptors play an important role in
many CNS disorders such as Alzheimer’sdisease,Par-
kinson’ s disease, Schizophrenia, mood disorders, and
nicotine dependence. Much work is being done on
radiotracer compounds with high binding affinity as well
as faster kinetics which can be used as an aid to visua-
lize the nicotinic receptors and their involvement in
neurological disorders [1]. Both 5-
123
I-iodo-A-85380 and
2-
18
F-fluoro-A-85380 have a high a ffinity for the a4b2
receptors with scan times exceeding several hours. In
order to reduce the scan time, emphasis was placed on
developing a tracer with faster kinetics. We have devel-
oped
18
F-nifene (2-
18
F-fluoro-3-[2-((S)-3-pyrrolinyl)
methoxy]pyridine; Figure 1), a nicotinic a4b2 receptor
agonist which is suitable for positron emission tomogra-
phy (PET ) imaging (K
i
= 0.50 nM; [2,3]). Imaging times
in nonhuman primates with
18
F-nifene [2] were reduced
significantly compared to
18
F-flouroA-85380 [4].
Nicotine has a high affinity for a4b2 nicotinic acetyl-
cholinergic receptors (nAChR ) receptors (K
i
=1.68nM,
[3]). Cigarette smoking and nicotine (a major compo-
nent of tobacco) have been shown to have a direct and
significant occupancy of a4b2 nAChR receptors [5-7].
Studies have a lso shown an increase in a4b2 receptor
density binding sites in rat and mice brains upon expo-
sure to nicotine [8-10]. Chronic tobacco smoking
increases the number of high affinity nAChRs in various
brain areas [11]. Human postmortem data have shown
the presence of a4b2 nAChR receptors in the subicu-
lum, which are upregulated in smokers [10]. Human
imaging studies, using SPECT imaging agent 5-
123
I-
iodo-A-85380 and PET imaging agent 2-
18
F-fluoro-A-
85380, have also identified an increase in receptor den-
sity among smokers versus nonsmokers, suggesting 2-
18
F-fluoro-A-85380 to be a reliable PET me thod for
further tobacco studies [12,13]. As reported recently,
nicotine from typical cigarette smoking by daily smokers
is likely to occupy a majority of a4b2 receptors and
lend them to a desensitized state [5]. Thus, noninvasive
imaging is playing a major role in understanding nico-
tine dependency [14,15].
* Correspondence:
Preclinical Imaging Center, Department of Psychiatry and Human Behavior,
University of California-Irvine, Irvine, CA 92697, USA
Kant et al. EJNMMI Research 2011, 1:6
/>© 2011 Kant et al; licensee Springer. This is an Open Acces s article distributed under the terms of the Creative Commons Attribution
License ( /by/2.0), which permits unrestricted use, distribution, and reproduction in any medium,
provided the original work is properly cite d.
The focus in this work is on in vivo evaluation of
18
F-
nifene binding to a4b2 nicotinic receptors in rodent
brain regions using microPET. In an effort to establish
18
F-nifene microPET studies in the rat model, our objec-
tives were the following: (1) evaluate in vivo
18
F-nifene
in the normal rat model using microPET and confirm
by ex vivo micro PET and autoradiography, (2) carry out
test-retest microPET studies in the rat model in order
to evaluate reproducibility of
18
F-nifene microPET bind-
ing, and (3) measure changes in
18
F-nifene binding in
the rat model using microPET at different doses of nico-
tine. These findi ngs will assist in our eventual goal to
evaluate the role of a4b2 nAChR in nicotine depen-
dency using the rodent model.
Methods
General methods
All chemicals and solvents were purchased from Aldrich
Chemical (Aldrich Chemical Company, Wilwaukee, WI,
USA) and Fisher Scientific (Fisher Scientific UK Ltd., Lei-
cestershire, UK). Deionized water was acquired from
Millipore Milli-Q Water Purification System (Millipore,
Billerica, MA, USA). Gilson high-performance liquid
chromatography (HPLC) was used for the semiprepara-
tive reverse phase column chromatography. Fluorine-18
fluoride was produced via MC-17 cyclotron using oxy-
gen-18-enriched water. Radioactivity was counted using a
Capintec dose calibrator while low level counting was
done using a well counter. Inveon preclinical Dedicated
PET (Siemen’s Inc., Munich, Germany ) was used for the
microPET studies which has a resolution of 1.45 mm
[16]. Both in vivo and ex vivo images of the rat brains
were obtained using the Inveon microPET scanner and
were analyzed using the Acquisition Sinogram Image
Processing (ASIPRO, Siemens Medical Sol utions USA,
Inc., Knoxville, TN, U SA) and Pixelwise Modeling Soft-
ware (PMOD Technologies, Zurich, Switzerland). Slices
of the rat brain were prepared at 10 to 40-μm thick using
the Leica 1850 cryotome (Leica Instruments, Nussloc h,
Germany). In vitro-orex vivo-labeled brain sections were
exposed to phosphor films (Perkin Elmer Multisensitive,
Medium MS) and were read using the Cyclone Phosphor
Imaging System (Packard Instruments, Meriden, CT,
USA). An analysis of in vitro or ex vivo autoradiographs
was done using the Optiquant Acquisition and Analysis
software (Packard Instruments, Meriden, CT, USA). All
animal studies have been approved by the Institutional
Animal Health Care and Use Committee of the Univer-
sity of California, Irvine.
Radiolabeling
A synthesis of
18
F-nifene was carried out following
reported procedures (Pichika et al. 2006). The auto-
mated radiosynthesis of
18
F-nifene was carried out in
the chemistry processing control unit box. An Alltech
C
18
column (10 μm, 250 × 10 mm
2
)wasusedfor
reverse phase HPLC purification and specific activity of
18
F-nifene was approximately 2,000 Ci/mmol.
MicroPET
18
F-nifene studies
Male Sprague-Dawley rats were fasted 24 h prior to the
time of scan. On the day of the study, rats were anesthe-
tized using 4.0% isoflurane. The rat was then positioned
on the scanner bed by placing it on a warm water circu-
lating heating pad, and anesthesia was applied using a
nose cone. A transmission scan was subsequently
acquired. The preparation of the dose injection was as
follows: 0.7-1.0 mCi of
18
F-nifene was drawn into a 1-
mL syringe with a 25-gauge needle and was diluted with
sterilesalinetoafinalvolumeof0.3mL.Thedosewas
injected intravenously into the tail vein of the rat. Iso-
flurane was reduced and maintained at 2.5% following
the injection. The scans were carried out for 90 min
and were acquired by the Inveon microPET in full list
mode. The list mode data were collected dynamically
which were rebinned using a Fourier rebinning algo-
rithm. The images were reconstructed using a two-
dimensional Filter Bac k Projec tion using a Hanning Fil-
ter with a Nyquist cutoff at 0.5, and were corrected for
attenuation using the Co-57 attenuation scan data. A
calibration was conducted to Becquerel per cubic centi-
meter unit s using a germanium-68 phantom which was
scanned in the Inveon microPET and was reconstructed
under the same parameters as the subjects. Analyses of
all data were carried out using the Acquisition Sinogram
Image Processing IDL’s virtual machine (ASIPRO VM)
and Pixelwise Modeling software (PMOD 3.0). The test
and retest microPET studies on the same animal were
carried out within an interval of approximately 2 weeks.
Metabolite analysis
Blood was collected at four different time points (5, 15,
60, and 90 min) after the injection of
18
F-nifene. The
blood was centrifuged for 5 min at 3,000 g. The plasma
was separated a nd counted. Acetonitrile was added to
the blood sampl es, an d the organic layer was spotted on
the analytical thin layer chromatography (TLC) plates
N
O
18
F
N
H
Figure 1 Chemical structure of
18
F-nifene.
Kant et al. EJNMMI Research 2011, 1:6
/>Page 2 of 9
(silica-coated plates, Baker-Flex, Phil lipsburg, NJ, USA)
and was developed in 15% methanol in dichloro-
methane. A sample of the plasma was also collected
prior t o the injection of
18
F-nifene and was spiked with
the tracer and was used as a standard.
Male Sprague-Dawley rats were injected intrav enously
(IV) with 0.5 mCi of
18
F-nifene in a total volume of 0.3
mL and were sacrificed 40 min after injection. The
brain was extracted and dissected into two hemispheres.
The sagittal sections of 40-μm thickness w ere obtained
from the left hemisphere using the Leica 1850 cryotome
and were exposed to phosphor films overnight. The
films were read using the Cyclone Phosphor Imaging
System and were analyzed using the Optiquant software.
The right he misphere was homogenized with 1.15% KCl
(2 mL), and this homogenized mixture was vortexed
with 2% acetic acid in me thanol (2 mL). This mixture
was centrifuged for 10 min at 10,000 g, and the super-
natant was removed for analysis. RadioTLC (9:1,
dichloromethane and methanol) was obtained for both
18
F-nifene standard and the brain extract.
Ex vivo microPET
In order to ascertain the brain uptake of
18
F-nifene, after
completion of the in vivo microPET scans, the rats were
sacrific ed and the brain was extracted for ex vivo micro-
PET imaging. The whole brain was placed in a hexago-
nal polystyrene weighing boat (top edge side length, 4.5
cm; bottom edge side length, 3 cm) and was covered
with powdered dry ice. This boat was placed securely on
the scanner bed, and a transmission scan was acquired.
Subsequently, a 60-min emission scan was acquired by
the Inveon microPET scanner in full list mode. The list
mode was collected in a single frame, and a reconstruc-
tion of the images was similar to the procedure
described previously in the section “ MicroPET
18
F-
nifene studies.” Theimageswereanalyzedusingthe
ASIPRO VM and PMOD 3.0 software.
Ex vivo autoradiography
The brain after the ex vivo microPET acquisition in the
section “Ex vivo microPET” was remov ed from the dry
ice and was rapidly prepared for sectioning. Horizontal
sections (40-μmthick)containingbrainregionsofthe
thalamus, subiculum, cortex, striatum, hippocampus, and
cerebellum were cut using the Leica CM1850 cryotome.
The sections were air-dried and exposed to phosphor
films overnight. The films were read using the Cyclone
Phosphor Imaging System. The regions of interest of the
same size were drawn and analyzed on the brain regions
rich in a4b2 nicotinic receptors using the OptiQuant
software, and th e binding of
18
F-nifene was measured in
digital light units per square millimeter.
MicroPET studies of nicotine challenge
Nicotine challenge experiments were of two types. In
order to demo nstrate reversibility of bo und
18
F-nifene
and to measure the off-rate, the postinjection nicotine
effects were first measured. Sprague-Dawley rats were
injected with
18
F-nifene (0.2 to 0.5 mCi, IV) and at
approximately 30 m in postinjection of the
18
F-nifene,
0.3 mg/kg of nicotine free base (administ ered as a ditar-
tarate salt from Sigma Chemical Company, St. Louis,
MO, USA) was administered intravenously. The total
time of scan was 90 min and was acquired in full list
mode, similar to the p rotocol for the control scans
described in “MicroPET
18
F-nifene studies.” Before and
after images were analyzed using the PMOD 3.0 soft-
ware, and a time-activity curve was generated.
The second set of nicotine challenge experiments were
designed to measure a4b2 nAChR receptor occupancy
(nAChR
OCC
) by nicotine. Male Sprague-Dawley rats
were preinjected intravenously with nicotine using saline
for baseline, and four d ifferent doses of nicotine (0.02,
0.1, 0.25, and 0.5 mg/kg free base, administered as a
ditartarate salt) were diluted in a total volume of 0.3 mL
sterile salin e. Nicotine was inject ed 15 min prior to
intravenous injection of
18
F-nifene (0.8-1.0 mCi). Once
anesthetized, the rats were scanned for 90 min using the
Inveon microPET scanner in full list mode. Dynamic
data were reconstructed and analyzed as described in
the section “MicroPET
18
F-nifene studies.” Time-activity
curves w ere measured and analyzed using the ASIPRO
VM and PMOD 3.0 software. Perce nt occupancy was
calculated from: (Thal
cont
-Thal
nic
/Thal
cont
]) × 100,
where Thal
cont
is the percent injected dose of
18
F-nifene
in the brain regions of the control study, and Thal
nic
is
the percent injected dose of
18
F-nifene in the brain
regions of the nicotine study at 60 min postinjection of
18
F-nifene.
Results
MicroPET
18
F-nifene binding studies
Arapiduptakeof
18
F-nifene was observed in the brain
with levels of approximately 1% of injected dose per
cubic centimeter. Thalamic regions exhibited the highest
retention as it has a m aximum amount of a4b2 recep-
tors. Significant levels of uptake were observed in the
various regions of the cortex while very little bind ing is
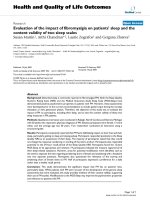
present in th e cerebellum (Figure 2A,B,C). Time-activity
curves of the thalamus, frontal cortex, and cerebellum
in Figure 2D show initial rapid uptake in various brain
regions followed by greater retention in the thalamus
and cortex compared to the cerebellum. A ratio of the
uptake for the thalamus and frontal cortex against the
reference region cerebellum reached a plateau at
approximately 60 min postinjection. The thalamus to
Kant et al. EJNMMI Research 2011, 1:6
/>Page 3 of 9
cerebellum ratio was a pproximate ly 3.5 and the cortex
to cerebellum ratio was 2.3.
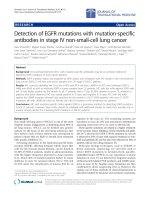
Metabolite analysis
Following the injection of
18
F-nifene, blood was col-
lected at different time points to measure metabolites in
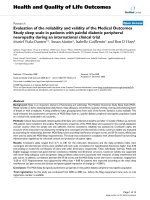
the blood plasma. Figure 3A shows a decrease in the
amount of parent as well as metabolites found in the
blood plasma during th e 90 m in.
18
F-Nifene standard
was used to compare the tracer found in the blood
plasma. Figure 3B represents about 42% of
18
F-nifene
remaining in the blood plasma at 90 min (compared to
that measured at 5 min pi) while the levels o f metabo-
lites were significantly reduced in the blood plasma at
90 min.
Radiochromatograms were attained from running
brain extracts and were compared to the peak to the
parent compound providing ev idence that the primary
species within the brain of the rat was
18
F-nifene. After
sacrificing the rat, the brain was excised and dissected
into the left and right hemispheres. Figure 3C,D shows
the sagittal brain slices of the left hemisphere represent-
ing the total binding of
18
F-nifene reveali ng maximal
binding in the thalamus followed by extrathalamic
regions such as the cortex and subiculum. The cerebel-
lum had the least amount of activity. A thin lay er chr o-
matographic analysis of the extract of the homogenized
right hemisphere shown in Figure 3F closely correlates
with the retention of
18
F-nifene standard (Figure 3D).
No other significant metabolite peak was observed in
the brain extract.
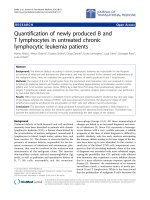
Test-retest
Test and retest studies were investigated in a group of
rats (Figure 2). Binding of
18
F-nifene in each region of
the brain remained consistent among the studies. Figure
2 represents the time-activity curves for a test-retest
study in one animal. The curve seen for the retest study
follows the same pattern as the test study. By 60 min
into the scan, nonspecific binding is seen to be cleared
A
B
C
D
0
100
200
0306090
Time (min)
18F-Nifene [kBq/cc]
Thalamus [Test]
Thalamus [Retest]
Cerebellum [Test]
Cerebellum [Retest]
Figure 2 In vivo microPET rat brain test-retest study. (A) Horizontal, (B) sagittal, (C) coronal of
18
F-nifene. The thalamus (TH) shows the
highest binding followed by the cortex (COR) and the cerebellum (CB). Test-retest study showing consistency in binding of
18
F-nifene to the
thalamus with respect to the cerebellum. BP
ND
for the test study was 1.69 while the retest study was 1.64.
Kant et al. EJNMMI Research 2011, 1:6
/>Page 4 of 9
out in both studies and remains at stable levels. The
bindi ng potentials for the three rats were calculated and
were found to v ary between 1.03 and 1.69, but within
subject, the test-retest error was approximat ely 3%
(Table 1).
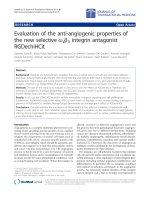
Ex vivo studies
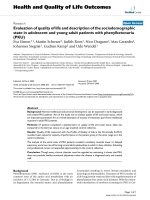
Ex vivo microPET imaging o f the excised brain after 90
min of in vivo scans was carried out for another 60 min.
Results c learly show binding of
18
F-nifene in the thala-
mus, cortical regions with little binding in the cerebel-
lum (Figure 4A,B,C). This is consistent with the in vivo
images shown in Figure 2A,B,C.
Ex vivo autoradiographs revealed a significant amount
of det ail that was not readily apparent in the m icroPET
images. The thalamus exhibitedthehighestamountof
18
F-nifene binding. The subiculum had a higher amount
A
B
18
F-Nifene
Standard
Brain
Hemisphere
Homogenate
Extract
E
F
C
D
THTH
COR
COR
CB
CB
Figure 3 Blood and brain metabolite analysis in rats postadministration of intravenous
18
F-nifene. (A) Blood plasma collected at different
time points (5, 15, 60, and 90 min) and compared to
18
F-nifene standard on TLC. A polar metabolite is seen, but the predominant radioactive
species is
18
F-nifene. (B) Analysis of TLC in (A) indicates 42% of
18
F-nifene (blue) remaining at 90 min with little polar metabolites (red) remaining
in the plasma. (C) Ex vivo rat brain was dissected into two hemispheres–the left hemisphere was cut into 40-μm thick sagittal brain sections and
were scanned to reveal brain areas. (D) Binding of
18
F-nifene in the thalamus (TH), cortex (COR), and least binding in the cerebellum (CB) was
observed. (E) RadioTLC of
18
F-nifene standard with 9:1 CH
2
Cl
2
:CH
3
OH. (F) RadioTLC of brain extracts with 9:1 CH
2
Cl
2
:CH
3
OH showing the
presence of
18
F-nifene.
Table 1 Test-retest
18
F-nifene binding potential in
thalamus
Test Retest Mean %Error
Rat 1 1.69 1.64 1.67 3.0%
Rat 2 1.17 1.21 1.19 3.4%
Rat 3 1.06 1.03 1.05 2.9%
Error estimates are given as [(Scan1-Scan2)/(Scan1 + Scan2)/2] × 100
Kant et al. EJNMMI Research 2011, 1:6
/>Page 5 of 9
of binding in the autoradiographs not readily measure-
able in the microPET data. The cortex had a significant
amount of binding consist ent to that observed in the
microPET imaging data. The cerebellum had the lowest
amount of
18
F-nifene binding in the ex vivo autoradio-
graphs. Autoradiographic ratios with respect to the cere-
bellum in the v arious brain regions were: thalamus =
4.60, subiculum = 2.39, cortex = 1.83, striatum = 1.46.
These ratios are in close agreement to the ratios mea-
sures by microPET ex vivo (Table 2).
MicroPET studies of nicotine challenges
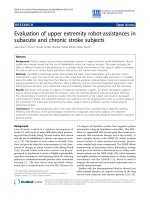
In the first set of e xperiments with nicotine,
18
F-nifene
bound in the thalamus (Figure 5A) was displaced by IV
administratio n of 0.3 mg/kg of nicotine (Figure 5B). The
time-activit y curve for this competition of nicotine with
18
F-nifene in the thalamus is shown in Figure 5C w hich
shows t he displacement of most of the
18
F-nifene from
the thalamus. Nicotine had little effect in the cerebel-
lum. The n icotine-induced in vivo off-rate measur ed for
18
F-nifene was 0.06 min
-1
(Figure 5D).
Occupancy of a4b2nAChR
OCC
by nicotine was mea-
sured by dose escalation competition experiments of
nicotine with
18
F-nifene. A change in thalamus binding
at baseline was measured at different nicotine doses of
injected nicotine. The displacement of
18
F-nifene was
found with the pre-nicotine challenges. With each dose
increase of nicotine, a steady increase in binding occu-
pancy was found. The results are summarized in
Table 3. Eighty percent binding o ccupancy was seen
with just 0.02 mg/kg of nicotine while 94% binding
occupancy was found with 0.5 mg/kg. Figure 6 presents
a ste ady decrease of
18
F-nifene with the competition of
nicotine at different doses.
Discussion
Our prima ry goal was to evaluate
18
F-nifene binding to
the a4b2 receptors in thalamic and extrathalamic brain
regions of rodents using microPET imaging.
18
F-Nifene,
an agonist , was developed with fast binding kinetics and
a shorter scan time in order to image the a4b2 nicotinic
receptors. This is useful in the assessment of nicotinic
receptors in neurological diseases. MicroPET studies in
rats validated the faster binding profile of
18
F-nifene
thus providing shorter scan times. Maximum binding
was found in the thalamus, while moderate binding is
seen in the cortex, and minimal binding in the cerebel-
lum. Time-activity curves f or the thalamus, cortex, and
cerebellum show that
18
F-nifene peaks early into the
scan, and nonspecific binding in the cerebellum cleared
rapidly. Thalamus to cerebellum rat ios were > 3.0 and
cortex to cerebellum were a pproximately 2. Thus,
18
F-
nifene allows shorter duration PET studies for quantita-
tive measures of a4b2 receptors compared to 2-
18
F-FA-
85380 which has been shown to require 5 h to reach
steady state in rodents [17].
No lipophilic metabolites of
18
F-nifene were detected
in plasma extracts, and a significant a mount of
18
F-
nifene parent remai ned in the blood after 90 min of the
PET study. The absence of lipophilic metabolites was
also confi rmed using brain extracts of rats injected with
18
F-nifene . Only
18
F-nifene was detected in the brain
extracts.
The binding of
18
F-nifene to a4b2 receptors of the
rodent brain in microPET studies gave results consistent
BA
TH
COR
CB
STR
STR
SUB
CB
TH
COR
ED
STR
TH
COR
CB
SUB
C
Figure 4 Ex vivo microPET and autoradiographic brain images
of a rat. MicroPET images ((A) horizontal, (B) coronal, and (C)
sagittal) validate maximum binding in the thalamus (TH) followed
by the cortical regions (COR). An autoradiograph of the brain in (A)
showing 10-μm horizontal sections (D) and an anatomical view (E)
of the slice in (D).
18
F-nifene binding followed the order TH >
subiculum (SUB) > cortex (COR) > striatum (STR) > cerebellum (CE).
Table 2 Measured
18
F-nifene ratios of rat brain regions
with reference to the cerebellum
Brain
regions
In vivo
microPET
a
Ex vivo
microPET
b
Ex vivo
autoradiographs
c
Thalamus 3.13 ± 0.29 3.92 ± 0.49 4.60 ± 0.52
Subiculum - 2.28 ± 0.24 2.39 ± 0.15
Cortex 1.98 ± 0.10 2.05 ± 0.17 1.83 ± 0.19
Striatum 1.52 ± 0.39 1.77 ± 0.28 1.46 ± 0.07
Average of four animal s with standard deviations;
a
Ratio measured at 85-90
min postinjection of
18
F-nifene;
b
Ratio measured in the 60-min summed ex
vivo scan of the same rats;
c
Ratios measured in sections after the ex vivo scans
of the same rats.
Kant et al. EJNMMI Research 2011, 1:6
/>Page 6 of 9
with the rece ptor distri bution and was comparable with
the autoradio graphic slices done in vitro [3]. Test-retest
results of binding potentials, summarized in Table 1,
remained consistent between scans thus confirming
reproducibility of
18
F-nifene with <5% standard devia-
tion, suggesting
18
F-nifene to be suitable for PET
studies. Ex vivo images, both microPET and autoradio-
graphic, confirmed binding of
18
F-nifene to thalamic
and extrathalamic regi ons seen in the in vivo microPET
study.
Nicotine, because of its high affinity to a4b2 recep-
tors, exhibited competition with
18
F-nifene. Previous in
vitro studies using 10 nM of nicotine displaced 60-65%
in the thalamus region and 300 μM of nicotine, 95%
elimination is seen in the thalamus [2]. As expected, dis-
placement of
18
F-nifene binding was seen in the post-
nicotine challenge similar to that reported for 2-[
18
F]F-
A-85380 [17]. Figure 6 clearly shows a drop in binding
at the time of nicotine injection (30 min into the scan),
displacing at least > 80% of
18
F-nifene binding. The abil-
ity for nicotine to compete with
18
F-nifene can be used
to detect changes in receptor occupancy suggesting PET
to be a valuable tool in assessing tobacco-related depen-
dence [13]. Pre-nicotine challenges at different dose
-20
-10
0
10
20
30
40
50
60
70
80
0 20406080100
Time, min
Thal-Cereb, 18F-Nifene
nicotine
AB
TH
CB
C
Figure 5 In vivo displacement of
18
F-nifene by ni cotin e. In vivo rat microPET brain slices of
18
F-nifene before (A) and after (B) nicotine
challenge. (C) Time-activity curve of
18
F-nifene specific binding (thalamus-cerebellum) with nicotine (0.3 mg/kg) administered at 30 min pi,
displacing
18
F-nifene binding in the thalamus (inset shows dissociation rate, k
off
of
18
F-nifene was 0.06 min
-1
).
Table 3 Nicotine dose effects on
18
F-nifene binding
Nicotine, mg/kg % Injected dose/cc
thalamus
Nicotine
occupancy
0 0.489 0%
0.02 0.092 81%
0.10 0.037 92%
0.25 0.031 94%
0.50 0.005 99%
Average of two measurements for each dose; receptor occupancy was
calculated on the bas is of percent injected dose per cubic centimeter of
18
F-
nifene in the thalamus (Thal
cont
- Thal
nic
/Thal
cont
× 100).
Kant et al. EJNMMI Research 2011, 1:6
/>Page 7 of 9
levels of nicotine, demonstrated a ste ady decrease in
18
F-nifene occupancy with respect to nicotine. At low
doses o f nicotine, 0.02 mg/kg, > 40% of receptors were
occupied while at high doses (0.5 mg/kg) > 80% recep-
tors were occupied with nicotine (Table 3). While the
cerebellum was used as a reference region, some issues
have risen questioning the validity of the cerebellum as
a reference region. With the presence of nicotinic recep-
tors in the rat cerebellum [17-19], measurement of bind-
ing potential can be complex. Studies using 2-[
18
F]F-A-
85380 in rodents have reported nicotine displaceable
component in the cerebellum [17], suggesting a need for
arterial input function for accurate quantification.
Aside from the cerebellum, efforts have been under-
way to identify other regions of the brain, such as the
corpus callosum and pons as reference regions [20].
Efforts are underway in our rodent
18
F-nifene studies to
identify other referen ce regions in the brain, other than
the cerebellum. Future work in the rodent model will
incorporate arterial blood sampling for more accurate
quantification.
Conclusions
18
F-nifene binds to the a4b2 receptors in thalamic and
extrathalamic regions in rat microPET studies. With its
faster binding kinetics, short scan time, and reversible
binding,
18
F-nifene is an agonist radiotracer with potential
for studying this receptor system in various rodent models.
Acknowledgements
This research was supported by the National Institutes of Health (NIH), U.S.
Department of Health and Human Services, grant no. R01AG029479. We
would like to thank Robert Coleman for the technical assistance.
Authors’ contributions
MicroPET imaging studies, autoradiographic studies and analysis were
carried out by RK and PP, synthesis and metabolite analysis were carried out
by SKP and MLP, brain metabolism studies were carried out by BE and JM,
microPET data analysis was carried out by CC. The study and all data
acquired was coordinated and reviewed by JM. All authors read and
approved the final manuscript.
Competing interests
The authors declare that they have no competing interests.
Received: 17 March 2011 Accepted: 20 June 2011
Published: 20 June 2011
References
1. Horti AG, Gao Y, Kuwabara H, Dannals RF: Development of radioligands
with optimized imaging properties for quantification of nicotinic
acetylcholine receptors by positron emission tomography. Life Sci 2010,
86:575-584.
2. Pichika R, Easwaramoorthy B, Collins D, Christian BT, Shi B, Narayanan TK,
Potkin SG, Mukherjee J: Nicotinic α4β2 receptor imaging agents. Part II.
Synthesis and biological evaluation of 2-[
18
F]fluoro-3-[2-((S)-3-pyrrolinyl)
methoxy]pyridine (
18
F-nifene) in rodents and imaging by PET in
nonhuman primate. Nucl Med Biol 2006, 33:294-304.
3. Easwaramoorthy B, Pichika R, Collins D, Potkin SG, Leslie FM, Mukherjee J:
Effect of acetylcholinesterase inhibitors on the binding of nicotinic α4β2
receptor PET radiotracer,
18
F-nifene: a measure of acetylcholine
competition. Synapse 2007, 61:29-36.
4. Chefer SI, London ED, Koren AO, Pavlova OA, Kurian V, Kimes AS, Horti AG,
Mukhin AG: Graphical analysis of 2-[18F]FA binding to nicotinic
acetylcholine receptors in rhesus monkey brain. Synapse 2003, 48:25-34.
5. Brody AL, Mandelkern MA, London ED, Olmstead RE, Farahi J, Scheibal D,
Jou J, Allen V, Tiongson E, Chefer SI, Koren AO, Mukhin AG: Cigarette
smoking saturates brain α4β2 nicotinic acetylcholine receptors. Arch Gen
Psychiatry 2006, 63:907-915.
6. Ding YS, Volkow ND, Logan J, Garza V, Pappas N, King P, Fowler JS:
Occupancy of brain nicotinic acetylcholine receptors by nicotine doses
equivalent to those obtained when smoking a cigarette. Synapse 2000,
35:234-237.
7. Valette H, Bottlaender M, Dolle F, Coulon C, Ottaviani M, Syrota A: Long-
lasting occupancy of central nicotinic acetylcholine receptors after
smoking: a PET study in monkeys. J Neurochem 2003, 84:105-111.
8. Schwartz RD, Kellar KJ: Nicotinic cholinergic receptor binding sites in
brain: regulation in vivo. Science 1983, 220:214-216.
Figure 6 Dose effects of nicotine on thalamus time-activity curves. Time-activity curves of
18
F-nifene uptake in the thalamus of rats injected
with different doses of nicotine.
Kant et al. EJNMMI Research 2011, 1:6
/>Page 8 of 9
9. Marks MJ, Burch JB, Collins AC: Effects of chronic nicotine infusion on
tolerance development and nicotine receptors. J Pharmacol Exp Ther
1983, 226:817-825.
10. Perry DC, Davila-Garcia MI, Stockmeier CA, Kellar KJ: Increased nicotinic
receptor in brains from smokers: membrane binding and
autoradiographic studies. J Pharmacol Exp Ther 1999, 289:1545-1552.
11. Stolerman IP, Jarvis MJ: The scientific case that nicotine is addictive.
Psychopharmacology 1995, 117:2-10.
12. Staley JK, Krishnan-Sarin S, Cosgrove KP, Krantzler E, Frohlich E, Perry E,
Dubin JA, Estok K, Brenner E, Baldwin R, Tamagnan GD, Seibyl JP, Jatlow P,
Picciotto MR, London ED, O’Malley S, van Dyck CH: Human tobacco
smokers in early abstinence have higher levels of beta2* nicotinic
acetylcholine receptors than nonsmokers. J Neurosci 2006, 26:8707-8714.
13. Mukhin AG, Kimes AS, Chefer SI, Matochik JA, Contoreggi CS, Horti AG,
Vaupel DB, Pavlova O, Stein EA: Greater nicotinic acetylcholine receptor
density in smokers than in nonsmokers: a PET study with 2-18F-FA-
85380. J Nucl Med 2008, 49:1628-1635.
14. Sharma A, Brody AL: In vivo brain imaging of human exposure to
nicotine and tobacco. Handb Exp Pharmacol 2009, 192:145-171.
15. McClernon FJ: Neuroimaging of nicotine dependence: key findings and
application to the study of smoking-mental illness comorbidity. J Dual
Diagn 2009, 5:168-178.
16. Constantinescu C, Mukherjee J: Performance evaluation of an Inveon PET
preclinical scanner. Phys Med Biol 2009, 54:2885-2899.
17. Vaupel DB, Stein EA, Mukhin AG: Quantification of α4β2 nicotinic
receptors in the rat brain with microPET and 2-[
18
F]F-A-85380.
Neuroimage 2007, 34:1352-1362.
18. Clarke PBS, Schwartz RD, Paul SM, Pert CB, Pert A: Nicotinic binding in rat
brain: autoradiographic comparison of [
3
H]acetylcholine, [
3
H]nicotine,
and [
125
-I]-α-bungarotoxin. J Neuroscience 1985, 5:1307-1315.
19. Flores CM, Rogers SW, Pabreza LA, Wolfe BB, Kellar KJ: A subtype of
nicotinic cholinergic receptor in rat brain in composed of α4 and β2
subunits and is up-regulated by chronic nicotine treatment. J
Pharmacology Exp Ther 1992, 41:31-37.
20. Le Foll B, Chefer SI, Kimes AS, Shumway D, Goldberg SR, Stein EA,
Mukhin AG: Validation of an extracerebral reference region approach for
the quantification of brain nicotinic acetylcholine receptors in squirrel
monkeys with PET and 2-18F-fluoro-A-85380. J Nucl Med 2007,
48:1492-1500.
doi:10.1186/2191-219X-1-6
Cite this article as: Kant et al.: Evaluation of
18
F-nifene binding to a4b2
nicotinic receptors in the rat brain using microPET imaging. EJNMMI
Research 2011 1:6.
Submit your manuscript to a
journal and benefi t from:
7 Convenient online submission
7 Rigorous peer review
7 Immediate publication on acceptance
7 Open access: articles freely available online
7 High visibility within the fi eld
7 Retaining the copyright to your article
Submit your next manuscript at 7 springeropen.com
Kant et al. EJNMMI Research 2011, 1:6
/>Page 9 of 9