Advances in Gas Turbine Technology Part 8 pot
Bạn đang xem bản rút gọn của tài liệu. Xem và tải ngay bản đầy đủ của tài liệu tại đây (906.66 KB, 30 trang )
Advances in Gas Turbine Technology
200
4.4 Jet reynolds number calculations
The average velocity used to calculate the jet Reynolds number is calculated using the
following equation
avg
2
V
π
13 d
4
(1)
The data reduction equation for the jet Reynolds number is taken as:
avg
2
ρ Vd
ρ d
Re
π
μμ
13 d
4
(2)
4.5 Uncertainty in jet reynolds number
Taking into consideration only the measured values, which have significant uncertainty, the
jet Reynolds number is a function of orifice jet diameter and volume flow rate and is
expressed mathematically as follows:
Re f( ,d)
(3)
Density and dynamic viscosity of air is not included in the measured variables since it has
negligible error in the computation of the uncertainty in jet Reynolds number. The
uncertainty in Reynolds number has been found to be about 2.2 %.
4.6 Nusselt number calculations
The total power input to all the copper plates was computed using the voltage and current,
the former being measured across the heater, using the following equation:
2
total
V
QVI
R
(4)
The heat flux supplied to each copper plate was calculated using:
"
total
total
Q
q
A
(5)
The heater gives the constant heat flux for each copper plate. The heat supplied to each
copper plate from the heater is calculated using the following procedure:
"
cp,i cp,i
QqA (6)
Where, i is the index number for each copper plate. The heat lost by conduction through the
wood and to the surrounding by radiation is depicted in Figure 5 and has been estimated
using the following equations for each plate.
s,i w
cond,i wood cp,i
(T T )
QkA
t
(7)
Jet Impingement Cooling in Gas Turbines for Improving Thermal Efficiency and Power Density
201
44
rad,i cp,i s,i surr
Q εσA(T T) (8)
The actual heat supplied to each copper plate has been determined by deducting the losses
from the total heat supplied to the heater.
actual,i cp,i cond,i rad,i
QQ(QQ)
(9)
The local convective heat transfer coefficient for each of the copper plate has been calculated
using:
actual, i
i
cp,i s,i in
Q
h
A(T T)
(10)
The average temperature of the heated target surface
,si
T has been taken as the average of
the readings of the two thermocouples fixed in each copper plate. To calculate h,
in
T has
been considered instead of the bulk temperature or the reference temperature. For a given
case (for a given Re, H/d, and orifice-jet plate) T
in
is fixed. It is measured at the test section
inlet, where the air first enters the feed channel. The non-dimensional heat transfer
coefficient on the impingement target surface is represented by Nusselt number as follows:
i
i
air
hd
Nu
k
(11)
The hydraulic diameter has been taken as the diameter of the orifice jet. The data reduction
equation for the Nusselt number is considered along with the heat losses by conduction and
radiation.
2
44
w
s,i w s,i Surr
total
i
air s,i in
k
V
(T T ) εσ(T T )
RA t
d
Nu
k(TT)
(12)
4.7 Uncertainty in nusselt number
Temperature of the wood has a very less effect on the uncertainty of heat transfer coefficient
due to the large thickness of the wood and also due to the insulation material attached to the
wooden block. Temperature of the surroundings and emissivity also has less effect on the
uncertainty as the work was carried out in a controlled environment and the temperature of
the surroundings was maintained within 21-23 C
through out the experiment. The
standard uncertainty in the Nusselt number neglecting the covariance has been calculated
using the following equation:
i s,i
in total
2
22
2
iii
c,Nu V R T
s,i
2
2
2
ii i
TAd
in total
Nu Nu Nu
Uuuu
VRT
Nu Nu Nu
uu u
TA d
(13)
Advances in Gas Turbine Technology
202
Uncertainty propagation for the dependent variable in terms of the measured values has
been calculated using the Engineering equation Solver (EES) software. The measured
variables
12
,xx etc. have a random variability that is referred to as its uncertainty. The
uncertainty in Nusselt number in the present study has been found to vary between ± 6 %
depending upon the jet velocity.
5. Results and discussions
Jet impingement heat transfer is dependent on several flow and geometrical parameters. The
jet impingement Nusselt number is presented in a functional form as follows:
i
i
air
XH
Re, , ,
hd
dd
Nu f
k
outflow orientation
(14)
Where, Re is the flow parameter, jet spacing to the diameter ratio (X/d) is the geometric
parameter. The flow exit direction and target surface geometry are also important
parameters having a considerable impact on impingement heat transfer.
The X location starts from the supply end of the channel as shown in Figure 7. For the case 1
shown in Figure 10a, flow enters at X/d = 109.3 and exits at X/d = 0. For case 2 (Figure 10b),
flow exits at X/d = 109.3. For case 3 (Figure 10c), flow exits at both ends (X/d = 0 and X/d =
109.3). The flow is fully developed before entering the orifice jets. However, in the present
study attention is focused on Case – 3 (out- flow passing out in both directions).
5.1 Effect of orifice-jet-plate configuration on feed channel aspect ratio
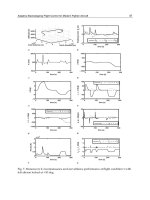
Figures 12-14 show the local Nusselt number distribution for three orifice-jet plate
configurations and for three H/d ratios as a function of non-dimensional location X/d on
the heated target surface (for outflow passing in both directions as shown in Figure 10c, and
for a given Re= 18800).
Figure 12 shows the effect of feed channel aspect ratio (H/d) on local Nusselt number for
Re=18800 for orifice jet plate with centered holes. It can be observed that, H/d=9 gives the
maximum heat transfer over the entire length of the target surface as compared to all feed
channel aspect ratio studied. H/d=9 gives 1% more heat transfer from the target surface as
compared to H/d=5. Whereas H/d=5 gives of 1% increase in heat transfer as compared to
H/d=7.
Figure 13 shows the effect of feed channel aspect ratio (H/d) on local Nusselt number for
Re=18800 for orifice jet plate with staggered jets. It can be observed that, H/d=9 gives the
maximum heat transfer over the entire length of the target surface as compared to all feed
channel aspect ratio studied. H/d=9 gives 1% more heat transfer from the target surface as
compared to H/d=5, whereas H/d=5 gives of 6% increase in heat transfer as compared to
H/d=7.
Figure 14 shows the effect of feed channel aspect ratio (H/d) on local Nusselt number for
Re=18800 for orifice jet plate with tangential holes. It can be observed that, H/d=9 gives the
maximum heat transfer over the entire length of the target surface as compared to other feed
channel aspect ratio studied. H/d=9 gives 3% more heat transfer from the target surface as
compared to H/d=7, whereas H/d=7 gives of 6% increase in heat transfer as compared to
H/d=5.
Jet Impingement Cooling in Gas Turbines for Improving Thermal Efficiency and Power Density
203
Re=18800, Centered holes, Case-3
15
20
25
30
35
40
45
0 20 40 60 80 100 120
X/d
Nu
H/d=5 H/d=7 H/d=9
Fig. 12. Nusselt number variation for different aspect ratios and for outflow passing in both
directions (for jet-orifice plate with centered holes and for Re =18800)
Re=18800 Staggered Case-3
10
15
20
25
30
35
40
0 20 40 60 80 100 120
X/d
Nu
H/d=5 H/d=7 H/d=9
Fig. 13. Nusselt number variation for different aspect ratios and for outflow passing out in
both directions (for jet-orifice plate with staggered holes and for Re =18800)
Advances in Gas Turbine Technology
204
Re=18800 Tangential Case-3
10
15
20
25
30
35
0 20 40 60 80 100 120
X/d
Nu
H/d=5 H/d=7 H/d=9
Fig. 14. Nusselt number variation for different aspect ratios and for outflow passing in both
directions (for jet-orifice plate with tangential holes and for Re =18800)
5.2 Effect of orifice-jet-plate configuration on local nusselt number
Figures 12-14 also show the effect of the orifice jet plate configurations for different feed
channel aspect ratios on local Nusselt number (Nu) along the surface of target surface.
Orifice jet plate with centered holes has been found to give better heat transfer
characteristics as compared to other plates. For H/d=5, Nu increases in percentage from
staggered orifice plate to centered orifice plate by 7% and Nu increases in percentage from
tangential orifice plate to staggered orifice plate by 18%. For H/d=7, Nu increases in
percentage from staggered orifice plate to centered orifice plate by 11% and Nu increases in
percentage from tangential orifice plate to staggered orifice plate by 6%. For H/d=9, Nu
increases in percentage from staggered orifice plate to centered orifice plate by 6% and Nu
increases in percentage from tangential orifice plate to staggered orifice plate by 10%.
For a given situation (H/d=9, Re=18800 and Case-3) the peak value of local Nusselt number
is 36.63 at X/d=49.2 for centered jets. Nu is 34.69 at X/d=66 for staggered jets. Nu is 31.03 at
X/d=49.2 for tangential jets.
Jet Impingement Cooling in Gas Turbines for Improving Thermal Efficiency and Power Density
205
5.3 Effect of orifice-jet-plate configuration and re on averaged nusselt number
The average Nu is the average of Nu of all 13 copper plates on the target surface for a given
situation (i.e. for a given Re, H/d, orifice-jet configuration, outflow orientation).
Figure 15 shows the effect of different orifice jet plate configurations on average Nusselt
number for outflow orientation Case-3 (outflow passing out in both directions), for different
jet Reynolds numbers and for H/d=9. The Nusselt number has been found to increase with
increase in Reynolds number. In general, the percentage increase in average Nusselt number
in going from Plate-3 to Plate-2 is 11% and in going from Plate-2 to Plate-1 is 11%. This
indicates that Plate-1 (centered orifice-jet configuration) gives higher average Nu as
compared to other plates.
H/d=9 Case-3
10
15
20
25
30
35
6000 9000 12000 15000 18000 21000
Re
Nu
avg
Plate-1 Plate-2 Plate-3
Fig. 15. Average Nusselt number distribution for different jet Re and for different orifice-jet
plate configurations (for aspect ratio H/d=9, for outflow passing out in both directions –
Case 3)
Advances in Gas Turbine Technology
206
It is difficult to find out the exact experimental set-up in the literature which has been
developed in the present study for comparison of results, however, attempt has been made
to make some comparison. Figure 16 compares the results of the present study with archival
results of Huang et.al [22] for different jet Re and for different outflow orientations (for a
given jet-orifice plate with centered jets). Huang’s study focused on multiple array jets,
however our study concentrated on single array of centered/staggered/tangential jets (with
an inclined target surface). Florschuetz [4] studied experimentally heat transfer distributions
for jet array impingement. He considered circular jets of air impinging on heat transfer
surface parallel to the jet orifice plate. The air after impingement was constrained in a single
direction. Florschuetz presented Nu for centered and staggered hole patterns.
H/d=9, Case-3
10
20
30
40
50
60
70
80
90
100
2000 5000 8000 11000 14000 17000 20000
Re
Nu
avg
Huang Case-3
Florschuetz
Plate-1
Plate-2
plate-3
Fig. 16. Comparison of Average Nusselt number of present study with other studies for
different jet Re and different orifice-jet plate configurations (for aspect ratio H/d=9, outflow
in both directions – Case 3)
Jet Impingement Cooling in Gas Turbines for Improving Thermal Efficiency and Power Density
207
6. Conclusions
The above experimental work has discussed in appreciable depth the effect of orifice-jet
plate configurations on feed channel aspect ratios (H/d) and on Nusselt number in a
channel with inclined target surface cooled by single array of impinging jets (with outflow
passing out in both radial directions). In general, it has been observed that Nu is high for
higher aspect ratios. For a given plate-1 with single array of equally spaced centered jets
and for Re=18800 (outflow passing in both directions), the local Nu for H/d=9 has been
found to be greater than Nu of H/d=7 by 5%. The average Nu of plate-1 (centered holes)
has been observed to be greater as compared to the Nu of other plate configuration (for a
given Re, H/d, and outflow orientation parallel to inlet flow). The averaged Nusselt
number has been found to increase with in jet Re regardless of orifice-jet plate
configuration. The percentage increase in average Nu has been found to be about 11%
with centered holes as compared staggered orifice-jet plate. The percentage increase in
average Nu has been found to be about 11% with staggered jet-plate as compared to
tangential orifice-jet plate configuration. It can be inferred that from the above results that
invariably (for different combinations impinging jet Re, feed channel aspect ratio, spacing of the
target surface from the jet orifices, orifice-jet plate configuration, outflow orientation, etc)
averaged Nu increases with jet impingement cooling. This implies that jet impingement
cooling is effective. This eventually results in increase in thermal efficiency and power
density of the gas turbines. The observations of the above experimental work offer
valuable information for researchers and designers.
7. Acknowledgment
The present work was supported by Research Institute, King Fahd University of Petroleum
and Minerals, Dhahran, Saudi Arabia. The authors would like to greatly appreciate the
above support. without such support, this work would not have been possible.
8. Nomenclature
A
cp,i
Area of each copper plate [m
2
]
A
total
Area of all copper plate [m
2
]
d Diameter of the orifice jet [m]
h
i
Local convective heat transfer co-efficient [W/m
2
K]
H Width of the feed channel [m]
I Current supplied to heater [Amp]
l Length of the copper plate [m]
k
air
Thermal conductivity of air [W/m.K]
k
wood
Thermal conductivity of wood [W/m.K]
Nu
i
Local Nusselt number for each copper plate
Nu
avg
Average Nusselt number
q'' Heat flux from the heater [W/m
2
]
Q
cp,i
Heat input for each copper plate [W]
Q
actual
Actual heat released from target surface [W]
Q
cond,I
Heat lost due to conduction [W]
Advances in Gas Turbine Technology
208
Q
rad,i
Heat lost due to radiation [W]
Q
total
Total heat input [W]
Re Jet Reynolds number
R Resistance of the heater [ohm]
t Thickness of wood block behind the heater [m]
T
in
Inlet temperature [ºC]
T
s,i
Surface temperature [ºC]
T
surr
Temperature of the surroundings [ºC]
T
w
Wood block temperature [ºC]
U Uncertainty
V Voltage supplied to the heater [V]
V
avg
Average velocity of all jets [m/s]
Volume flow rate [m
3
/s]
X Distance in the x-direction [m]
θ Inclination Angle [1.5º]
9. Subscripts
cp Copper plate
i Index number for each copper plate
j Jet
w Wood
10. Greek symbols
ε Emissivity
σ Stefan-Boltzman constant [W/(m
2
K
4
]
µ Dynamic Viscosity [kg/(ms)]
ρ Density [kg/m
3
]
11. References
Chupp, P. R. E., Helms, H. E., McFadden, P. W. and Brown, T. R. (1969). Evaluation of
internal heat-transfer coefficients for impingement-cooled turbine airfoils. J.
Aircraft, 6, 203-208.
Florschuetz, L. W., Metzger, D. E., Su, C. C., Isoda, Y. and Tseng, H. H. (1984). Heat transfer
characteristics for jet array impingement with initial cross flow. Journal of Heat
Transfer, 106 (1), 34-41.
Metzger, D. E. and Bunker, R. S. (1990). Local heat transfer in internally cooled turbine
airfoil leading edge regions: Part I – Impingement Cooling without Film Coolant
Extraction. Journal of Turbo machinery, 112 (3), 451-458.
Florschuetz, L. W., Metzger, D. E., Su, C. C., Isoda, Y. and Tseng, H. H. (1981). Stream-wise
flow and heat transfer distributions for jet impingement with cross flow. Journal of
Heat Transfer, 103 (2), 337-342.
Jet Impingement Cooling in Gas Turbines for Improving Thermal Efficiency and Power Density
209
Dong, L. L., Leung, C. W. and Cheung, C. S. (2002). Heat transfer characteristics of premixed
butane/air flame jet impinging on an inclined flat surface. Heat and Mass Transfer,
39 (1), pp. 19-26.
Rasipuram, S. C. and Nasr, K. J. (2004). A numerically-based parametric study of heat
transfer off an inclined surface subject to impinging air flow. International Journal of
Heat and Mass Transfer, 47 (23), 4967-4977.
Beitelmal, A. H., Saad, M. A. and Patel, C. D. (2000). Effect of inclination on the heat transfer
between a flat surface and an impinging two-dimensional air jet. International
Journal of Heat and Fluid Flow, 21 (2), 156-163.
Roy, S. and Patel, P. (2003). Study of heat transfer for a pair of rectangular jets impinging on
an inclined surface. International Journal of Heat and Mass Transfer, vol. 46, no. 3, pp.
411-425.
Ekkad, S. Huang, Yahoo. and Han, Je-Chin (2000). Impingement heat transfer measurements
under an Array of Inclined Jets. Journal of Thermophysics and Heat Transfer, 14 (2),
286-288.
Tawfek, A. A. (2002). Heat transfer studies of the oblique impingement of round jets upon a
covered surface. Heat and Mass Transfer, 38 (6), 467-475.
Seyedein, et. al. (1994). Laminar flow and heat transfer from multiple impinging slot jets
with an inclined confinement surface. International Journal of Heat and Mass Transfer,
37 (13), 1867-1875.
Yang, Y. and Shyu, C. H. (1998). Numerical study of multiple impinging slot jets with an
inclined confinement surface. Numerical Heat Transfer; Part A: Applications, 33 (1),
23-37.
Yan, X. and Saniei, N. (1997). Heat transfer from an obliquely impinging circular air jet to a
flat plate. International Journal of Heat and Fluid Flow, 18 (6), 591-599.
Hwang, J. J., Shih, N. C., Cheng, C, S., et. al. (2003). Jet-spacing effect on impinged heat
transfer in a triangular duct with a tangential jet–array. International Journal of
Transfer Phenomena, 5, 65-74.
Ramirez, C., Murray, D. B., and Fitzpatrick, J. A. (2002). Convective heat transfer of an
inclined rectangular plate. Experimental Heat Transfer, 15 (1), 1-18.
Stevens, J. and Webb, B. W. (1991). Effect of inclination on local heat transfer under an
axisymmetric free liquid Jet. International Journal of Heat and Mass Transfer, 34 (4-5),
1227-1236.
Hwang, J. J. and Cheng, C. S.(2001). Impingement cooling in triangular ducts using an
array of side-entry wall jets. International Journal of Heat and Mass Transfer, 44,
1053-1063.
Hwang, J.J. and Cheng, T. T. (1999). Augmented heat transfer in a triangular duct by using
multiple swirling jets. Journal of Heat Transfer, 121, 683-690.
Hwang, J. J. and Chang, Y. (2000). Effect of outflow orientation on heat transfer and pressure
drop in a triangular duct with an array of tangential jets. Journal of Heat Transfer,
122, 669-678.
Hwang, J.J. and Cheng, C. S. (1999). Detailed heat transfer distributions in a triangular duct
with an array of tangential jets. Journal of Flow Visalizationa & Image Processing, 6,
115-128.
Advances in Gas Turbine Technology
210
Taylor, B. N. and Kuyatt, C. E. (1994). Guidelines for evaluating and expressing the
uncertainty of NIST measurement results. National Institute of Standards and
Technology, 1297-1303.
Hwang, Y., Ekkad, S. V. and Han, J. (1998). Detailed heat transfer distributions under an
array of orthogonal impinging jets. Journal of Thermophysics and Heat Transfer, 12 (1),
73-79.
10
Influence of Heat Transfer on
Gas Turbine Performance
Diango A., Périlhon C., Danho E. and Descombes G.
Laboratoire de génie des procédés pour l’environnement,
l’énergie et la santé Conservatoire national des arts et métiers,
Paris
France
1. Introduction
In the current economic and environmental context dominated by the energy crisis and
global warming due to the CO
2
emissions produced by industry and road transportation,
there is an urgent need to optimize the operation of thermal turbomachinery in general
and of gas turbines in particular. This requires exact knowledge of their typical
performance.
The performance of gas turbines is usually calculated by assuming an adiabatic flow, and
hence neglecting heat transfer. While this assumption is not accurate for high turbine inlet
temperatures (above 800 K), it provides satisfactory results at the operating point of
conventional machines because the amount of heat transferred is generally low (less than
0.5% of thermal energy available at the turbine inlet). Internal and external heat transfer are
therefore neglected and their influence is not taken into account.
However, current heating needs and the decentralized production of electrical energy
involve micro Combined Heat and Power (CHP) using micro-gas turbines (20-250 kW).
In aeronautics, the need for a power source with a high energy density also contributes to
interest in the design of ultra-micro gas turbines.
These ultra and micro machines, which operate on the same thermodynamic principles as
large gas turbines, cannot be studied with the traditional adiabatic assumption, as has been
underlined by many authors such as Ribaud (2004), Moreno (2006) and Verstraete et al.
(2007). During operation, heat is transferred from the turbine to the outside, bearing oil,
casing and compressor, thus heating the compressor and leading to a drop in turbine
performance. Consequently, the performances reported on the maps developed under the
adiabatic assumption are no longer accurate.
This chapter presents:
The influence of heat transfer on the performance at an adiabatic operating point of a
gas turbine, and a method for determining the actual operating point knowing the
amount of heat transfer.
A study of heat loss versus the geometry scale of the volute and some conclusions
concerning the limits of validity of the adiabatic assumption.
Advances in Gas Turbine Technology
212
2. Relocating an adiabatic operation point subjected to heat transfer on a gas
turbine map
2.1 Introduction
The performance of a turbomachine is usually represented graphically with dimensionless
coordinates obtained under the assumption of adiabaticity from an existing machine.
These maps are employed by manufacturers and users to determine the overall performance
in order to design a new machine or to use the same machine in different operating
conditions. The results obtained are not always accurate, however, as this assumption is not
valid in all circumstances. Under the influence of heat transfer, the supposedly adiabatic
operating point may shift its position. The dimensionless coordinates change, making it
necessary to find the actual values for a correct assessment of performance.
In order to simulate the movement of an adiabatic operating point subjected to heat transfer,
we consider the single-shaft gas turbine with a simple cycle; the maps are shown in Fig. 13
(Pluviose 2005).
Fig. 1. Adiabatic compressor map of the gas turbine studied (Pluviose, 2005)
Influence of Heat Transfer on Gas Turbine Performance
213
Fig. 2. Isentropic efficiency versus expansion ratio of the turbine (Pluviose, 2005)
Advances in Gas Turbine Technology
214
P
i3
: turbine inlet pressure;
P
i4
: turbine outlet pressure;
T
i3
: turbine inlet temperature;
T
i4
: turbine outlet temperature.
Fig. 3. Expansion ratio versus dimensionless mass flow rate (Pluviose, 2005)
2.2 Adiabatic, insulated and non insulated gas turbine versions
In its simplest form, as shown in Fig. 4, a gas turbine consists of:
A centrifugal or axial air compressor;
A combustion chamber in which a mixture of air and fuel is burnt;
A centripetal or axial turbine;
A user device (alternator, pumps, etc.).
Neglecting the kinetic and potential energy, the formulation of the first law of thermodynamics
in an open system applied to turbomachinery (compressor and turbine) is written:
In transient conditions:
dh w q
(1)
In steady conditions:
hwq
(2)
dh: elementary variation of enthalpy;
δw: elementary work exchanged;
δq: elementary amount of heat exchanged with the surroundings;
Δh: specific enthalpy variation;
w: specific work exchanged by the fluid with the moving parts of the machine;
q: heat exchanged by the fluid with its surroundings.
Influence of Heat Transfer on Gas Turbine Performance
215
Fig. 4. Simple-cycle, open flow, single-shaft gas turbine
In conventional machines, calculations are usually done by assuming that the gas turbine is
adiabatic (q = 0).
The adiabatic version of a gas turbine is one in which the heat exchanged by the fluid with
surroundings in the turbomachine is exactly zero (compressor: q
12
; turbine: q
34
). This version
cannot be obtained in practice because of the difference in temperature between the turbine
inlet and the surroundings. In order to approximate this ideal configuration, experimenters
introduce some thermal insulation. This leads to the concept of insulated and non-insulated
gas turbines.
In an insulated gas turbine, the fluid in the turbomachine is assumed not to exchange
thermal energy with the surroundings. In practice, this is achieved by insulating the
machines with very low thermally conductive materials. However, because of the external
insulation, internal heat exchange (in particular from the turbine to the compressor) is
increased and must be taken into account.
The non insulated gas turbine is equivalent to one in which internal and external heat
transfer coexist.
2.3 Characteristics of the nominal operating point of an adiabatic gas turbine
(Pluviose, 2005)
The assumptions are:
Power of mechanical losses: P
ml
= 66 kW;
Turbine inlet temperature: T
i3
=973 K;
Isentropic efficiency of the turbine: η
T
= 0.85;
Rotational speed : N=8000 rpm;
The compressor mass flow rate: q
m
: 20 kg.s
-1
;
Inlet conditions : p
i1
=1.013 bar et T
i1
= 288 K ;
Specific heat at constant air pressure: c
p
=1 kJ/kg
Specific heat at constant pressure of the burnt gas: c
p
=1.13 kJ/kg
Advances in Gas Turbine Technology
216
Compression ratio :
c
= 7 ;
Isentropic efficiency of the compressor : η
C
= 0.8 ;
Pressure drop in combustion chamber: 5%;
Specific heat ratios : for air γ =1.4 ; for burnt gas γ = 1.33 ;
Turbine outlet pressure: p
i4
= 1.05 bar.
The characteristics of the operating point of the adiabatic gas turbine are summarized in
Table 1.
q
m
(kg.s
-1
)
C
or
T
N
(rpm)
P
GT
(kW)
T
i3
(K)
Q
cc
(kW)
η
GT
%
Adiabatic
compressor
20 7 8 000
1 526.4 973 9 431 16.2
Adiabatic
turbine
20 6.42 8 000
Table 1. Characteristics of the operating point of an adiabatic gas turbine
The energy balance at the operating point is shown in Table 2 (see the detailed calculations
in the appendix).
Energy balance
kW %
Thermal power provided by fuel 9430.7 100
Gas Turbine power 1526.2 16.2
Thermal power loss at exhaust 7838.5 83.12
Mechanical losses 66 0.7
Thermal losses 0 0
Table 2. Energy balance at the operating point of the adiabatic gas turbine
2.4 Characteristics of the nominal operating point of a non-adiabatic gas turbine
As indicated in section 2.2, there are two non-adiabatic versions of the gas turbine: the
insulated and the non-insulated version.
2.4.1 Influence of heat transfer on the adiabatic nominal operating point
In order to understand the influence of heat transfer on the nominal operating point, we
assume that the turbine is cooled so that the heat losses account for 15% of the adiabatic work.
For the non-insulated version, 60% of these losses are considered to contribute to the heating
of the compressor (Rautenberg & al. 1981).
In the insulated version, it is assumed that all the heat lost by the turbine is received by the
air in the compressor.
In this study, the amount of heat exchanged is assumed known. The internal work depends on
the outlet temperature. In practice, during operation, the outlet temperature of the machine
can be measured. But, here, we choose T
i2
>T
i2ad
(compressor) and T
i4is
<T
i4
<T
i4ad
(turbine).
Table 3 and Table 4 summarize the new performances calculated for the adiabatic gas
turbine used in insulated and non-insulated versions at the adiabatic operating point.
Influence of Heat Transfer on Gas Turbine Performance
217
q
m
(
k
g
-1
)
π
C
ou
π
T
N
(
r
p
m
)
P
GT
(
kW
)
T
i3
(
K
)
Qcc
(
kW
)
η
GT
%
Heated compressor
20 7 8 000
1 128 973 8 521 13.2
Cooled Turbine
20 6.42 8 000
Table 3. Characteristics of nominal operating point in non insulated version
q
m
(
k
g
-1
)
π
C
ou
π
T
N
(
r
p
m
)
P
GT
(
kW
)
T
i3
(
K
)
Qcc
(
kW
)
η
GT
%
Heated compressor
20 7 8 000
1010.38 973 7917 12.8
Cooled Turbine
20 6.42 8 000
Table 4. Characteristics of nominal operating point in insulated version
The comparison of the results in Table 1, Table 3 and Table 4, leads to the following
comments:
Energy efficiency has dropped from 16.2 to 13.2% (Table 1 and Table 3), and from 16.2
to 12.8% (Table 1 and Table 4);
Net power of the gas turbine has decreased from 1 526 to 1 128 kW, or by 26% (Table 1
and Table 3); from 1526 to 1010 kW, or by 34% (Table 1 and Table 4);
We can therefore conclude that if the gas turbine operates with heat transfer while maintaining
the same parameters as under nominal adiabatic operation, there is a drop in performance.
This significant drop in performance makes it necessary to determine the actual operating
point, taking into account heat transfer and the needs of user devices. For example, in a
power plant equipped with a gas turbine, meeting the needs of the consumer requires that
the power be kept constant. This involves finding the new non-adiabatic operating point
which fulfills this criterion (same power at constant rotational speed).
2.4.2 Search for a new operating point able to provide the same power
Search for the new operating point of the compressor
The gas turbine operates under adiabatic or non-adiabatic conditions at 8000 rpm. For this
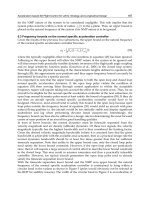
speed, the output power is plotted versus the compression ratio in the three configurations:
adiabatic, insulated and non-insulated versions (Figure 5).
For the selected power value, the new compression ratios in insulated and non-insulated
operation can be deduced. Then drawing this pressure ratio on the compressor map (Fig. 6),
the mass flow rate and the efficiency of this point are deduced.
Comments:
It can be seen on Figure 5 that for the same compression ratio, the net output power is low in
the insulated version. The highest output power is obtained in the adiabatic version.
For the same power, the compression ratio is low in the non-insulated version. The lowest
value is obtained in the adiabatic version.
Search for the new operating point of the turbine
As the rotational speed is constant and imposed, the required power can be achieved only
by means of the quantity of injected fuel which has a direct influence on T
i3
(turbine inlet
temperature).
Advances in Gas Turbine Technology
218
Fig. 5. Output power of the gas turbine versus compression ratio in adiabatic, non-insulated
and insulated version
Due to the turbine characteristics, for a pressure ratio above that shown in Fig.3, the reduced
mass flowing through the turbine is a constant which was calculated for the nominal
operating point in adiabatic conditions (Pluviose, 2005). A reduced mass flow makes it
possible to determine the new value of T
i3
corresponding to the new pressure p
i3
.
3
3
i
m
i
T
qcst
p
(3)
q
m
: mass flow rate (kg.s
-1
);
T
i3
: turbine inlet temperature (K);
p
i3
: turbine inlet pressure (p
a
).
Non-insulated gas turbine
The characteristics of the new operating points are summarized in table 5 (see calculations in
the appendix).
Comparing the results of Table 1 to Table 5, it can be observed that:
The mass flow rate has decreased. It varies from 20 to 19.8 kg
-1
. The relative deviation is
1%;
The compression ratio has increased from 7 to 7.17 with a relative deviation of 2.4%;
The turbine inlet temperature has risen from 973 to 1 041 K. The maximum is 1100 K;
The energy efficiency has decreased to 16.2 à 15.6% (the relative deviation is 3.7%).
Influence of Heat Transfer on Gas Turbine Performance
219
q
m
(kg.s
-1
)
π
C
ou
π
T
N
(rpm)
P
GT
(kW)
T
i3
(K)
Q
cc
(kW)
η
GT
%
Heated compressor
19.8 7.17 8 000
1526.2 1040.6 9764 15.6
Cooled turbine
19.8 6.57 8 000
Table 5. Characteristics of the new operating point in the non-insulated version
Insulated gas turbine
In order to simplify calculations, we consider that all the heat lost by the turbine is fully
received by the compressor
q
m
(kg.s
-1
)
π
C
ou
π
T
N
(rpm)
P
GT
(kW)
T
i3
(K)
Q
cc
(kW)
η
GT
%
Heated compressor
19.5 7.22 8 000
1526.2 1088 10253 14.9
Cooled turbine
19.5 6.62 8 000
Table 6. Characteristics of the new operating point in the insulated version
When the results of tables 1 and 6 are compared, it can be seen that:
The mass flow rate has decreased from 20 to 19.5 kg.s
-1
. The relative deviation is 2.5%;
The compression ratio has increased from 7 to 7.22. The relative increase is 3.14%;
The turbine inlet temperature has increased from 973 to 1 088 K. The limit is 1 100 K;
The energy efficiency has dropped from 16.2 to 14.9% (the relative deviation is 8.02%).
Overall in the two operating configurations, the operating area on the compressor map has
slightly narrowed.
However, the temperature increase can be a problem, as this value has a direct influence on
the turbine life span.
Fig. 6. Adiabatic compressor map with operating points in the three configurations
Advances in Gas Turbine Technology
220
2.4.3 Energy balance of new operating points
Non-insulated gas turbine
Energy balance
kW %
Calorific power provided by the fuel 9764 100
GT power 1526.2 15.6
Exhaust power 7129.6 73.0
Mechanical losses 66 0.7
Thermal losses 1042 10.7
Table 7. Energy balance of the new operating point (non-insulated gas turbine)
Insulated gas turbine
Energy balance
kW %
Calorific power provided by the fuel 10253 100
GT power 1526.2 14.9
Exhaust power 7618.8 74.3
Mechanical losses 66 0.6
Thermal losses 1042 10.2
Table 8. Energy balance of the new operating point (insulated gas turbine)
Comparing tables 7 and 8, we can see that at iso speed and iso net power produced, the
efficiency of the gas turbine is better in the non-insulated version.
2.5 Comparison with experimental results
The analysis and the results presented above for the nominal operating point were extended
to the other points of the working area.
Figure 8 shows the experimental results obtained by Moreno (2006) on a small gas turbine
(75 kW).
The tests were carried out in two versions: an insulated version at 39 000 rpm and a non-
insulated one at 40 000 rpm. It may be noted that the speeds are not identical because of the
practical difficulties of measurement in testing. But the relative difference of 2.5% between
these two speeds can be considered negligible.
Figure 9 shows that, as in the case of our study, iso-speed, iso net power produced by the
gas turbine, and energy efficiency are better in the insulated than in the non-insulated
version.
Influence of Heat Transfer on Gas Turbine Performance
221
Fig. 7. Energy efficiency versus net power produced (Moreno, 2006)
This study not only confirms the decrease in performance due to heat losses, but also that
this drop in performance is proportionally greater with the internal heat transfer.
Compared with the gas turbine studied here (1500 kW), it can be seen that the energy
efficiency of the gas turbine used by Moreno (75 kW) is very low: 8% vs 16% at nominal
power. This can be attributed to the size of the machine: it is a small machine with a nominal
power about approximately twenty times smaller. Heat losses could be the cause of the drop
in performance.
3. Heat transfer and geometric scale of gas turbines
As already mentioned in the introduction, the results of the performance calculations
carried out in conventional turbomachines remain satisfactory at the full load operating
point. In addition, the literature indicates that the impact of heat transfer on the
performance of small turbomachines is negative. In these circumstances, it is important to
know the characteristic size of the machines in which the assumption of adiabaticity is no
longer valid.
This study of heat transfer limited only to the volute of machines studied is conducted in
similar operating conditions. It therefore calls on the notion of similarity.
3.1 The similarity of turbomachines: a summary
Similarity makes it possible, when a physical phenomenon for given operating conditions is
known, to predict the same phenomenon for other conditions through laws involving
dependent and independent dimensionless variables. Similarity generally focuses on two
Advances in Gas Turbine Technology
222
aspects: the geometric aspect that is relative to a family of geometrically similar machines,
and the functional aspect that deals with a family of machines with similar operation. These
two aspects are simultaneously taken into account.
For adiabatic machines, the dimensionless independent variables used to characterize the
similar operating points are (Pluviose, 2005):
dimensionless mass flow rate
dimensionless speed.
For adiabatic machines, the dimensionless independent variables used to characterize the
similar operating points are ( Pluviose, 2005):
Dimensionless mass flow rate:
mi1
2
i1
qrT
pR
Dimensionless rotational speed:
i1
NR
rT
q
m
: mass flow rate (kg.s
-1
);
T
i1
: turbomachine inlet temperature(K);
p
i3
: turbomachine inlet pressure (p
a
);
R
: external radius of the rotor a (m);
r : specific perfect gas constant (J.kg
-1
).
A study of similarity in non-adiabatic turbomachines operating with compressible fluid,
conducted by Diango (2010) led to the generalization of Rateau’s theorem. The author shows
that these two dimensionless variables are also valid when operating with heat transfer.
From the foregoing and for a judicious comparison of heat exchange in different volutes, it is
generally assumed that the fluid flows are similar. This leads to the following assumptions:
Inlet parameters are the same (pressure and temperature);
Reynolds numbers are equal;
The inlet dimensionless velocities are identical;
The mass flow rate is the same in the volutes.
In the heat transfer equations, only the mass flow rate and the inlet conditions are involved.
For two machines a and b, the first and last assumptions imply:
2
ma i1 mb i1
ma
mb
22 2
i1 i1
qrTqrT
qR
q
Rp Rp R
b
ab a
2
ma
mb
2
qR
q
R
b
a
(4)
q
ma
: mass flow rate of machine a (kg.s
-1
);
q
mb
: mass flow rate of machine b (kg.s
-1
);
p
i1
: inlet pressure (p
a
);
T
i1
: inlet temperature (K);
Influence of Heat Transfer on Gas Turbine Performance
223
R
a
: external radius of the rotor of machine a (m);
R
b
: external radius of the rotor of machine b (m);
r: specific perfect gas constant (J.kg
-1
).
Due to the complex geometry of the casing (volute) of turbomachines and the difficulties of
calculating heat transfer coefficients, a numerical approach has been adopted.
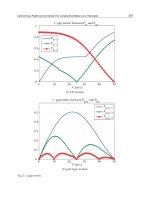
3.2 Mathematical modeling of heat transfer in the gas turbine volute
Fig. 8. External shape of the volute
h (0): Inlet height (m)
Fig. 9. Inlet section of the volute ( = 0)
β
b(
0
)
h
(
0
)
a