Air Quality Part 11 pptx
Bạn đang xem bản rút gọn của tài liệu. Xem và tải ngay bản đầy đủ của tài liệu tại đây (1.9 MB, 25 trang )
Nonlocal-closure schemes for use in air quality and environmental models 243
both schemes (TKE and OLD) are shown in Fig. 3. The values used in calculations were
averaged over the whole domain of integration. It can be seen that both schemes
underestimate the observations. However, for all considered months, NO
2
concentrations
calculated with the TKE scheme are in general higher and closer to the observations than
those obtained by the OLD scheme (of the order of 10%). Correspondingly, the bias of the
TKE scheme is lower than the OLD scheme. The comparison of the modeled and observed
NO
2
in air (µg(N) m
-3
) concentrations between VUR and OLD schemes is shown in Fig. 4.
The values used in the calculations were also averaged over the whole domain of
integration. It can be seen that both schemes underestimate the observations. However, for
all considered months, NO
2
concentrations calculated with the VUR scheme are in general
higher and closer to the observations than those obtained using the eddy diffusion scheme
(of the order of 15-20%). Accordingly, the bias of the VUR scheme is lower than the OLD
eddy diffusion scheme.
To quantify the simulated values of the both schemes we have performed an error analysis
of the NO
2
concentration outputs NO
2
based on a method discussed in Pielke (2002).
Following that study, we computed several statistical quantities as follows
1 2
2
1
ˆ
[ ( ) / ]
N
i i
i
N
,
(23)
1 2
1
ˆ ˆ
{ [( ) ( )]/ }
N
BR i i
i
N
,
(24)
1 2
2
1
[ ( ) / ]
N
i
i
N
,
(25)
1 2
2
1
ˆ ˆ
ˆ
[ ( ) / ]
N
i
i
N
. (26)
Here,
is the variable of interest (aforementioned variables in this study) while N is the
total number of data. An overbar indicates the arithmetic average, while a caret refers to an
observation. The absence of a caret indicates a simulated value;
is the rmse, while
BR
is
rmse after a bias is removed. Root-mean-square errors (rmse) give a good overview of a
dataset, with large errors weighted more than many small errors. The standard deviations in
the simulations and the observations are given by
and
ˆ
. A rmse that is less than the
standard deviation of the observed value indicates skill in the simulation. Moreover, the
values of
and
ˆ
should be close if the prediction is to be considered realistic.
Fig. 3. The eddy diffusion (OLD) versus TKE scheme. Comparison of: the modeled and
observed NO
2
in air (µg(N) m
-3
) concentrations (left panels) and their biases (right panels) in
the period April-September for the years 1999, 2001 and 2002. M and O denotes modeled
and observed value, respectively.
The statistics gave the following values: (1) TKE (
0 548
. , 0 293
BR
. , 0 211
. , 0 147
ˆ
.
)
and OLD (
0 802
. , 0 433
BR
. , 0 303
. , 0 147
ˆ
.
) and (2) VUR ( 0 571
.
µg(N) m
-3
,
0 056
BR
. µg(N) m
-3
, 0 219
. µg(N) m
-3
, 0 211
ˆ
.
µg(N) m
-3
) and OLD
(
0 802
. , 0 159
BR
. ,
=0.303,
ˆ
=0.211). A comparison of
and
ˆ
, for (1) and (2),
shows that difference between them, is evidently smaller with the TKE and VUR scheme
schemes versus the OLD one.
Air Quality244
Fig. 4. The eddy diffusion (OLD) versus the VUR scheme. Comparison of: (a) the modelled
and observed NO
2
in air (µg(N) m
-3
) concentrations and (b) their biases in the period April-
September for the year 2002. M and O denotes modelled and observed value, respectively.
4. Conclusions
In the ABL during convective conditions, when much of the vertical mixing is driven by
buoyant plumes, we cannot properly describe mixing processes using local approach and
eddy diffusion schemes. Nonlocal-closure schemes simulate much better vertical mixing
than local ones. In this chapter, two nonlocal schemes (the TKE scheme and the VUR
scheme) for applications in air quality and environmental models are described. The
comparison of the TKE scheme and the VUR one with an eddy diffusion scheme (OLD)
commonly used in chemical transport models was done. These comparisons were
performed with the EMEP Unified chemical model using simulated and measured
concentrations of the pollutant NO
2
since it is one of the most affected ones by the processes
in the ABL layer. Nonlocal shemes gave better results than local one.
Acknowledgement
The research work described here has been funded by the Serbian Ministry of Science and
Technology under the project “Study of climate change impact on environment: Monitoring
of impact, adaptation and moderation”, for 2011-2014.
5. References
Alapaty, K.; Pleim, J.E.; Raman, S.; Niyogi, D.S. & Byun, D.W. (1997). Simulation of
atmospheric boundary layer processes using local- and nonlocal-closure schemes,
Journal of Applied Meteorology, 36, 214–233 ISSN 0894-8763
Alapaty, K. & Alapaty, M. (2001). Development of a diagnostic TKE schemes for
applications in regional and climate models using MM5.
Research Note, MCNC-
North Carolina Supercomputing Center, Research Triangle Park, NC, pp. 5.
Alapaty, K. (2003). Development of two CBL schemes using the turbulence velocity scale.
4th WRF Users’ workshop, Boulder, Colorado, June 25-27.
Blackadar, A.K. (1976). Modeling the noctural bondary layer.
Proceedings of 4
th
Symposium of
Atmospheric Turbulence, Diffusion and Air Quality
, pp. 46-49, Boston, American
Meteorological Society
Blackadar, A.K. (1979). Modeling pollutant transfer during daytime convection.
4
th
Symposium on Atmospheric Turbulence Diffusion and Air Quality
, Reno, NV, American
Meteorological Society, pp. 443-447.
Berge, E. & Jacobsen H.A. (1998). A regional scale multi-layer model for the calculation of
long-term transport and deposition of air-pollution in Europe.
Tellus. Series B,
Chemical and physical meteorology,
50, 205-223, ISSN 0280-6509
Bjorge, D. & Skalin, R. (1995). PARLAM – the parallel HIRLAM version of DNMI. Research
Report No. 27, Norwegian Meteorological Institute, Oslo, Norway, ISSN 0332-9879
Businger, J.A.; Izumi, Y. & Bradley, E.F. (1971). Flux profile relationships in the atmospheric
surface layer.
Journal of the Atmospheric Sciences, 28, 181-189.
Fagerli, H. & Eliassen, A. (2002). Modified parameterization of the vertical diffusion. In:
Transboundary acidification, eutrophication and ground level ozone in Europe.
EMEP Summary Status Report,
Research Report No. 141, Norwegian Meteorological
Institute, Oslo, Norway, pp. 74.
Hass, H.; Jacobs, H.J.; Memmesheimer, M.; Ebel, A. & Chang, J.S. (1991). Simulation a wet
deposition case in Europe using European Acid Deposition Model (EURAD). In:
Air Pollution modeling and its Applications VIII
, pp. 205-213, Plenum Press, New York
Holtslag, A.A.M.; de Bruin, E.I.F. & Pan, H L. (1990). A high resolution air mass
transformation model for short-range weather forecasting.
Monthly Weather Review,
118, 1561-1575, ISSN 0027-0644
Holtslag, A.A.M. & Boville, B.A. (1993). Local versus nonlocal boundary layer diffusion in a
global climate model.
Journal of Climate, 6, 1825-1842, ISSN 0894-8755
Hong, S.Y. & Pan, H.L., (1996). Nonlocal boundary layer vertical diffusion in a medium-
range forecast model.
Monthly Weather Review, 124, 2322-2339, ISSN 0027-0644
Lenschow, D.H.; Li, X.S. & Zhu, C.J. (1988). Stably stratified boundary layer over the Great
Plains. Part I: Mean and turbulent structure.
Boundary-Layer Meteorology, 42, 95-121,
ISSN 0006-8314
Miesch, M.S.; Brandenburg, A.; Zweibel, A. & Zweibel, E.G. (2000). Nonlocal transport of
passive scalars in turbulent penetrative convection.
Physical Review E, 61, 457–467,
ISSN 1539-3755
Mihailovic D.T. & Jonson J.E. (2005).
Implementation of a TKE scheme in the Unified EMEP
model. Air Pollution report
5/2005, Norwegian Meteorological Institute, Oslo, ISSN
1503-8025.
Nonlocal-closure schemes for use in air quality and environmental models 245
Fig. 4. The eddy diffusion (OLD) versus the VUR scheme. Comparison of: (a) the modelled
and observed NO
2
in air (µg(N) m
-3
) concentrations and (b) their biases in the period April-
September for the year 2002. M and O denotes modelled and observed value, respectively.
4. Conclusions
In the ABL during convective conditions, when much of the vertical mixing is driven by
buoyant plumes, we cannot properly describe mixing processes using local approach and
eddy diffusion schemes. Nonlocal-closure schemes simulate much better vertical mixing
than local ones. In this chapter, two nonlocal schemes (the TKE scheme and the VUR
scheme) for applications in air quality and environmental models are described. The
comparison of the TKE scheme and the VUR one with an eddy diffusion scheme (OLD)
commonly used in chemical transport models was done. These comparisons were
performed with the EMEP Unified chemical model using simulated and measured
concentrations of the pollutant NO
2
since it is one of the most affected ones by the processes
in the ABL layer. Nonlocal shemes gave better results than local one.
Acknowledgement
The research work described here has been funded by the Serbian Ministry of Science and
Technology under the project “Study of climate change impact on environment: Monitoring
of impact, adaptation and moderation”, for 2011-2014.
5. References
Alapaty, K.; Pleim, J.E.; Raman, S.; Niyogi, D.S. & Byun, D.W. (1997). Simulation of
atmospheric boundary layer processes using local- and nonlocal-closure schemes,
Journal of Applied Meteorology, 36, 214–233 ISSN 0894-8763
Alapaty, K. & Alapaty, M. (2001). Development of a diagnostic TKE schemes for
applications in regional and climate models using MM5.
Research Note, MCNC-
North Carolina Supercomputing Center, Research Triangle Park, NC, pp. 5.
Alapaty, K. (2003). Development of two CBL schemes using the turbulence velocity scale.
4th WRF Users’ workshop, Boulder, Colorado, June 25-27.
Blackadar, A.K. (1976). Modeling the noctural bondary layer.
Proceedings of 4
th
Symposium of
Atmospheric Turbulence, Diffusion and Air Quality
, pp. 46-49, Boston, American
Meteorological Society
Blackadar, A.K. (1979). Modeling pollutant transfer during daytime convection.
4
th
Symposium on Atmospheric Turbulence Diffusion and Air Quality
, Reno, NV, American
Meteorological Society, pp. 443-447.
Berge, E. & Jacobsen H.A. (1998). A regional scale multi-layer model for the calculation of
long-term transport and deposition of air-pollution in Europe.
Tellus. Series B,
Chemical and physical meteorology,
50, 205-223, ISSN 0280-6509
Bjorge, D. & Skalin, R. (1995). PARLAM – the parallel HIRLAM version of DNMI. Research
Report No. 27, Norwegian Meteorological Institute, Oslo, Norway, ISSN 0332-9879
Businger, J.A.; Izumi, Y. & Bradley, E.F. (1971). Flux profile relationships in the atmospheric
surface layer.
Journal of the Atmospheric Sciences, 28, 181-189.
Fagerli, H. & Eliassen, A. (2002). Modified parameterization of the vertical diffusion. In:
Transboundary acidification, eutrophication and ground level ozone in Europe.
EMEP Summary Status Report,
Research Report No. 141, Norwegian Meteorological
Institute, Oslo, Norway, pp. 74.
Hass, H.; Jacobs, H.J.; Memmesheimer, M.; Ebel, A. & Chang, J.S. (1991). Simulation a wet
deposition case in Europe using European Acid Deposition Model (EURAD). In:
Air Pollution modeling and its Applications VIII
, pp. 205-213, Plenum Press, New York
Holtslag, A.A.M.; de Bruin, E.I.F. & Pan, H L. (1990). A high resolution air mass
transformation model for short-range weather forecasting.
Monthly Weather Review,
118, 1561-1575, ISSN 0027-0644
Holtslag, A.A.M. & Boville, B.A. (1993). Local versus nonlocal boundary layer diffusion in a
global climate model.
Journal of Climate, 6, 1825-1842, ISSN 0894-8755
Hong, S.Y. & Pan, H.L., (1996). Nonlocal boundary layer vertical diffusion in a medium-
range forecast model.
Monthly Weather Review, 124, 2322-2339, ISSN 0027-0644
Lenschow, D.H.; Li, X.S. & Zhu, C.J. (1988). Stably stratified boundary layer over the Great
Plains. Part I: Mean and turbulent structure.
Boundary-Layer Meteorology, 42, 95-121,
ISSN 0006-8314
Miesch, M.S.; Brandenburg, A.; Zweibel, A. & Zweibel, E.G. (2000). Nonlocal transport of
passive scalars in turbulent penetrative convection.
Physical Review E, 61, 457–467,
ISSN 1539-3755
Mihailovic D.T. & Jonson J.E. (2005).
Implementation of a TKE scheme in the Unified EMEP
model. Air Pollution report
5/2005, Norwegian Meteorological Institute, Oslo, ISSN
1503-8025.
Air Quality246
Mihailovic, D.T.; Rao, S.T.; Alapaty, K.; Ku, J.Y.; Arsenic, I. & Lalic, B. (2005). A study of the
effects of subgrid-scale representation of land use on the boundary layer evolution
using 1-D model.
Environmental Modelling and Software, 20, 705-714, ISSN 1364-8152
Mihailovic, D.T. & Alapaty, K. (2007). Intercomparison of two K-schemes: Local versus non-
local in calculating concentrations of pollutants in chemical and air-quality models.
Environmental Modelling and Software
, 22, 1685-1689, ISSN 1364-8152
Mihailović, D.T.; Alapaty, K. & Sakradžija, M. (2008). Development of a nonlocal convective
mixing scheme with varying upward mixing rates for use in air quality and
chemical transport models
Environmental Software and Pollution Research, 15, 296-
302, ISSN 0944-1344
Moeng, C H. & Sullivan, P.P. (1994). A comparison of shear and buoyancy driven planetary-
boundary-layer flows.
Journal of the Atmospheric Sciences, 51, 999-1022, ISSN 0022-4928
O’Brien, J.J. (1970). A note on the vertical structure of the eddy exchange coefficient in the
planetary boundary layer.
Journal of the Atmospheric Sciences, 27, 1213-1215, ISSN
0022-4928
Pielke, R.A., Sr. (2002).
Mesoscale Meteorological Modeling. 2
nd
ed. Academic Press, 676 pp. San
Diego, CA.
Pleim, J.E. & Chang, J. S. (1992). A non-local closure model for vertical mixing in the
convective boundary layer.
Atmospheric Environment, A26, 965-981, ISSN 1352-2310
Simpson, D.; Fagerli, H.; Jonson, J.E.; Tsyro, S.; Wind, P. & Tuovinen, J P. (2003).
Transboundary acidification, eutrophication and ground level ozone in Europe.
Part I: Unified EMEP Model Description.
EMEP Status Report 2003, pp. 74, The
Norwegian Meteorological Institute, Norway
Stull, R.B. & Driedonks A.G.M. (1987) Applications of the transilient turbulence
parameterization to atmospheric boundary-layer simulations.
Boundary-Layer
Meteorology
, 40, 209-239, ISSN 0006-8314
Stull, R.B. (1988).
An Introduction to Boundary Layer Meteorology, Dordrecht: Kluwer.
Tonnesen, G.; Olaguer, J.; Bergin, M.; Russell, T.; Hanna, A.; Makar, P.; Derwent, D. &
Wang, Z. (1998).
Air quality models. Draft as of 11/26/98, pp. 55.
Troen, I. & Mahrt, L. (1986). A simple model of the atmospheric boundary layer; sensitivity
to surface evaporation.
Boundary-Layer Meteorology, 37, 129-148 ISSN 0006-8314
Wang, Z. (1998). Computing volatile organic compound reactivities with a 3-D AQM
Proceedings of the photochemical Reactivity Workshop
, U.S. Environmental protection
Agency, Durham, NC.
Wyngaard, J.C. & Brost, R.A. (1984). Top-down and bottom-up diffusion of a scalar in the
convective boundary layer.
Journal of the Atmospheric Sciences, 41, 102-112, ISSN 0022-4928
Zhang, D. & Anthes, R.C. (1982). A high-resolution model of the planetary boundary-layer-
sensitivity tests and comparisons with SESAME-79 data.
Journal of Applied
Meteorology
, 21, 1594-1609, ISSN 0894-8763
Zhang, C.; Randall, D.A.; Moeng, C H.; Branson, M.; Moyer, M. & Wang, Q. (1996). A
surface parameterization based on vertically averaged turbulence kinetic energy.
Monthly Weather Review, 124, 2521-2536, ISSN 0027-0644
Zhang, K.; Mao, H.; Civerolo, K.; Berman, S., Ku, J Y.; Rao, S.T.; Doddridge, B.; Philbrick,
C.R. & Clark, R. (2001). Numerical investigation of boundary layer evolution and
nocturnal low-level jets: local versus non-local PBL schemes.
Environmental Fluid
Mechanic
, 1, 171-208, ISSN 1567-7419
Air quality monitoring in the Mediterranean Tunisian coasts 247
Air quality monitoring in the Mediterranean Tunisian coasts
Karim Bouchlaghem, Blaise Nsom and Salem Elouragini
X
Air quality monitoring in the
Mediterranean Tunisian coasts
a,b
Karim BOUCHLAGHEM,
a
Blaise NSOM and
b
Salem ELOURAGINI
a
Université de Bretagne Occidentale. LBMS - EA 4325
Université Européenne de Bretagne
BP 93169. Rue de Kergoat. 29231. BREST Cedex 3 (France)
b
Unité de recherche « Energétique et Environnement » (03/ UR 13-06)
Institut Supérieur des Sciences Appliquées et de Technologie de Sousse
Cité Taffala, 4003 Sousse Ibn Khaldoun, (Tunisia)
1. Introduction
The transfer from the liquid element (the sea) to the solid one (the land) engenderers
thermal phenomena such breezes. During the day, the land heats up more rapidly than the
sea. Over the land surface, the heat spreads in the low layers and gives birth to upward
currents. This hot continental air rises up, and then is superseded by a colder air coming
from the sea; it is the sea breeze. During the night, the phenomenon is reversed to become a
land breeze.
If the synoptic wind is weak, the breezes will take their true size and result in the formation
of convergent zones on the land and divergent zones over the sea. Some visual signs can
help observe these phenomena. The low clouds of the cumulus type are a proof of the
vertical movement. They are often related to the setting of the sea breeze (Simpson, 1994).
Many experimental and numerical studies have shown the impact of breeze circulations on
the evolution of pollutant concentrations (Bouchlaghem et al., 2007; Srinivas et al., 2007;
Baumgardner et al., 2006; Evtyugina et al., 2006; Flocas et al., 2006; Lim et al., 2006). The
photochemical transformation also plays a crucial role in the production and destruction of
pollutants. These transformations coupled with the dynamic circulations such as breezes
represent the responsible process of the formation, transport and redistribution of reactive
chemical species in the low layers of the atmosphere.
The study made by (Ma and Lyons, 2003) via a 3D version of RAMS model (Regional
Atmospheric Modelling System) has shown that the recirculation of pollution is a
Mediterranean characteristic. They have defined the recirculation as follows: in the presence
of a weak synoptic wind, the heating and cooling of the land and the sea determine the local
circulation which affects the transport and diffusion of emissions. In fact, during the night,
emissions can be transported over the sea via a land breeze or an offshore synoptic wind just
to return onshore to the land after the launching of the sea breeze. The study of (Nester,
1995) has shown that the phenomena of photochemical Smog are generally associated with
this type of meteorological conditions such as, a weak synoptic wind and a recirculation of
11
Air Quality248
land and sea breezes. He insists that the local recirculation, the topography, the coast shapes
and the force of synoptic wind play important roles in the transport of pollution. The
numerical study of (Liu et al., 2002) shows the effect of the recirculation of land and sea
breezes on the ozone distribution. They demand that the ozone and its precursors be
transported over the sea by the land breeze. Later on, the front breeze transports the ozone
precursors on the land. A weak sea breeze and the intensification of solar radiations activate
the photochemical process and contribute to the ozone increase of concentration.
A 3D model of air pollution TAPM (The Air Pollution Model) (Luhar and Hurley, 2004)
second version has been applied to predict meteorological parameters and pollution field on
the Mediterranean. The obtained results display that the development of a sea breeze during
the day and a nocturnal land breeze due to the temperature contrast between the land and
the sea may reduce the diffusion of air masses in the presence of the recirculation. Via a
meso-scale model, (Ding et al., 2004) have explained that the late sea breeze development is
due to the presence of an offshore synoptic wind. These breezes are generally characterized
by the formation of a front breeze and a return current in the upper layers. They display that
this dynamic nature contributes to the ozone concentration increase on the
coasts. With
reference to the experimental data of the MEDiterranean CAmpaign of PHOtochemical
Tracers- TRAnsport and Chemical Evolution (MEDCAPHOT-TRACE), (Ziomas, 1998) has
proved that the pollution problems are strictly interconnected with the launching and the
steadiness of the sea breeze. Via the 3D version of RAMS Model (Regional Atmospheric
Modelling System) and the experimental data analysis, [Millan et al., 2002] have proved that
the sea breeze combines with the mountain breeze to create a recirculation over the
Mediterranean basin with a residence time of few days. Under the impact of solar radiation,
this recirculation takes the shape of photochemical reactor where the precursors give birth
to ozone, acids and aerosols. They remarked that the problem of air quality on the
Mediterranean basin is principally governed by diurnal meteorological process such as
breezes.
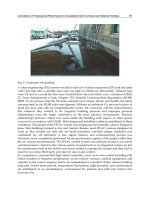
Fig. 1. North Africa map displaying Tunisia and Sousse region location (35° 48’ N, 10° 38’ E).
Several studies have pointed out, by using both in-situ and remote sensing observation, that
dynamics of polluted air masses in the Mediterranean are influenced by local and mesoscale
meteorological processes (Bouchlaghem et al., 2007; Helena et al., 2006; Viana et al., 2005;
Puygrenier et al., 2005; Pérez et al., 2004; Gangoiti et al., 2001, 2002; Kassomenos et al., 1998;
Ziomas, 1998 and Millan et al., 1996). During summer, transport of polluted air masses is
influenced by the sea-land breeze circulation (Millan et al., 2002). The later can affect urban
areas along the coasts and further inland as it can penetrate up to hundred kilometres inland
(Simpson et al., 1977; Simpson, 1994). Simultaneously, the Mediterranean climatic conditions
(high temperatures and intensive solar radiation) especially in the summer period, promote
the formation of photochemical secondary pollutants.
Synoptic scale meteorology induces frequent outbreaks of African Saharan dust reaching
most Mediterranean regions (Lyamani et al., 2005; Alastuey et al., 2005; Querol et al., 2004;
Rodriguez et al., 2002, 2004; Viana et al., 2002, 2003, 2007). The occurrence of dust outbreaks
affecting the Mediterranean has a marked seasonal behaviour, and is generally driven by
intense cyclone generated south of Atlas Mountain by the thermal contrast of cold marine
Atlantic air and warm continental air that cross North Africa during summer (Meloni et al.,
2007). Rodriguez et al., 2002) pointed out, through an analysis of experimental data recorded
on the eastern sites of Spain, that the highest PM event recorded in the Mediterranean were
frequently documented during outbreaks of African dust.
Annual pollution studies in the Mediterranean have pointed out that pollutant behaviour is
a tracer of seasonal meteorology dynamic and becomes a common feature characterizing
these regions (Simon et al., 2006; Marmer and Langmann, 2005).
Martin et al., 1991 suggest that the annual variation in meteorological conditions is a
common feature in most of the Mediterranean areas and results in air pollution cycles
different from those experienced in other latitudes.
Knowledge of the mechanisms that give rise to pollution episode in the Mediterranean
regions is needed for the purpose of providing health advice to the public in events
episodes.
To this end, local and seasonal variation of the main pollutants concentration and the
meteorological conditions were studied in this chapter.
The studied regions are presented in sections 2. The instrumentation and methods are
described in section 3. The seasonal behaviour derived from monthly average concentration
and meteorological parameters at the coastal sites is presented in section 4. Summer
evolution of Saharan dust and land-sea breeze events and relevant change in pollutants
concentrations at a selected site are discussed in section 5 and 6. Pollutants evolution is
presented in section 7.
2. Sites description
Tunisia country is located in the North part of Africa (Fig. 1). Its surface is 164.000 km2 with
10 millions inhabitants. Coastal cities share about 500 km of beach and are widely
influenced by the Mediterranean Sea. The four sites presented in this study are
Mediterranean coastal cities with relatively flat terrain.
Bizerte city is located at the North part of Tunisia (37° 16’ N, 9° 52’ E). Its urban area
accounts about 114.000 inhabitants. The measurement station sample is classified as urban
which is mainly influenced by residential, traffic and commercial activities. Tunis City
(capital of Tunisia) is also located in the North part of Tunisia (36° 49’ N, 10° 11’ E). The
urban area (750.000 inhabitants) is about 212.63 km2 surface. The sampling site is classified
as urban, located in the vicinity of one of Tunis’s major traffic Avenues (Bab Saadoun Ave.).
Air quality monitoring in the Mediterranean Tunisian coasts 249
land and sea breezes. He insists that the local recirculation, the topography, the coast shapes
and the force of synoptic wind play important roles in the transport of pollution. The
numerical study of (Liu et al., 2002) shows the effect of the recirculation of land and sea
breezes on the ozone distribution. They demand that the ozone and its precursors be
transported over the sea by the land breeze. Later on, the front breeze transports the ozone
precursors on the land. A weak sea breeze and the intensification of solar radiations activate
the photochemical process and contribute to the ozone increase of concentration.
A 3D model of air pollution TAPM (The Air Pollution Model) (Luhar and Hurley, 2004)
second version has been applied to predict meteorological parameters and pollution field on
the Mediterranean. The obtained results display that the development of a sea breeze during
the day and a nocturnal land breeze due to the temperature contrast between the land and
the sea may reduce the diffusion of air masses in the presence of the recirculation. Via a
meso-scale model, (Ding et al., 2004) have explained that the late sea breeze development is
due to the presence of an offshore synoptic wind. These breezes are generally characterized
by the formation of a front breeze and a return current in the upper layers. They display that
this dynamic nature contributes to the ozone concentration increase on the
coasts. With
reference to the experimental data of the MEDiterranean CAmpaign of PHOtochemical
Tracers- TRAnsport and Chemical Evolution (MEDCAPHOT-TRACE), (Ziomas, 1998) has
proved that the pollution problems are strictly interconnected with the launching and the
steadiness of the sea breeze. Via the 3D version of RAMS Model (Regional Atmospheric
Modelling System) and the experimental data analysis, [Millan et al., 2002] have proved that
the sea breeze combines with the mountain breeze to create a recirculation over the
Mediterranean basin with a residence time of few days. Under the impact of solar radiation,
this recirculation takes the shape of photochemical reactor where the precursors give birth
to ozone, acids and aerosols. They remarked that the problem of air quality on the
Mediterranean basin is principally governed by diurnal meteorological process such as
breezes.
Fig. 1. North Africa map displaying Tunisia and Sousse region location (35° 48’ N, 10° 38’ E).
Several studies have pointed out, by using both in-situ and remote sensing observation, that
dynamics of polluted air masses in the Mediterranean are influenced by local and mesoscale
meteorological processes (Bouchlaghem et al., 2007; Helena et al., 2006; Viana et al., 2005;
Puygrenier et al., 2005; Pérez et al., 2004; Gangoiti et al., 2001, 2002; Kassomenos et al., 1998;
Ziomas, 1998 and Millan et al., 1996). During summer, transport of polluted air masses is
influenced by the sea-land breeze circulation (Millan et al., 2002). The later can affect urban
areas along the coasts and further inland as it can penetrate up to hundred kilometres inland
(Simpson et al., 1977; Simpson, 1994). Simultaneously, the Mediterranean climatic conditions
(high temperatures and intensive solar radiation) especially in the summer period, promote
the formation of photochemical secondary pollutants.
Synoptic scale meteorology induces frequent outbreaks of African Saharan dust reaching
most Mediterranean regions (Lyamani et al., 2005; Alastuey et al., 2005; Querol et al., 2004;
Rodriguez et al., 2002, 2004; Viana et al., 2002, 2003, 2007). The occurrence of dust outbreaks
affecting the Mediterranean has a marked seasonal behaviour, and is generally driven by
intense cyclone generated south of Atlas Mountain by the thermal contrast of cold marine
Atlantic air and warm continental air that cross North Africa during summer (Meloni et al.,
2007). Rodriguez et al., 2002) pointed out, through an analysis of experimental data recorded
on the eastern sites of Spain, that the highest PM event recorded in the Mediterranean were
frequently documented during outbreaks of African dust.
Annual pollution studies in the Mediterranean have pointed out that pollutant behaviour is
a tracer of seasonal meteorology dynamic and becomes a common feature characterizing
these regions (Simon et al., 2006; Marmer and Langmann, 2005).
Martin et al., 1991 suggest that the annual variation in meteorological conditions is a
common feature in most of the Mediterranean areas and results in air pollution cycles
different from those experienced in other latitudes.
Knowledge of the mechanisms that give rise to pollution episode in the Mediterranean
regions is needed for the purpose of providing health advice to the public in events
episodes.
To this end, local and seasonal variation of the main pollutants concentration and the
meteorological conditions were studied in this chapter.
The studied regions are presented in sections 2. The instrumentation and methods are
described in section 3. The seasonal behaviour derived from monthly average concentration
and meteorological parameters at the coastal sites is presented in section 4. Summer
evolution of Saharan dust and land-sea breeze events and relevant change in pollutants
concentrations at a selected site are discussed in section 5 and 6. Pollutants evolution is
presented in section 7.
2. Sites description
Tunisia country is located in the North part of Africa (Fig. 1). Its surface is 164.000 km2 with
10 millions inhabitants. Coastal cities share about 500 km of beach and are widely
influenced by the Mediterranean Sea. The four sites presented in this study are
Mediterranean coastal cities with relatively flat terrain.
Bizerte city is located at the North part of Tunisia (37° 16’ N, 9° 52’ E). Its urban area
accounts about 114.000 inhabitants. The measurement station sample is classified as urban
which is mainly influenced by residential, traffic and commercial activities. Tunis City
(capital of Tunisia) is also located in the North part of Tunisia (36° 49’ N, 10° 11’ E). The
urban area (750.000 inhabitants) is about 212.63 km2 surface. The sampling site is classified
as urban, located in the vicinity of one of Tunis’s major traffic Avenues (Bab Saadoun Ave.).
Air Quality250
Sousse city is located at the Eastern central part of Tunisia (35° 49’ N, 10° 38’). The urban
area (200.000 inhabitants) is about 45 km2 surface. The sampling site is urban under the
influence of residential, traffic and commercial activities. The main industrial activities are a
power plant and bricks work.
Finally, Sfax city is located at the south part of Tunisia (34° 44’ N, 10° 46’ E) with 270.000
inhabitants. The sampling site is industrial under the influence of intense chemical
manufacturing activities.
3. Data and methods
It might be highlighted that there is a lack of knowledge in Tunisia on the pollution
concentration, since the national monitoring stations operated by the ANPE (Agence
Nationale de Protection de l’Environnement) is localised in the most urban zones. All
instantaneous concentrations data can be controlled from the central station.
Surface O3 levels were continuously monitored using Environment model 41 M analysers.
The concentrations of NOx (NO and NO2) were measured by using analysers Environment-
AC, Models 31 M.
Other stations use standard NOx (NO & NO2), O3 and SO2 instruments designed by
Teledyne Advanced Pollution Instrumentation Company ().
Data processing techniques and standard methods are described in the analyser instruction
manuals. Used Teledyne models are 200A, 400A and 100A for NOx, O3 and SO2
respectively. Additionally, all stations were equipped with automatic weather monitoring.
A mobile laboratory is used to control pollutants levels in rural and urban sites. These
measured pollutants are harmful both for the human health and the environment: Ozone is
a major photo-oxide product of the atmosphere. It is manifested in the presence of UV
radiation stemming from ozone precursors.
NO2 + UV radiation NO + O and O + O2 O3
Then it is consumed by NO
NO + O3 NO2 + O2
The high levels of ozone give birth to the formation of the Smog phenomena and the green
house effect. The oxidization of NOx and SO2 in the atmosphere stimulates the formation of
aerosols (e.g. H2SO4, HNO3…) which play a crucial role in the production of acid rain and
the climatic and environmental change.
The influence of atmospheric transport scenarios on the levels of Particulate Matters was
investigated by means of back-trajectories analysis using the Hysplit Model
(www.arl.NOAA.gov) and information obtained from TOMS-NASA, NRL aerosol and dust
maps (TOMS, www.jwocky.gsfc.nasa.gov; NRL www.nrlmry.navy.mil. Satellite images are
provided by the NASA SEAWIFS project (www.seawifs.gsfc.nasa.gov).
4. Experimental results
4.1 Seasonal pollutants behavior
Fig. 2, 3, 4 and 5 show time series plots of the main pollutants concentrations (NO, NO2,
NOx, O3, SO2 and PM10) and the local meteorological parameters at selected sites. A
seasonal pattern of variation which completes one cycle per year is observed at all sites. NO,
NO2 and NOx concentrations are lowest in summer (June, July and August) and peaking in
winter (December, January and February). In contrast, O3 concentration shows reversed
tendency of seasonal variation. There is a clear indication of annual trend downward for
NOx (NO and NO2) and SO2. This is may be due to the reduction of vehicle emission with
the renew of the Tunisian vehicular troop during the last decade, the use of refined oil
energies and the application of law decreasing industrial emissions by substituting heavy
fuel for natural gas. Nevertheless there is no indication for annual O3 and PM10 levels
decrease. O3 and PM10 are approximately stationary in their level and point out to the
contribution of additional non local pollution sources during particular weather conditions.
NO, NO2 and NOx concentrations appear to be a common seasonal pattern across the sites.
There is less air mixing in the lower boundary layer during the winter months and this
could lead to elevated levels of this pollutants. Additionally, Derwent et al., (1995) suggest
that high winter concentration of NO2 could be enhanced by reduced photochemical
activity of the reaction in which NO2 and (OH) radicals combine to form nitric acid (HNO3).
The winter highs could also be linked to increase industrial and home heating. The summer
lows might be due to the enhanced photochemical activity on the presence of powerful solar
radiation in which NO2 promotes ozone production.
Differences of concentration between locations can be described in terms of changes in the
average level and the amplitude of the seasonal fluctuation. The main differences seem to be
associated with the type of station (industrial, urban, traffic…) and the proximity to the
main source emissions. The highest average levels (up to 45 ppb) and the larger seasonal
amplitude of NOx concentration occur in Tunis City where the site is located in dense
vehicular activity. The larger average levels (up to 40 ppb) and seasonal amplitude of SO2
appear in Sfax city where the measurement site is situated in the proximity of the industrial
area. During the summer months, the lowest ozone average levels (up to 18 ppb) and the
smallest seasonal amplitudes occur in Tunis City because of elevated levels of NO produced
by exhausted fume of vehicles which deplete ozone concentration.
Simultaneously, the seasonal patterns of the weather variables appear to be much smoother
than those of the pollution concentrations and show both negative and positive correlation
according to pollutants type.
The negative correlation between the seasonal NOx concentrations and those of wind speed
(Fig. 2 and Fig. 5) may suggest the effect of the increased air mixing. The curves show that
weak wind conditions encourage pollutants accumulation over the measurement sites.
Nevertheless, positive correlation between the seasonal O3 and PM10 concentrations and
the meteorological variables (wind speed, temperature and solar radiation) may account for
the meso-scale and long range transport phenomena which promote the increase of these
pollutants concentration. The powerful UV radiation encourages photochemical activity and
helps ozone production. Thus, O3 seasonal pattern consists of a roughly symmetric wave
with summer peaks and winter troughs.
4.2 Summer pollutants variation
Saharan dust outbreaks over the Mediterranean Tunisian coasts represent the second
summer phenomenon which results in a peak PM10 event reaching the highest annual
values (by 200 µg /m3) (Fig. 7) and lower O3 concentration owing to the influence of the
relatively clean Saharan air. It is important to note that by this period the daily average O3
concentration recorded in Sousse city drops to about 30 ppb.
Air quality monitoring in the Mediterranean Tunisian coasts 251
Sousse city is located at the Eastern central part of Tunisia (35° 49’ N, 10° 38’). The urban
area (200.000 inhabitants) is about 45 km2 surface. The sampling site is urban under the
influence of residential, traffic and commercial activities. The main industrial activities are a
power plant and bricks work.
Finally, Sfax city is located at the south part of Tunisia (34° 44’ N, 10° 46’ E) with 270.000
inhabitants. The sampling site is industrial under the influence of intense chemical
manufacturing activities.
3. Data and methods
It might be highlighted that there is a lack of knowledge in Tunisia on the pollution
concentration, since the national monitoring stations operated by the ANPE (Agence
Nationale de Protection de l’Environnement) is localised in the most urban zones. All
instantaneous concentrations data can be controlled from the central station.
Surface O3 levels were continuously monitored using Environment model 41 M analysers.
The concentrations of NOx (NO and NO2) were measured by using analysers Environment-
AC, Models 31 M.
Other stations use standard NOx (NO & NO2), O3 and SO2 instruments designed by
Teledyne Advanced Pollution Instrumentation Company ().
Data processing techniques and standard methods are described in the analyser instruction
manuals. Used Teledyne models are 200A, 400A and 100A for NOx, O3 and SO2
respectively. Additionally, all stations were equipped with automatic weather monitoring.
A mobile laboratory is used to control pollutants levels in rural and urban sites. These
measured pollutants are harmful both for the human health and the environment: Ozone is
a major photo-oxide product of the atmosphere. It is manifested in the presence of UV
radiation stemming from ozone precursors.
NO2 + UV radiation NO + O and O + O2 O3
Then it is consumed by NO
NO + O3 NO2 + O2
The high levels of ozone give birth to the formation of the Smog phenomena and the green
house effect. The oxidization of NOx and SO2 in the atmosphere stimulates the formation of
aerosols (e.g. H2SO4, HNO3…) which play a crucial role in the production of acid rain and
the climatic and environmental change.
The influence of atmospheric transport scenarios on the levels of Particulate Matters was
investigated by means of back-trajectories analysis using the Hysplit Model
(www.arl.NOAA.gov) and information obtained from TOMS-NASA, NRL aerosol and dust
maps (TOMS, www.jwocky.gsfc.nasa.gov; NRL www.nrlmry.navy.mil. Satellite images are
provided by the NASA SEAWIFS project (www.seawifs.gsfc.nasa.gov).
4. Experimental results
4.1 Seasonal pollutants behavior
Fig. 2, 3, 4 and 5 show time series plots of the main pollutants concentrations (NO, NO2,
NOx, O3, SO2 and PM10) and the local meteorological parameters at selected sites. A
seasonal pattern of variation which completes one cycle per year is observed at all sites. NO,
NO2 and NOx concentrations are lowest in summer (June, July and August) and peaking in
winter (December, January and February). In contrast, O3 concentration shows reversed
tendency of seasonal variation. There is a clear indication of annual trend downward for
NOx (NO and NO2) and SO2. This is may be due to the reduction of vehicle emission with
the renew of the Tunisian vehicular troop during the last decade, the use of refined oil
energies and the application of law decreasing industrial emissions by substituting heavy
fuel for natural gas. Nevertheless there is no indication for annual O3 and PM10 levels
decrease. O3 and PM10 are approximately stationary in their level and point out to the
contribution of additional non local pollution sources during particular weather conditions.
NO, NO2 and NOx concentrations appear to be a common seasonal pattern across the sites.
There is less air mixing in the lower boundary layer during the winter months and this
could lead to elevated levels of this pollutants. Additionally, Derwent et al., (1995) suggest
that high winter concentration of NO2 could be enhanced by reduced photochemical
activity of the reaction in which NO2 and (OH) radicals combine to form nitric acid (HNO3).
The winter highs could also be linked to increase industrial and home heating. The summer
lows might be due to the enhanced photochemical activity on the presence of powerful solar
radiation in which NO2 promotes ozone production.
Differences of concentration between locations can be described in terms of changes in the
average level and the amplitude of the seasonal fluctuation. The main differences seem to be
associated with the type of station (industrial, urban, traffic…) and the proximity to the
main source emissions. The highest average levels (up to 45 ppb) and the larger seasonal
amplitude of NOx concentration occur in Tunis City where the site is located in dense
vehicular activity. The larger average levels (up to 40 ppb) and seasonal amplitude of SO2
appear in Sfax city where the measurement site is situated in the proximity of the industrial
area. During the summer months, the lowest ozone average levels (up to 18 ppb) and the
smallest seasonal amplitudes occur in Tunis City because of elevated levels of NO produced
by exhausted fume of vehicles which deplete ozone concentration.
Simultaneously, the seasonal patterns of the weather variables appear to be much smoother
than those of the pollution concentrations and show both negative and positive correlation
according to pollutants type.
The negative correlation between the seasonal NOx concentrations and those of wind speed
(Fig. 2 and Fig. 5) may suggest the effect of the increased air mixing. The curves show that
weak wind conditions encourage pollutants accumulation over the measurement sites.
Nevertheless, positive correlation between the seasonal O3 and PM10 concentrations and
the meteorological variables (wind speed, temperature and solar radiation) may account for
the meso-scale and long range transport phenomena which promote the increase of these
pollutants concentration. The powerful UV radiation encourages photochemical activity and
helps ozone production. Thus, O3 seasonal pattern consists of a roughly symmetric wave
with summer peaks and winter troughs.
4.2 Summer pollutants variation
Saharan dust outbreaks over the Mediterranean Tunisian coasts represent the second
summer phenomenon which results in a peak PM10 event reaching the highest annual
values (by 200 µg /m3) (Fig. 7) and lower O3 concentration owing to the influence of the
relatively clean Saharan air. It is important to note that by this period the daily average O3
concentration recorded in Sousse city drops to about 30 ppb.
Air Quality252
0
2
4
6
8
10
12
14
16
0
5
10
15
20
25
N O 2 p p b
N O p p b
Y e a r
2005 2006 2007
15
20
25
30
35
40
45
50
35
40
45
50
55
60
65
70
75
O 3 p p b
P M 1 0 µ g / m 3
Y e a r
2005 2006 2007
0
1
2
3
4
5
6
7
0
5
10
15
20
25
30
35
40
S O 2 p p b
N O x p p b
Y e a r
2005 2006 2007
0
5
10
15
20
25
30
50
100
150
200
250
300
350
400
T ° C, W m / s
R A w / m 2
Y e a r
2005 2006 2007
Fig. 2. Time series plots of pollutants concentrations (NO, NO2, O3, PM10, SO2 and NOx)
and meteorological parameters (Temperature, Radiation and wind speed) ranging from
September 2005 to August 2007 at Sousse site. Time evolution of the Left y-axis is plotted
with Solid line and the right one is plotted with dashed line.
2
4
6
8
10
12
14
16
0
5
10
15
20
25
30
35
N O 2 p p b
N O p p b
Y e a r
2004 2005 2006 2007
10
20
30
40
50
60
70
80
90
50
60
70
80
90
100
110
120
130
O 3 p p b
P M 1 0 µ g / m 3
Y e a r
2004 2005 2006 2007
Fig. 3. Time series plots of pollutants concentrations (NO, NO2, O3 and PM10) ranging from
January 2004 to August 2007 at Bizerte site. Time evolution of the Left y-axis is plotted with
Solid line and the right one is plotted with dashed line.
5
10
15
20
25
30
35
0
20
40
60
80
100
N O 2 p p b
N O p p b
Y e a r
2004 2005 2006 2007
5
10
15
20
25
30
35
60
70
80
90
100
110
120
130
O 3 p p b
P M 1 0 µ g / m 3
Y e a r
2004 2005 2006 2007
Fig. 4. Time series plots of pollutants concentrations (NO, NO2, O3 and PM10) ranging from
January 2004 to August 2007 at Tunis site. Time evolution of the Left y-axis is plotted with
Solid line and the right one is plotted with dashed line.
0
5
10
15
20
25
0
5
10
15
20
N O 2 p p b
N O p p b
Y e a r
2005 2006 2007
30
40
50
60
70
80
40
60
80
100
120
140
160
O 3 p p b
P M 1 0 µ g / m 3
Y e a r
2005 2006 2007
0
10
20
30
40
50
60
70
5
10
15
20
25
30
35
S O 2 p p b
N O x p p b
Y e a r
2005 2006 2007
0
5
10
15
20
25
30
0
50
100
150
200
T ° C, W m / s
R A w / m 2
Y e a r
2005 2006 2007
Fig. 5. Time series plots of pollutants concentrations (NO, NO2, O3, PM10, SO2 and NOx)
and meteorological parameters (Temperature, Radiation and wind speed) ranging from
September 2005 to August 2007 at Sfax site. Time evolution of the Left y-axis is plotted with
Solid line and the right one is plotted with dashed line.
Meloni et al., 2007 suggest that suspended Saharan air masses due to the mixing occurring
there can reach 2000m altitude in winter season and 4000m in summer and travelling just
above the mixing layer. They pointed out that the air masses loaded with desert dust is
expected to become the main aerosol event when the trajectory interacts with the mixed
layer.
Here, we presented a sampling PM events reaching Sousse city. During the summer period
ranging from 21 June to 24 June 2006, peaks in the PM10 concentrations were reported
(Fig. 7). Satellite observation showed a plume of Saharan dust (Fig. 8a) on 23 June 2006 over
the Eastern Tunisian coast and the western Mediterranean. The back-trajectory air masse of
the same day (Fig. 8b) shows that the air masses reaching the Tunisian costs have a long
Air quality monitoring in the Mediterranean Tunisian coasts 253
0
2
4
6
8
10
12
14
16
0
5
10
15
20
25
N O 2 p p b
N O p p b
Y e a r
2005 2006 2007
15
20
25
30
35
40
45
50
35
40
45
50
55
60
65
70
75
O 3 p p b
P M 1 0 µ g / m 3
Y e a r
2005 2006 2007
0
1
2
3
4
5
6
7
0
5
10
15
20
25
30
35
40
S O 2 p p b
N O x p p b
Y e a r
2005 2006 2007
0
5
10
15
20
25
30
50
100
150
200
250
300
350
400
T ° C, W m / s
R A w / m 2
Y e a r
2005 2006 2007
Fig. 2. Time series plots of pollutants concentrations (NO, NO2, O3, PM10, SO2 and NOx)
and meteorological parameters (Temperature, Radiation and wind speed) ranging from
September 2005 to August 2007 at Sousse site. Time evolution of the Left y-axis is plotted
with Solid line and the right one is plotted with dashed line.
2
4
6
8
10
12
14
16
0
5
10
15
20
25
30
35
N O 2 p p b
N O p p b
Y e a r
2004 2005 2006 2007
10
20
30
40
50
60
70
80
90
50
60
70
80
90
100
110
120
130
O 3 p p b
P M 1 0 µ g / m 3
Y e a r
2004 2005 2006 2007
Fig. 3. Time series plots of pollutants concentrations (NO, NO2, O3 and PM10) ranging from
January 2004 to August 2007 at Bizerte site. Time evolution of the Left y-axis is plotted with
Solid line and the right one is plotted with dashed line.
5
10
15
20
25
30
35
0
20
40
60
80
100
N O 2 p p b
N O p p b
Y e a r
2004 2005 2006 2007
5
10
15
20
25
30
35
60
70
80
90
100
110
120
130
O 3 p p b
P M 1 0 µ g / m 3
Y e a r
2004 2005 2006 2007
Fig. 4. Time series plots of pollutants concentrations (NO, NO2, O3 and PM10) ranging from
January 2004 to August 2007 at Tunis site. Time evolution of the Left y-axis is plotted with
Solid line and the right one is plotted with dashed line.
0
5
10
15
20
25
0
5
10
15
20
N O 2 p p b
N O p p b
Y e a r
2005 2006 2007
30
40
50
60
70
80
40
60
80
100
120
140
160
O 3 p p b
P M 1 0 µ g / m 3
Y e a r
2005 2006 2007
0
10
20
30
40
50
60
70
5
10
15
20
25
30
35
S O 2 p p b
N O x p p b
Y e a r
2005 2006 2007
0
5
10
15
20
25
30
0
50
100
150
200
T ° C, W m / s
R A w / m 2
Y e a r
2005 2006 2007
Fig. 5. Time series plots of pollutants concentrations (NO, NO2, O3, PM10, SO2 and NOx)
and meteorological parameters (Temperature, Radiation and wind speed) ranging from
September 2005 to August 2007 at Sfax site. Time evolution of the Left y-axis is plotted with
Solid line and the right one is plotted with dashed line.
Meloni et al., 2007 suggest that suspended Saharan air masses due to the mixing occurring
there can reach 2000m altitude in winter season and 4000m in summer and travelling just
above the mixing layer. They pointed out that the air masses loaded with desert dust is
expected to become the main aerosol event when the trajectory interacts with the mixed
layer.
Here, we presented a sampling PM events reaching Sousse city. During the summer period
ranging from 21 June to 24 June 2006, peaks in the PM10 concentrations were reported
(Fig. 7). Satellite observation showed a plume of Saharan dust (Fig. 8a) on 23 June 2006 over
the Eastern Tunisian coast and the western Mediterranean. The back-trajectory air masse of
the same day (Fig. 8b) shows that the air masses reaching the Tunisian costs have a long
Air Quality254
range transport origin and the dust outbreaks start from south Algerian Sahara (Fig. 8c). In
these conditions, the PM10 concentration at all sites increase rapidly. For instance, in Sousse
city, the PM10 concentration increases to reach a level about two to three times the summer
one (Fig. 7).
4.3 Winter pollutants variation
A sampling period ranging from 2 January to 5 January 2007 has been selected to study
pollutants evolution during winter season. Fig. 9 displays time series of the meteorological
parameters and pollutants concentration recorded at Sousse city during this period.
NO and NO2 peak is much higher in winter than in summer (up to 60 ppb on 04 January).
In spite of higher traffic in summer than in winter (national statistics have shown that
during the summer season, the vehicle number has doubled in Sousse region due to the
increasing number of visitors.), NO and NO2 higher peak in winter can be explained on the
basis of lower ventilation and lower mixing.
With respect to the NO2, in winter there is less O3 to oxidize the NO emissions and the NO2
peak in the morning is hardly detectable. While by the end of the day, there has been
sufficient build-up of O3 to oxidize some of the NO and a peak is detected during that
period.
The O3 concentrations are much higher in summer (up to 65 ppb) than in winter (up to 35
ppb). During summer, meteorological conditions such as high temperature and thermal
convection often induce the mixing of the air masses and the photochemical reactions.
Observed ozone concentration may be the result of photochemical reaction of primary
pollutants (NOx from traffic). Furthermore, the sea breeze also brings O3 and the total
concentration could result from a combination of local generation and regional transport.
Nevertheless, in winter, the O3 values are limited to lesser photochemical activity and
vertical mixing. With NO emissions in a stabilizing air layer, the nocturnal ozone
concentration decreases rapidly reaching its minimum value (clear during 4 January) due to
the fast reaction between NO and O3 to produce NO2 (This phenomenon requires calm
wind condition to be clearly detected at the measuring site). Simultaneously, NO, NO2, SO2
and PM10 increase to their maximum values showing evidence of low mixing and low
ventilation effect during weak wind condition.
With reference to the data of the National Institute of Meteorology, the data of the NOAA
ARL model and to the air masses trajectories which come over Sousse region (HYSPLIT
Model-Back trajectories) we have identified days during which the sea breeze is evident. In
order to distinguish the sea breeze events, we have associated their development in a
perpendicular wind direction to the coast (50°- 130°).
50
100
150
200
P M 1 0 µ g / m 3
Day
21-06 22-06 23-06 24-06
Fig. 7. Hourly averaged series of PM10 concentrations for the period ranging from 21 June
2006 to 24 June 2006.
(a)
(b) (c)
Fig. 8. (a) Satellite image (b) backward trajectory and (c) Dust map for 23 June 2006.
Air quality monitoring in the Mediterranean Tunisian coasts 255
range transport origin and the dust outbreaks start from south Algerian Sahara (Fig. 8c). In
these conditions, the PM10 concentration at all sites increase rapidly. For instance, in Sousse
city, the PM10 concentration increases to reach a level about two to three times the summer
one (Fig. 7).
4.3 Winter pollutants variation
A sampling period ranging from 2 January to 5 January 2007 has been selected to study
pollutants evolution during winter season. Fig. 9 displays time series of the meteorological
parameters and pollutants concentration recorded at Sousse city during this period.
NO and NO2 peak is much higher in winter than in summer (up to 60 ppb on 04 January).
In spite of higher traffic in summer than in winter (national statistics have shown that
during the summer season, the vehicle number has doubled in Sousse region due to the
increasing number of visitors.), NO and NO2 higher peak in winter can be explained on the
basis of lower ventilation and lower mixing.
With respect to the NO2, in winter there is less O3 to oxidize the NO emissions and the NO2
peak in the morning is hardly detectable. While by the end of the day, there has been
sufficient build-up of O3 to oxidize some of the NO and a peak is detected during that
period.
The O3 concentrations are much higher in summer (up to 65 ppb) than in winter (up to 35
ppb). During summer, meteorological conditions such as high temperature and thermal
convection often induce the mixing of the air masses and the photochemical reactions.
Observed ozone concentration may be the result of photochemical reaction of primary
pollutants (NOx from traffic). Furthermore, the sea breeze also brings O3 and the total
concentration could result from a combination of local generation and regional transport.
Nevertheless, in winter, the O3 values are limited to lesser photochemical activity and
vertical mixing. With NO emissions in a stabilizing air layer, the nocturnal ozone
concentration decreases rapidly reaching its minimum value (clear during 4 January) due to
the fast reaction between NO and O3 to produce NO2 (This phenomenon requires calm
wind condition to be clearly detected at the measuring site). Simultaneously, NO, NO2, SO2
and PM10 increase to their maximum values showing evidence of low mixing and low
ventilation effect during weak wind condition.
With reference to the data of the National Institute of Meteorology, the data of the NOAA
ARL model and to the air masses trajectories which come over Sousse region (HYSPLIT
Model-Back trajectories) we have identified days during which the sea breeze is evident. In
order to distinguish the sea breeze events, we have associated their development in a
perpendicular wind direction to the coast (50°- 130°).
50
100
150
200
P M 1 0 µ g / m 3
Day
21-06 22-06 23-06 24-06
Fig. 7. Hourly averaged series of PM10 concentrations for the period ranging from 21 June
2006 to 24 June 2006.
(a)
(b) (c)
Fig. 8. (a) Satellite image (b) backward trajectory and (c) Dust map for 23 June 2006.
Air Quality256
0
90
180
270
360
1
2
3
4
5
6
7
8
W i n d D i r e c t i o n d e g
W i n d S p e d m / s
D a y
02-01 03-01 04-01 05-01
0
5
10
15
20
25
30
35
0
10
20
30
40
50
60
N O 2 p p b
N O p p b
D a y
02-01 03-01 04-01 05-01
0
1
2
3
4
0
20
40
60
80
100
S O 2 p p b
N O x p p b
D a y
02-01 03-01 04-01 05-01
0
5
10
15
20
25
30
35
0
20
40
60
80
100
O 3 p p b
P M 1 0 µ g / m 3
D a y
02-01 03-01 04-01 05-01
6
8
10
12
14
16
18
20
0
100
200
300
400
500
600
T ° C
R A w / m 2
D a y
02-01 03-01 04-01 05-01
Fig. 9. Hourly averaged series of meteorological parameters and pollutants concentrations
for the period ranging from 2 January 2007 to 5 January 2007.
speed at night. On the synoptic scale, we have chosen anticyclonic situation as well as weak
conditions of pressure gradient. The activation of the breeze varies between 0800 and 1600
Local Time (LT). We have come across two types of sea breeze: the early morning sea breeze
characterized by a setting varying from 0800 LT to 1000 LT. This breeze type represents 35%
(5 cases) of breeze days. The afternoon sea breeze characterized by a launching ranging
between 1200 LT and 1600 LT representing 65% (10 cases) of breeze days. It is important to
note that the sun rise time (ranging from 0500 to 0529 LT during the campaign) and the
diurnal evolution of solar radiation intensity (Fig.8) which controls the setting of sea breeze
remains nearly constant. This result shows that Sousse sea breeze launching doesn’t only
depend on the land sea temperature contrast but also on the direction and speed of the
synoptic wind. Fig.10 illustrates air masses trajectories which reach Sousse region during the
campaign. We distinguish three cases. First, an afternoon sea breeze (Fig.10a) in which we
notice the recirculation of air masses and the switching of wind direction.
Second, early morning sea breeze (Fig.10b) in which we remark the steady South Eastern
wind direction coming from the sea. Third, non-sea breeze (Fig.10c) in which the wind
direction is maintained offshore during the day.
5. Afternoon sea breeze cases
The temporal evolution of the direction and speed of wind relative to afternoon sea breezes
are regrouped in Fig.11.
a
b
c
Fig. 10. Samples of surface air masses trajectories reaching Sousse region. (a) Afternoon sea
breeze cases (b) Early morning sea breeze cases and (c) Non-sea breeze cases (NOAA ARL data).
Air quality monitoring in the Mediterranean Tunisian coasts 257
0
90
180
270
360
1
2
3
4
5
6
7
8
W i n d D i r e c t i o n d e g
W i n d S p e d m / s
D a y
02-01 03-01 04-01 05-01
0
5
10
15
20
25
30
35
0
10
20
30
40
50
60
N O 2 p p b
N O p p b
D a y
02-01 03-01 04-01 05-01
0
1
2
3
4
0
20
40
60
80
100
S O 2 p p b
N O x p p b
D a y
02-01 03-01 04-01 05-01
0
5
10
15
20
25
30
35
0
20
40
60
80
100
O 3 p p b
P M 1 0 µ g / m 3
D a y
02-01 03-01 04-01 05-01
6
8
10
12
14
16
18
20
0
100
200
300
400
500
600
T ° C
R A w / m 2
D a y
02-01 03-01 04-01 05-01
Fig. 9. Hourly averaged series of meteorological parameters and pollutants concentrations
for the period ranging from 2 January 2007 to 5 January 2007.
speed at night. On the synoptic scale, we have chosen anticyclonic situation as well as weak
conditions of pressure gradient. The activation of the breeze varies between 0800 and 1600
Local Time (LT). We have come across two types of sea breeze: the early morning sea breeze
characterized by a setting varying from 0800 LT to 1000 LT. This breeze type represents 35%
(5 cases) of breeze days. The afternoon sea breeze characterized by a launching ranging
between 1200 LT and 1600 LT representing 65% (10 cases) of breeze days. It is important to
note that the sun rise time (ranging from 0500 to 0529 LT during the campaign) and the
diurnal evolution of solar radiation intensity (Fig.8) which controls the setting of sea breeze
remains nearly constant. This result shows that Sousse sea breeze launching doesn’t only
depend on the land sea temperature contrast but also on the direction and speed of the
synoptic wind. Fig.10 illustrates air masses trajectories which reach Sousse region during the
campaign. We distinguish three cases. First, an afternoon sea breeze (Fig.10a) in which we
notice the recirculation of air masses and the switching of wind direction.
Second, early morning sea breeze (Fig.10b) in which we remark the steady South Eastern
wind direction coming from the sea. Third, non-sea breeze (Fig.10c) in which the wind
direction is maintained offshore during the day.
5. Afternoon sea breeze cases
The temporal evolution of the direction and speed of wind relative to afternoon sea breezes
are regrouped in Fig.11.
a
b
c
Fig. 10. Samples of surface air masses trajectories reaching Sousse region. (a) Afternoon sea
breeze cases (b) Early morning sea breeze cases and (c) Non-sea breeze cases (NOAA ARL data).
Air Quality258
The wind direction changes clockwise in a continuous, slow and progressive way starting
from the North and the North West direction. The wind speed rises progressively during
the period 00-1300 LT. It reaches its apogee between 5 and 7 m/s starting from 1300 LT
until the end of the day (about 1900 LT). The maximum of wind speed is synchronized with
the late change of the wind direction. The decrease of wind speed after the sun set points
out to the disappearance of the sea breeze. This is due to the reduction of sea-land
temperature contrast.
6. Early morning sea breeze cases
In order to visualize the early morning sea breeze variation, we have presented on Fig.12,
the wind temporal evolution. In the morning (about 0900 LT), the wind direction switches
about 30° South East vis-à-vis the synoptic wind direction (SSE). The wind progressively
turns anticlockwise until it reaches the sea breeze direction. This rotation associated with a
reinforcement of wind is carried out in such a way as the angle described is weak. We notice
that the wind returns to its original sector (SSE) when the breeze vanishes. In order to
distinguish the different effects which are due to two types of sea breeze, we have to
compare the early morning wind direction and speed to the afternoon ones.
0
9
18
27
36
0 6 12 18 24
Local Time
Wind Direction (1/10 deg)
03 July
04 July
09 July
10 July
15 July
24 July
02 August
04 August
05 August
06 August
0
1
2
3
4
5
6
7
8
0 6 12 18 24
Local Time
Wind Speed m/s
03 July
04 July
09 July
10 July
15 July
24 July
04 August
05 August
06 August
Fig. 11. Temporal variation of wind direction, and wind speed during the afternoon sea
breeze days.
0
9
18
27
36
0 6 12 18 24
Local Time
Wind Direction (1/10 deg)
18 July
19 July
20 July
0
2
4
6
8
10
12
0 6 12 18 24
Local Time
Wind Speed m/s
18 July
19 July
20 July
Fig. 12. Temporal variation of wind direction and wind speed, during the early morning sea
breeze days.
These later curves are manifested in particular a limited late wind maximum (from 5 to 7
m/s). This wind is inferior to that of the morning sea breeze (11 m/s). This speed difference
is attributed to the fact the late sea breeze is opposed by an offshore synoptic wind.
Nevertheless, the onshore synoptic wind which characterizes the setting of the early
morning sea breeze (about 0900 LT), triggers the wind direction change (anticlockwise) and
its strengthening in the morning (11 m/s).
7. Evolution of pollutants concentration
In order to understand the photochemical potential coupled with the sea breeze dynamic
circulations, we have carried out comparisons of ozone concentrations for early morning
and late sea breeze cases vis-à-vis a non sea breeze case (Fig.13). According to these
measurements, the region of Sousse is less polluted without breeze than with breeze. The
temporal evolution of the ozone concentration related to late sea breeze days displays the
ozone concentration reduction during the night which is due to the stability of air masses
and to the decrease of the atmospheric boundary layer height. The polluted air is trapped in
the upper layers (Millan et al., 2002). This thermal cover inhibits the upward and downward
movements. Moreover, in the absence of UV radiation during the night, the ozone
destruction is governed by the following active reaction:
Air quality monitoring in the Mediterranean Tunisian coasts 259
The wind direction changes clockwise in a continuous, slow and progressive way starting
from the North and the North West direction. The wind speed rises progressively during
the period 00-1300 LT. It reaches its apogee between 5 and 7 m/s starting from 1300 LT
until the end of the day (about 1900 LT). The maximum of wind speed is synchronized with
the late change of the wind direction. The decrease of wind speed after the sun set points
out to the disappearance of the sea breeze. This is due to the reduction of sea-land
temperature contrast.
6. Early morning sea breeze cases
In order to visualize the early morning sea breeze variation, we have presented on Fig.12,
the wind temporal evolution. In the morning (about 0900 LT), the wind direction switches
about 30° South East vis-à-vis the synoptic wind direction (SSE). The wind progressively
turns anticlockwise until it reaches the sea breeze direction. This rotation associated with a
reinforcement of wind is carried out in such a way as the angle described is weak. We notice
that the wind returns to its original sector (SSE) when the breeze vanishes. In order to
distinguish the different effects which are due to two types of sea breeze, we have to
compare the early morning wind direction and speed to the afternoon ones.
0
9
18
27
36
0 6 12 18 24
Local Time
Wind Direction (1/10 deg)
03 July
04 July
09 July
10 July
15 July
24 July
02 August
04 August
05 August
06 August
0
1
2
3
4
5
6
7
8
0 6 12 18 24
Local Time
Wind Speed m/s
03 July
04 July
09 July
10 July
15 July
24 July
04 August
05 August
06 August
Fig. 11. Temporal variation of wind direction, and wind speed during the afternoon sea
breeze days.
0
9
18
27
36
0 6 12 18 24
Local Time
Wind Direction (1/10 deg)
18 July
19 July
20 July
0
2
4
6
8
10
12
0 6 12 18 24
Local Time
Wind Speed m/s
18 July
19 July
20 July
Fig. 12. Temporal variation of wind direction and wind speed, during the early morning sea
breeze days.
These later curves are manifested in particular a limited late wind maximum (from 5 to 7
m/s). This wind is inferior to that of the morning sea breeze (11 m/s). This speed difference
is attributed to the fact the late sea breeze is opposed by an offshore synoptic wind.
Nevertheless, the onshore synoptic wind which characterizes the setting of the early
morning sea breeze (about 0900 LT), triggers the wind direction change (anticlockwise) and
its strengthening in the morning (11 m/s).
7. Evolution of pollutants concentration
In order to understand the photochemical potential coupled with the sea breeze dynamic
circulations, we have carried out comparisons of ozone concentrations for early morning
and late sea breeze cases vis-à-vis a non sea breeze case (Fig.13). According to these
measurements, the region of Sousse is less polluted without breeze than with breeze. The
temporal evolution of the ozone concentration related to late sea breeze days displays the
ozone concentration reduction during the night which is due to the stability of air masses
and to the decrease of the atmospheric boundary layer height. The polluted air is trapped in
the upper layers (Millan et al., 2002). This thermal cover inhibits the upward and downward
movements. Moreover, in the absence of UV radiation during the night, the ozone
destruction is governed by the following active reaction:
Air Quality260
NO + O3 NO2 + O2.
Just after the sunrise, the land surface heating gives birth to the appearance of a mixture of
hot and cold air near the land surface and to the progressive increase of the atmospheric
boundary layer height. The upper layers ozone is thus trapped on the surface level (Millan
et al., 2002). This mechanism contributes to the concentration increase of early morning
ozone. Starting from the fresh emissions in the presence of UV radiation, the ozone
production notably intervenes in the early morning ozone concentration. As far as the sea
breeze effects are concerned, their influence on O3 concentration evolution is significant in
the afternoon. It reaches a maximum concentration of 70 ppb and maintains the nocturnal
ozone level. Now let’s focus on the evolution of the pollutants concentration on the surface
related to morning breeze days. As regards, the temporal evolution of the pollutants
concentration, the influence of sea breeze setting is significant. The presence of South-East
sea breeze causes the transport of the electric power plant emissions (orientation South-East
according to our measurement site). This explains the rapid rise in the concentration of O3
up to 50 ppb and of SO2 up to 10 ppb at 0900 LT. Besides, the ozone concentration evolution
indicates the presence of a second ozone maximum in
the afternoon. The origin of this
maximum is attributed to the powerful solar radiation. Now, let’s compare ozone and sulfur
dioxide during the two different breeze cases (Fig.14). The ozone maximum relative to
afternoon sea breeze switches vis-à-vis that of morning breezes. This shift is due to the late
wind direction change and to the relatively moderate wind speed. Contrary to the afternoon
breeze concentration, the early morning SO2 concentration is three times higher. This shows
the pollutant advection stemming from the electric power plant as soon as the wind
direction becomes parallel to direction made by the power plant and measurement site.
During the whole measurement campaign, the evolution of the solar radiation flux is of the
same shape (Fig.15). Knowing that the powerful radiation is a dominant factor controlling
the ozone production, the photochemical potential is not the unique factor responsible for
the concentrations difference between the days of breeze. The late wind direction change,
the relatively weak wind speed and the air masses recirculation highlight the afternoon
ozone maximum. In fact, the ozone and its precursors are advected on the Mediterranean
Sea via the nocturnal offshore synoptic wind just to return after the sea breeze setting.
The offshore synoptic wind opposes the sea breeze penetration causing the formation of an
accumulation over the Mediterranean Sea. The ozone is far from the NO fresh emissions and
thus can be saved. The ozone destruction mechanism is 3 to 7 times less rapid on the sea
than in the land [Nester, 1995]. Due to the sea breeze setting, the ozone and its precursors
return to joint the fresh emissions of Sousse region. This mechanism favours the appearance
of an ozone maximum in the afternoon. The relatively weak wind traps the pollutants and
promotes the photochemical production of ozone in the presence of intense solar radiation.
20
25
30
35
40
45
50
55
0 6 12 18 24
Local Time
O3 concentration (ppb)
18 July
19 July
20 July
13 July
Early breezes
No breeze
0
10
20
30
40
50
60
70
80
0 6 12 18 24
Local Time
O3 concentration (ppb)
03 July
04 July
09 July
10 July
15 July
24 July
04 August
05 August
06 August
13 July
Late breezes
No breeze
Fig.13. Comparison of the temporal evolution of pollutants concentration related to early
morning sea breeze cases and the afternoon sea breeze cases vis-à-vis non-sea breeze cases
Fig. 14. Comparison of pollutants concentrations related to afternoon and early morning sea
breezes. (Solid lines are afternoon sea breeze curve).
0
100
200
300
400
500
600
700
800
0 6 12 18 24
Local Time
Radiation Flux w/m2
Late breezes
Earl
y
breezes
No breezes
Fig. 15. Temporal variation of solar radiation flux at Sousse region (NOAA ARL data).
0
1
2
3
4
5
6
7
8
9
10
11
0 6 12 18 24
Local Time
SO2 concentration (ppb)
15 July
13 July
10 July
26 July
18 July
19 July
No breeze
Late Breeze
Early Breeze
0
10
20
30
40
50
60
70
80
0 6 12 18 24
Local Time
O3 concentration ppb
09 July 2004
15 July 2004
24 July 2004
18 July 2004
19 July 2004
Air quality monitoring in the Mediterranean Tunisian coasts 261
NO + O3 NO2 + O2.
Just after the sunrise, the land surface heating gives birth to the appearance of a mixture of
hot and cold air near the land surface and to the progressive increase of the atmospheric
boundary layer height. The upper layers ozone is thus trapped on the surface level (Millan
et al., 2002). This mechanism contributes to the concentration increase of early morning
ozone. Starting from the fresh emissions in the presence of UV radiation, the ozone
production notably intervenes in the early morning ozone concentration. As far as the sea
breeze effects are concerned, their influence on O3 concentration evolution is significant in
the afternoon. It reaches a maximum concentration of 70 ppb and maintains the nocturnal
ozone level. Now let’s focus on the evolution of the pollutants concentration on the surface
related to morning breeze days. As regards, the temporal evolution of the pollutants
concentration, the influence of sea breeze setting is significant. The presence of South-East
sea breeze causes the transport of the electric power plant emissions (orientation South-East
according to our measurement site). This explains the rapid rise in the concentration of O3
up to 50 ppb and of SO2 up to 10 ppb at 0900 LT. Besides, the ozone concentration evolution
indicates the presence of a second ozone maximum in
the afternoon. The origin of this
maximum is attributed to the powerful solar radiation. Now, let’s compare ozone and sulfur
dioxide during the two different breeze cases (Fig.14). The ozone maximum relative to
afternoon sea breeze switches vis-à-vis that of morning breezes. This shift is due to the late
wind direction change and to the relatively moderate wind speed. Contrary to the afternoon
breeze concentration, the early morning SO2 concentration is three times higher. This shows
the pollutant advection stemming from the electric power plant as soon as the wind
direction becomes parallel to direction made by the power plant and measurement site.
During the whole measurement campaign, the evolution of the solar radiation flux is of the
same shape (Fig.15). Knowing that the powerful radiation is a dominant factor controlling
the ozone production, the photochemical potential is not the unique factor responsible for
the concentrations difference between the days of breeze. The late wind direction change,
the relatively weak wind speed and the air masses recirculation highlight the afternoon
ozone maximum. In fact, the ozone and its precursors are advected on the Mediterranean
Sea via the nocturnal offshore synoptic wind just to return after the sea breeze setting.
The offshore synoptic wind opposes the sea breeze penetration causing the formation of an
accumulation over the Mediterranean Sea. The ozone is far from the NO fresh emissions and
thus can be saved. The ozone destruction mechanism is 3 to 7 times less rapid on the sea
than in the land [Nester, 1995]. Due to the sea breeze setting, the ozone and its precursors
return to joint the fresh emissions of Sousse region. This mechanism favours the appearance
of an ozone maximum in the afternoon. The relatively weak wind traps the pollutants and
promotes the photochemical production of ozone in the presence of intense solar radiation.
20
25
30
35
40
45
50
55
0 6 12 18 24
Local Time
O3 concentration (ppb)
18 July
19 July
20 July
13 July
Early breezes
No breeze
0
10
20
30
40
50
60
70
80
0 6 12 18 24
Local Time
O3 concentration (ppb)
03 July
04 July
09 July
10 July
15 July
24 July
04 August
05 August
06 August
13 July
Late breezes
No breeze
Fig.13. Comparison of the temporal evolution of pollutants concentration related to early
morning sea breeze cases and the afternoon sea breeze cases vis-à-vis non-sea breeze cases
Fig. 14. Comparison of pollutants concentrations related to afternoon and early morning sea
breezes. (Solid lines are afternoon sea breeze curve).
0
100
200
300
400
500
600
700
800
0 6 12 18 24
Local Time
Radiation Flux w/m2
Late breezes
Earl
y
breezes
No breezes
Fig. 15. Temporal variation of solar radiation flux at Sousse region (NOAA ARL data).
0
1
2
3
4
5
6
7
8
9
10
11
0 6 12 18 24
Local Time
SO2 concentration (ppb)
15 July
13 July
10 July
26 July
18 July
19 July
No breeze
Late Breeze
Early Breeze
0
10
20
30
40
50
60
70
80
0 6 12 18 24
Local Time
O3 concentration ppb
09 July 2004
15 July 2004
24 July 2004
18 July 2004
19 July 2004
Air Quality262
8. Conclusion
In this study we have shown that pollutants concentration behaviour depends on the
influence of local, meso-scale and long ranges transport phenomenon.
During summer, Ozone concentration reaches its maximum values under the influence of
land-sea breeze recirculation and powerful photochemical activity. Saharan dust outbreaks
promote PM10 events over the Tunisian coastal sites. This phenomenon was shown to be
linked to lower O3 concentration due to the influence of the relatively clean Saharan air.
In winter season, the O3 values are limited to lesser photochemical activity and vertical
mixing. Primary pollutants peaks were much higher in winter than in summer which can be
explained on the basis of lower ventilation in the winter and lower mixing.
In this paper, we point out that the Saharan dust outbreaks are expected to be an important
natural event influencing Tunisian regions and so needs to be more detailed. To improve
our understanding about this event and related synoptic phenomena on the Tunisian air
quality, we planned to intensify our measurement campaign and to identify pollution
episodes which underline the Tunisian pollutants concentrations.
9. References
Alastuey, A.; X., Querol, S., Castillo, M., Escudero, A., Avila, E., Cuevas, C., Torres, P- M.,
Romero, F., Exposito, O., García, J., Pedro Diaz, R., Van Dingenen, J-P. Putaud.
(2005). Characterisation of TSP and PM2.5 at Izaña and Sta. Cruz de Tenerife
(Canary Islands, Spain) during a Saharan Dust Episode (July 2002). Atmospheric
Environment. 39, 26. 4715-4728.
Baumgardner D., Raga G.B., Grutter M., Lammel G., Evolution of anthropogenic aerosols in
the coastal town of Salina Cruz, Mexico: Part I particle dynamics and land–sea
interactions, Science of the Total Environment, Vol.367, No.1, 2006, pp. 288-301.
Bouchlaghem K., Ben Mansour F., Elouragini S., Impact of a sea breeze event on air
pollution at the Eastern Tunisian coast, Atmospheric Research, Vol.86, 2007, pp.
162-172.
Derwent, R.G., D.R., Middleton, M.E., Goldstone, J.N., Lester, R., Perry. (1995). Analysis and
interpretation of air quality data from an urban roadside location in central London
over the period from July 1991 to July 1992. Atmospheric Environment. 29, 923-946.
Ding A., Wang T., Zhao M., Wang T., Li Z., Simulation of sea land breezes and a discussion
of their implications on the transport of air pollution during a multi-day ozone
episode in the Pearl River Delta of China, Atmospheric Environment, Vol.38, 2004,
pp. 6737-6750. Evtyugina M.G., Pio T.N.C., Costa C.S., Photochemical pollution
under sea breeze conditions, during summer, at the Portuguese West
Coast, atmosp
heric Environment, Vol.40, No.33, 2006, pp. 6277-6293.
Flocas H.A., Assimakopoulos V.D., Helmis C.G., An experimental study of aerosol
distribution over a Mediterranean urban area, Science of The Total Environment,
Vol.367, No.2-3, 2006, pp. 872-887.
Gangoiti, G., M. M., Millán, R., Salvador, E., Mantilla. (2001). Long-range transport and re-
circulation of pollutants in the western Mediterranean during the project Regional
Cycles of Air Pollution in the West-Central Mediterranean Area. Atmospheric
Environment. 35, 36. 6267-6276.
Gangoiti, G., L., Alonso, M., Navazo, A., Albizuri, G., Perez-Landa, M., Matabuena, V.,
Valdenebro, M., Maruri, J.A., García, M.M., Millán, (2002). Regional transport of
pollutants over the Bay of Biscay: analysis of an ozone episode under a blocking
anticyclone in west-central Europe. Atmospheric Environment. 36, 8. 1349-1361.
Helena Flocas, A., D., Vasiliki, C., Assimakopoulos, G., Helmis, (2006). An experimental
study of aerosol distribution over a Mediterranean urban area. Science of The Total
Environment. 367, 2-3. 872-887.
Kassomenos, P.A., H.A., Flocas, S., Lykoudis, A., Skouloudis, (1998). Spatial and temporal
characteristics of the relationship between air quality status and mesoscale
circulation over an urban Mediterranean basin. The Science of The Total
Environment. 217, 1-2. 37-57.
Lim J-H., Sabin L.D., Schiff K.C., Stolzenbach K.D., Concentration, size distribution, and dry
deposition rate of particle-associated metals in the Los Angeles region,
Atmospheric Environment, Vol.40, No. 40, 2006, pp. 7810-7823.
Liu K.Y., Wang Z., Hsiao L.F., A modeling of a sea breeze and its impact on ozone
distribution in northern Taiwan, Environmental Modelling and Software, Vol.17,
2002, pp. 21-27.
Luhar A.K., Hurley P.J., Application of a prognostic model TAPM to sea breeze flows,
surface concentrations and fumigating plumes, Environmental Modelling and
Software, Vol.19, 2004, pp. 591-601.
Lyamani, H., F.J., Olmo, L., Alados-Arboledas, (2005). Saharan dust outbreak over
southeastern Spain as detected by sun photometer. Atmospheric Environment, 39,
38. 7276-7284.
Ma Y., Lyons T.J., Recirculation of coastal urban air pollution under a synoptic scale thermal
through in Perth, Western Australia, Atmospheric Environment, Vol.37, 2003, pp.
443-454.
Marmer, E., B., Langmann, (2005). Impact of ship emissions on the Mediterranean
summertime pollution and climate: A regional model study. Atmospheric
Environment. 39, 26. 4659-4669.
Martín, M., J., Plaza, M. D., Andrés, J. C. Bezares, M.M., Millán, (1991). Comparative study
of seasonal air pollutant behavior in a Mediterranean coastal site: Castellón (Spain)
Atmospheric Environment. 25, 8. 1523-1535.
Meloni, D., A., Di Sarra, G., Biavati, J.J., De Luisi, F., Monteleone, G., Pace, S., Piacentino,
D.M., Sferlazzo, (2007). Seasonal behavior of Saharan dust events at the
Mediterranean island of Lampedusa in the Period 1999-2005. Atmospheric
Environment. 41. 3041-3056.
Millán, M.M., R., Salvador, E., Mantilla, B., Artnano, (1996). Meteorology and photochemical
air pollution in Southern Europe: Experimental results from EC research projects.
Atmospheric Environment, 30, 12. 1909-1924.
Millan, M.M., M.J., Sanz, R., Salvador, E., Mantilla, (2002). Atmospheric dynamics and ozone
cycles related to nitrogen deposition in the Western Mediterranean. Environmental
Pollution. 118, 167-186.
Millan M.M., Sanz M.J., Salvador R., Mantilla E., Atmospheric dynamics and ozone cycles
related to nitrogen deposition in the Western Mediterranean, Environmental
Pollution, Vol.118, 2002, pp. 167-186.
Air quality monitoring in the Mediterranean Tunisian coasts 263
8. Conclusion
In this study we have shown that pollutants concentration behaviour depends on the
influence of local, meso-scale and long ranges transport phenomenon.
During summer, Ozone concentration reaches its maximum values under the influence of
land-sea breeze recirculation and powerful photochemical activity. Saharan dust outbreaks
promote PM10 events over the Tunisian coastal sites. This phenomenon was shown to be
linked to lower O3 concentration due to the influence of the relatively clean Saharan air.
In winter season, the O3 values are limited to lesser photochemical activity and vertical
mixing. Primary pollutants peaks were much higher in winter than in summer which can be
explained on the basis of lower ventilation in the winter and lower mixing.
In this paper, we point out that the Saharan dust outbreaks are expected to be an important
natural event influencing Tunisian regions and so needs to be more detailed. To improve
our understanding about this event and related synoptic phenomena on the Tunisian air
quality, we planned to intensify our measurement campaign and to identify pollution
episodes which underline the Tunisian pollutants concentrations.
9. References
Alastuey, A.; X., Querol, S., Castillo, M., Escudero, A., Avila, E., Cuevas, C., Torres, P- M.,
Romero, F., Exposito, O., García, J., Pedro Diaz, R., Van Dingenen, J-P. Putaud.
(2005). Characterisation of TSP and PM2.5 at Izaña and Sta. Cruz de Tenerife
(Canary Islands, Spain) during a Saharan Dust Episode (July 2002). Atmospheric
Environment. 39, 26. 4715-4728.
Baumgardner D., Raga G.B., Grutter M., Lammel G., Evolution of anthropogenic aerosols in
the coastal town of Salina Cruz, Mexico: Part I particle dynamics and land–sea
interactions, Science of the Total Environment, Vol.367, No.1, 2006, pp. 288-301.
Bouchlaghem K., Ben Mansour F., Elouragini S., Impact of a sea breeze event on air
pollution at the Eastern Tunisian coast, Atmospheric Research, Vol.86, 2007, pp.
162-172.
Derwent, R.G., D.R., Middleton, M.E., Goldstone, J.N., Lester, R., Perry. (1995). Analysis and
interpretation of air quality data from an urban roadside location in central London
over the period from July 1991 to July 1992. Atmospheric Environment. 29, 923-946.
Ding A., Wang T., Zhao M., Wang T., Li Z., Simulation of sea land breezes and a discussion
of their implications on the transport of air pollution during a multi-day ozone
episode in the Pearl River Delta of China, Atmospheric Environment, Vol.38, 2004,
pp. 6737-6750. Evtyugina M.G., Pio T.N.C., Costa C.S., Photochemical pollution
under sea breeze conditions, during summer, at the Portuguese West
Coast, atmosp
heric Environment, Vol.40, No.33, 2006, pp. 6277-6293.
Flocas H.A., Assimakopoulos V.D., Helmis C.G., An experimental study of aerosol
distribution over a Mediterranean urban area, Science of The Total Environment,
Vol.367, No.2-3, 2006, pp. 872-887.
Gangoiti, G., M. M., Millán, R., Salvador, E., Mantilla. (2001). Long-range transport and re-
circulation of pollutants in the western Mediterranean during the project Regional
Cycles of Air Pollution in the West-Central Mediterranean Area. Atmospheric
Environment. 35, 36. 6267-6276.
Gangoiti, G., L., Alonso, M., Navazo, A., Albizuri, G., Perez-Landa, M., Matabuena, V.,
Valdenebro, M., Maruri, J.A., García, M.M., Millán, (2002). Regional transport of
pollutants over the Bay of Biscay: analysis of an ozone episode under a blocking
anticyclone in west-central Europe. Atmospheric Environment. 36, 8. 1349-1361.
Helena Flocas, A., D., Vasiliki, C., Assimakopoulos, G., Helmis, (2006). An experimental
study of aerosol distribution over a Mediterranean urban area. Science of The Total
Environment. 367, 2-3. 872-887.
Kassomenos, P.A., H.A., Flocas, S., Lykoudis, A., Skouloudis, (1998). Spatial and temporal
characteristics of the relationship between air quality status and mesoscale
circulation over an urban Mediterranean basin. The Science of The Total
Environment. 217, 1-2. 37-57.
Lim J-H., Sabin L.D., Schiff K.C., Stolzenbach K.D., Concentration, size distribution, and dry
deposition rate of particle-associated metals in the Los Angeles region,
Atmospheric Environment, Vol.40, No. 40, 2006, pp. 7810-7823.
Liu K.Y., Wang Z., Hsiao L.F., A modeling of a sea breeze and its impact on ozone
distribution in northern Taiwan, Environmental Modelling and Software, Vol.17,
2002, pp. 21-27.
Luhar A.K., Hurley P.J., Application of a prognostic model TAPM to sea breeze flows,
surface concentrations and fumigating plumes, Environmental Modelling and
Software, Vol.19, 2004, pp. 591-601.
Lyamani, H., F.J., Olmo, L., Alados-Arboledas, (2005). Saharan dust outbreak over
southeastern Spain as detected by sun photometer. Atmospheric Environment, 39,
38. 7276-7284.
Ma Y., Lyons T.J., Recirculation of coastal urban air pollution under a synoptic scale thermal
through in Perth, Western Australia, Atmospheric Environment, Vol.37, 2003, pp.
443-454.
Marmer, E., B., Langmann, (2005). Impact of ship emissions on the Mediterranean
summertime pollution and climate: A regional model study. Atmospheric
Environment. 39, 26. 4659-4669.
Martín, M., J., Plaza, M. D., Andrés, J. C. Bezares, M.M., Millán, (1991). Comparative study
of seasonal air pollutant behavior in a Mediterranean coastal site: Castellón (Spain)
Atmospheric Environment. 25, 8. 1523-1535.
Meloni, D., A., Di Sarra, G., Biavati, J.J., De Luisi, F., Monteleone, G., Pace, S., Piacentino,
D.M., Sferlazzo, (2007). Seasonal behavior of Saharan dust events at the
Mediterranean island of Lampedusa in the Period 1999-2005. Atmospheric
Environment. 41. 3041-3056.
Millán, M.M., R., Salvador, E., Mantilla, B., Artnano, (1996). Meteorology and photochemical
air pollution in Southern Europe: Experimental results from EC research projects.
Atmospheric Environment, 30, 12. 1909-1924.
Millan, M.M., M.J., Sanz, R., Salvador, E., Mantilla, (2002). Atmospheric dynamics and ozone
cycles related to nitrogen deposition in the Western Mediterranean. Environmental
Pollution. 118, 167-186.
Millan M.M., Sanz M.J., Salvador R., Mantilla E., Atmospheric dynamics and ozone cycles
related to nitrogen deposition in the Western Mediterranean, Environmental
Pollution, Vol.118, 2002, pp. 167-186.
Air Quality264
Nair P.R., Chand D., Lal S., Modh K.S, Naja M., Parameswaran K., Ravindran S.,
Venkataramani S., Temporal variations in surface ozone at Thumba (8.6N, 77E)
a tropical coastal site in India, Atmospheric Environment, Vol.36, 2002, pp. 603-610.
Nester K., Influence of sea breeze flows on air pollution over the ATTIKA PENINSULA,
Atmospheric Environment, Vol.29, No.24, 1995, pp. 3655-3670.
Puygrenier, V., F., Lohou, B., Campistron, F., Saùd, G., Pigeon, B., Bộnech, D., Serỗa, (2005).
Investigation on the fine structure of sea-breeze during ESCOMPTE experiment.
Atmospheric Research. 74, 1-4, 329-353.
Pộrez, C., M., Sicard, O., Jorba, A., Comerún, J.M., Josộ, M., Baldasano, (2004). Summertime
re-circulations of air pollutants over the north-eastern Iberian coast observed from
systematic EARLINET lidar measurements in Barcelona. Atmospheric
Environment. 38, 24. 3983-4000.
Rodrớguez, S., X., Querol, A., Alastuey, E., Mantilla, (2002). Origin of high summer PM10
and TSP concentrations at rural sites in Eastern Spain. Atmospheric Environment.
36, 19. 3101-3112.
Rodrớguez, S., X., Querol, A., Alastuey, M-M. Viana, M., Alarcún, E., Mantilla, C.R., Ruiz
(2004). Comparative PM10PM2.5 source contribution study at rural, urban and
industrial sites during PM episodes in Eastern Spain. Science of The Total
Environment. 328, 1-3. 95-113.
Simpson J.E., Sea breeze and local wind, Cambridge University, 1994.
Simpson, J.E., D.A., Mansfield, J.R. Milford, (1977). Inland penetration of sea breeze fronts.
Quarterly .Journal of the Royal Meteorological Society. 103, 47-76.
Simon, V., L., Dumergues, J-L. Ponche, L.Torres, (2006). The biogenic volatile organic
compounds emission inventory in France: Application to plant ecosystems in the
Berre-Marseilles area (France). Science of The Total Environment. 372, 1. 164-182.
Srinivas C.V., Venkatesan R., Bagavath Singh A., Sensitivity of mesoscale simulations of
landsea breeze to boundary layer turbulence parameterization, Atmospheric
Environment, Vol.41, No.12, 2007, pp. 2534-2548.
Viana, M., X., Querol, A., Alastuey, E., Cuevas, S., (2002). Rodrớguez, Influence of African
dust on the levels of atmospheric particulates in the Canary Islands air quality
network. Atmospheric Environment. 36, 38. 5861-5875.
Viana, M., X., Querol, A., Alastuey, G., Gangoiti, M., Menộndez, (2003). PM levels in the
Basque Country (Northern Spain): analysis of a 5-year data record and
interpretation of seasonal variations. Atmospheric Environment. 37, 21. 2879-2891.
Viana, M., X., Querol, T., Gửtschi, A., Alastuey, J., Sunyer, B., Forsberg, J., Heinrich, D.,
Norbọck, F., Payo, J. A. Maldonado, N. Kỹnzli, (2007). Source apportionment of
ambient PM2.5 at five spanish centres of the european community respiratory
health survey (ECRHS II). Atmospheric Environment. 41, 7. 1395-1406.
Viana, M., C., Pộrez, X., Querol, A., Alastuey, S., Nickovic, J. M. Baldasano, (2005). Spatial
and temporal variability of PM levels and composition in a complex summer
atmospheric scenario in Barcelona (NE Spain). Atmospheric Environment. 39, 29.
5343-5361.
Ziomas, I.C., (1998). The Mediterranean campaign of photochemical tracers transport and
chemical evolution (MEDCAPHOT-TRACE): an outline. Atmospheric Environment.
32, 12. 2045-2053.
Secondary organic aerosol formation from
the oxidation of a mixture of organic gases in a chamber 265
Secondary organic aerosol formation from the oxidation of a mixture of
organic gases in a chamber
Marta G. Vivanco and Manuel Santiago
X
Secondary organic aerosol formation
from the oxidation of a mixture
of organic gases in a chamber
Marta G. Vivanco and Manuel Santiago
CIEMAT
Spain
1. Introduction
Particles suspended in the air can constitute a potential risk for human health and
ecosystems (Pope and Dockery, 2006), specially the finest fraction. Although PM10 (particles
with a maximum diameter of 10 m) have been included in European directives for a longer
time (Directive 1999/30/EC) air quality objectives for finer particles have been just very
recently established. For particles with a mean diameter lower than 2.5 m (PM2.5) the UE
Directive 2008/50/EC has set a 25 m/m
3
threshold for the annual mean concentration.
Although the term aerosol includes the particles and the gas in which they are suspended,
commonly both terms, particles and aerosols, refer to particles in the atmosphere. A variety
of inorganic and organic chemical compounds can be present in the particulate phase. The
organic fraction can account for a 20 - 90 % of the finest fraction, according to some authors,
such as (Kanakidou et al., 2005) and, therefore, the knowledge of this fraction is important to
prevent human health risks. Both inorganic and organic aerosols can be directly emitted
(primary aerosols) or can be formed in the atmosphere as a consequence of multiple
physical and chemical processes (secondary aerosols). The presence of secondary organic
aerosols (SOA) is specially relevant in urban areas (Zhang et al., 2007).
SOA is mainly produced from the oxidation of volatile organic compounds (VOCs), whose
products present a sufficiently low volatility to partition into the particle phase according to
the gas-particle partitioning theory (Odum et al., 1996) and then nucleate and grow to form
organic particles. Presently, SOA is thought to be mainly constituted by polymers, formed
through particle phase heterogeneous reactions (Kalberer et al., 2004). Other main
components include organic nitrates, such as peroxynitrates and peroxyacylnitrates
(Camredon et al., 2007; Kroll and Seinfeld, 2008), and carboxylic acids (Barsanti and
Pankow, 2006). In spite of the fact that SOA formation has been the focus of many recent
studies, some aspects continue to be not well understood. Simulation chambers represent an
ideal vehicle to evaluate SOA formation potential by emitting selected VOCs in the presence
of an oxidant under controlled conditions. Many studies in chambers have contributed to
increase the knowledge of the oxidation processes of individual organic gases or simple
mixes of them. VOCs related to anthropogenic emissions, such as substituted aromatics
12
Air Quality266
(trimethylbenzenes, xylenes and toluene) and alkanes contained in gasolines, are potential
SOA precursors in city areas, and they have been thoroughly studied in chamber
experiments. Also VOCs related to biogenic emissions, such as isoprene and terpenes
(limonene and pinenes) have been widely studied in chambers, as their contribution to
global SOA formation is notorious (Claeys et al., 2004; Kleindienst et al., 2006; Leungsakul et
al., 2005). OH-initiated is the most common oxidation pathway (Healy et al., 2008; Hu et al.,
2007; Lim and Ziemann, 2005; Song et al., 2005; Weitkamp et al., 2007) and thus most of the
studies in chambers have been focused on the reaction of the previously mentioned VOCs
with this radical.
Recent publications suggest, however, that more complex VOCs mixtures should be used in
chamber experiments in order to achieve a more realistic picture of the oxidative processes
taking place in real polluted atmospheres (Hallquist et al., 2009). In this chapter SOA
formation from a mixture of 1,3,5-TMB (1,3,5-trimethylbenzene), toluene, o-xylene and
octane in the presence of an oxidant (nitrous acid, HONO) is evaluated at a 20% of relative
humidity. For this purpose, a comprehensive gas phase chemistry and aerosol
characterization is presented.
2. Experimental
The experiment was carried out in the EUPHORE facility located in CEAM (Valencia, Spain), a
half-spherical Teflon outdoor chamber that allows the transmission of more than 80% of
sunlight. Figure 1 illustrates de chamber when it is closed (left side of the picture), when it is
being opened (central picture) and opened to sunlight (right side of the figure). The EUPHORE
facility has been described in detail somewhere else (Becker, 1996; Volkamer et al., 2001).
Fig. 1. EUPHORE Photoreactor: closed (left side of the figure), while opening (middle of the
figure), and opened to sunlight (right side of the figure).
Several analytical equipments provided information of some physical variables
(temperature, radiation, humidity, pressure) and chemical concentration of many inorganic
and organic gas compounds. Multiple measurement techniques, such as Gas
Chromatography coupled with Mass Spectrometer (GC-MS), Fourier Transform Infrared
Spectrometry (FTIR), High Pressure Liquid Chromatography (HPLC), Gas Chromatography
(GC-ECD and GC-FID/PID), Absorptive Sampling Solid Phase Microextraction (SPME)
were used to monitor the gas concentration of reactants and products.
Regarding the particle phase, aerosol concentration was monitored in an on-line way with a
TEOM (Tappered Element Oscillating Monitor) and a SMPS (Scanning Mobility Particle Sizer).
This latter provides also information about the diameter particle distribution by classifying the
aerosol particles by their electrical mobility. Also, three low volume samplings were taken
during the experiment and one high volume once the chamber was closed, in order to analyze
aerosol composition via gas chromatography and ion chromatography.
The experiment described in this chapter was performed on June, 17th, 2008, as a part of the
campaign performed by the authors in 2008 described in recent publications
(Vivanco et al., 2010). Experimental conditions are summarized in Table 1. A mixture of
volatile organic compounds and HONO was introduced into the chamber.
Time
Concentration (ppb)
Parents VOCs intro 7:11 1,3,5-TMB 151
HONO introduction 8:01 Toluene 99
Water introduction 8:48 o-xylene 17
Opening 10:33 Octane 80
Closure 15:23 HONO 98
Relative Humidity
20%
Table 1. Experimental conditions
After the parent VOCs the oxidant was introduced. Also, humidity conditions were prepared by
introducing pulverized water into the chamber. Then, the chamber was opened to the sunlight.
3. Gas phase chemistry of the parent VOCs
In this section, a study about the atmospheric photochemical reactions is done, focusing on
the oxidation pathways of the parent VOCs. These pathways consist in multiple oxidation
steps which lead to the formation of multiple compounds. A very useful source of
knowledge for atmospheric oxidation pathways is the Master Chemical Mechansim,
developed by the University of Leeds (Jenkin et al., 2003; Saunders et al., 2002). The latest
version of this mechanism, MCM v3.1 (Bloss et al., 2005), takes into account most of the
kinetic and mechanistic data avaliable to date.
The atmospheric oxidation of a certain compound is conditioned by its own structure and
by the nature of the initial oxidant. Nitrous acid (HONO) was used as the oxidant
compound and therefore, the major initial oxidant is the OH radical, formed by HONO
photolysis. The reaction of the aromatic VOCs emitted in this experiment with the OH
radical have been previously studied by several authors (Atkinson and Arey, 2003; Bloss et
al., 2005; Hamilton et al., 2005; Huang et al., 2006; Johnson et al., 2004; Wagner et al., 2002).
Two main reaction pathways can be identified in the oxidation of toluene, o-xylene or 1,3,5-
TMB with OH: H-abstraction and OH-addition. The H-abstraction is considered as the
minor route and leads to the formation of aromatic aldehydes. The OH-addition can occur
in three differet ways: through the phenolic, the epoxy-oxy and the peroxy-bicyclic routes.
The phenolic and epoxy-oxy routes lead to the formation of phenolic and epoxyde
compounds respectively, while the peroxy-bicyclic route produces the opening of the
aromatic rings and the formation of oxygenated products, which may lead to the formation
of SOA if their volatility is low enough. This last route is considered as the major oxidation
pathway according to the reactions included in the MCM v.3.1. A scheme of the oxidation
pathways for toluene, o-xylene and 1,3,5-TMB is presented in figures 2a, 2b and 2c.
Secondary organic aerosol formation from
the oxidation of a mixture of organic gases in a chamber 267
(trimethylbenzenes, xylenes and toluene) and alkanes contained in gasolines, are potential
SOA precursors in city areas, and they have been thoroughly studied in chamber
experiments. Also VOCs related to biogenic emissions, such as isoprene and terpenes
(limonene and pinenes) have been widely studied in chambers, as their contribution to
global SOA formation is notorious (Claeys et al., 2004; Kleindienst et al., 2006; Leungsakul et
al., 2005). OH-initiated is the most common oxidation pathway (Healy et al., 2008; Hu et al.,
2007; Lim and Ziemann, 2005; Song et al., 2005; Weitkamp et al., 2007) and thus most of the
studies in chambers have been focused on the reaction of the previously mentioned VOCs
with this radical.
Recent publications suggest, however, that more complex VOCs mixtures should be used in
chamber experiments in order to achieve a more realistic picture of the oxidative processes
taking place in real polluted atmospheres (Hallquist et al., 2009). In this chapter SOA
formation from a mixture of 1,3,5-TMB (1,3,5-trimethylbenzene), toluene, o-xylene and
octane in the presence of an oxidant (nitrous acid, HONO) is evaluated at a 20% of relative
humidity. For this purpose, a comprehensive gas phase chemistry and aerosol
characterization is presented.
2. Experimental
The experiment was carried out in the EUPHORE facility located in CEAM (Valencia, Spain), a
half-spherical Teflon outdoor chamber that allows the transmission of more than 80% of
sunlight. Figure 1 illustrates de chamber when it is closed (left side of the picture), when it is
being opened (central picture) and opened to sunlight (right side of the figure). The EUPHORE
facility has been described in detail somewhere else (Becker, 1996; Volkamer et al., 2001).
Fig. 1. EUPHORE Photoreactor: closed (left side of the figure), while opening (middle of the
figure), and opened to sunlight (right side of the figure).
Several analytical equipments provided information of some physical variables
(temperature, radiation, humidity, pressure) and chemical concentration of many inorganic
and organic gas compounds. Multiple measurement techniques, such as Gas
Chromatography coupled with Mass Spectrometer (GC-MS), Fourier Transform Infrared
Spectrometry (FTIR), High Pressure Liquid Chromatography (HPLC), Gas Chromatography
(GC-ECD and GC-FID/PID), Absorptive Sampling Solid Phase Microextraction (SPME)
were used to monitor the gas concentration of reactants and products.
Regarding the particle phase, aerosol concentration was monitored in an on-line way with a
TEOM (Tappered Element Oscillating Monitor) and a SMPS (Scanning Mobility Particle Sizer).
This latter provides also information about the diameter particle distribution by classifying the
aerosol particles by their electrical mobility. Also, three low volume samplings were taken
during the experiment and one high volume once the chamber was closed, in order to analyze
aerosol composition via gas chromatography and ion chromatography.
The experiment described in this chapter was performed on June, 17th, 2008, as a part of the
campaign performed by the authors in 2008 described in recent publications
(Vivanco et al., 2010). Experimental conditions are summarized in Table 1. A mixture of
volatile organic compounds and HONO was introduced into the chamber.
Time
Concentration (ppb)
Parents VOCs intro 7:11 1,3,5-TMB 151
HONO introduction 8:01 Toluene 99
Water introduction 8:48 o-xylene 17
Opening 10:33 Octane 80
Closure 15:23 HONO 98
Relative Humidity
20%
Table 1. Experimental conditions
After the parent VOCs the oxidant was introduced. Also, humidity conditions were prepared by
introducing pulverized water into the chamber. Then, the chamber was opened to the sunlight.
3. Gas phase chemistry of the parent VOCs
In this section, a study about the atmospheric photochemical reactions is done, focusing on
the oxidation pathways of the parent VOCs. These pathways consist in multiple oxidation
steps which lead to the formation of multiple compounds. A very useful source of
knowledge for atmospheric oxidation pathways is the Master Chemical Mechansim,
developed by the University of Leeds (Jenkin et al., 2003; Saunders et al., 2002). The latest
version of this mechanism, MCM v3.1 (Bloss et al., 2005), takes into account most of the
kinetic and mechanistic data avaliable to date.
The atmospheric oxidation of a certain compound is conditioned by its own structure and
by the nature of the initial oxidant. Nitrous acid (HONO) was used as the oxidant
compound and therefore, the major initial oxidant is the OH radical, formed by HONO
photolysis. The reaction of the aromatic VOCs emitted in this experiment with the OH
radical have been previously studied by several authors (Atkinson and Arey, 2003; Bloss et
al., 2005; Hamilton et al., 2005; Huang et al., 2006; Johnson et al., 2004; Wagner et al., 2002).
Two main reaction pathways can be identified in the oxidation of toluene, o-xylene or 1,3,5-
TMB with OH: H-abstraction and OH-addition. The H-abstraction is considered as the
minor route and leads to the formation of aromatic aldehydes. The OH-addition can occur
in three differet ways: through the phenolic, the epoxy-oxy and the peroxy-bicyclic routes.
The phenolic and epoxy-oxy routes lead to the formation of phenolic and epoxyde
compounds respectively, while the peroxy-bicyclic route produces the opening of the
aromatic rings and the formation of oxygenated products, which may lead to the formation
of SOA if their volatility is low enough. This last route is considered as the major oxidation
pathway according to the reactions included in the MCM v.3.1. A scheme of the oxidation
pathways for toluene, o-xylene and 1,3,5-TMB is presented in figures 2a, 2b and 2c.