Air Quality Part 9 ppt
Bạn đang xem bản rút gọn của tài liệu. Xem và tải ngay bản đầy đủ của tài liệu tại đây (767.96 KB, 25 trang )
Estimation of uncertainty in predicting ground level concentrations from
direct source releases in an urban area using the USEPA’s AERMOD model equations 193
Low Monin-
Obukhov length
σ
z
83.7 89.1 83.6 89.0 0 0.1
F
y
13.1 8.9 13.2 8.7 84.1 83.9
Q 0.9 0.4 0.9 0.5 4.6 5.1
u -1.7 -1.2 -1.8 -1.3 -11.3 -10.8
λ
1
0.5 0.4 0.5 0.4 - -
High Monin-
Obukhov length
σ
z
76.9 84.3 77.5 87.5 5.2 4.7
F
y
18.8 9.4 18.1 9.7 78.8 79.7
Q 1 0.6 1.0 0.7 1.2 4.7
U -2.7 -5.3 -2.6 -1.5 -2.5 -10.8
λ
1
0.6 0.4 0.8 0.5 - -
Table 11. Contribution to Variance by Parameters in Calculation of Concentration at
Different Downwind Distances.
The contributions to variance of parameters in both CBL and SBL for 1000 m and 10000 m
downwind distance are tabulated in Table 11. In CBL, contribution to variance by vertical
dispersion parameter is more than the contribution from horizontal distribution function
which is a function of lateral dispersion parameter, indicating pollutant concentration to be
more sensitive to vertical dispersion parameter than lateral dispersion parameter. However,
it is the opposite in SBL, i.e., pollutant concentration is more sensitive to lateral dispersion
parameter than vertical dispersion parameter. Wind speed parameter had a negative
contribution to variance irrespective of the boundary layer conditions at both downwind
distances. The contribution to variance by weighting coefficients is found to be negligible in
all the conditions.
For the condition considering stack heights from Table 11, the pollutant concentration
sensitiveness increased with downwind distance for vertical dispersion parameter and wind
speed, but decreased for the remaining parameters in CBL for both surface roughness
lengths considered. In SBL, contribution to variance by vertical dispersion parameter
reduced with increase in downwind distance and increased for all other parameters
considered for analysis.
For the condition considering low and high wind speeds from Table 11, in CBL, the
pollutant concentration sensitiveness increased with downwind distance for vertical
dispersion parameter. Pollutant concentration sensitiveness varied with surface roughness.
For the case of Z
0
being 1 m pollutant concentration sensitiveness decreased with increase in
downwind distance and the opposite trend is observed for the case of Z
0
being 0.03 m. For
all other parameters pollutant concentration sensitiveness decreased with increase in
downwind distance. In SBL, pollutant concentration sensitiveness decreased for vertical
dispersion parameter as downwind distance increased and one can note that for lower wind
speed, the contribution to variance by vertical dispersion parameter is zero at both 1000 m
and 10000 m.
For the condition of ambient temperature in CBL, the contribution of variance by vertical
dispersion parameter and wind speed increased with downwind distance and decreased for
all other parameters for both the surface roughness lengths considered. Similar pattern can
be observed in SBL for the condition of lower ambient temperature with the exception that
wind speed showed an opposite trend to that observed in CBL. However, for the case of
higher ambient temperature, in SBL, the contribution to variance increases for horizontal
distribution and emission rate, and decreases for vertical dispersion parameter and wind
speed with increase in downwind distance. For both high and low values of ambient
temperature, the contribution by wind speed was significant in SBL compared to CBL. Thus,
one can state that the concentrations are more sensitive to higher temperatures and wind
speed in SBL than in CBL.
The sensitiveness in Monin-Obukhov length condition showed similar behavior to that of
wind speed condition. It was observed that emission rate had more contribution to variance
than vertical dispersion parameter in SBL for the cases having lower values of Monin-
Obukhov length, wind speed, and ambient temperature. The remaining parameters defined
in the assumption cells have negligible contribution to variance when compared to vertical
dispersion parameter and total horizontal distribution function.
4. Conclusions
The objective of the study was to perform uncertainty and sensitivity analyses in predicting
the concentrations from the AERMOD equations. As it is difficult to perform uncertainty
and sensitivity analyses using the original AERMOD model, an approximate set of
AERMOD equations were programmed in Excel. The predicted concentrations from the
AERMODCBL and AERMODSBL models were compared to the predicted concentrations
from AERMOD model. The comparison has shown that the predicted concentration values
from the spreadsheet ranged between 87% and 107%, as compared to the predicted
concentration values from the AERMOD model. This showed that the predicted
concentrations obtained by the modeled equations can be relied upon to perform
uncertainty and sensitivity analyses for both atmospheric conditions.
Uncertainty and sensitivity analysis has been performed for different cases taken into
consideration by varying stack height, wind speed, Monin-Obukhov length, and ambient
temperature for three days and source data as summarized in Tables 3, 4, and 5. The
conclusions made from the study are listed below.
1. A user-friendly tool [60], that can calculate downwind contaminant concentrations
under different boundary layer conditions has been developed using the AERMOD
equations.
2. The uncertainty range varies between 67% and 75% for convective conditions on
averaging the uncertainty values from all the considered cases, while in stable
conditions, it ranged from 40% to 47%. This means the predictions are less certain
in convective cases.
3. The contribution to variance by vertical dispersion parameter (σ
z
) is found to be
82% under convective conditions i.e. the predicted concentrations are highly
influenced by σ
z.
. In the case of horizontal distribution (F
y
), the contribution to
variance was found to be 75% in the stable case.
Air Quality194
4. In SBL, for low values of wind speed, Monin-Obukhov length, and ambient
temperature, the contribution to variance by emission rate (Q) is considerably more
than that of vertical dispersion parameter (σ
z
).
5. In CBL, concentration predictions are sensitive to vertical dispersion (σ
z
) and
horizontal distribution (F
y
), i.e. σ
y
regardless of stack height and surface roughness.
6. In SBL, concentration predictions are sensitive to horizontal distribution (F
y
), i.e. σ
y
and vertical dispersion (σ
z
) regardless of the stack heights.
7. The predicted concentration equation is sensitive to vertical dispersion parameter
(σ
z
), horizontal distribution (F
y
) (lateral dispersion parameter (σ
y
)), and emission
rate. Other parameters have negligible or no influence on sensitivity with the
exception of wind speed that has a negative correlation.
5. Acknowledgements
The authors would like to thank Lakes Environmental for providing a copy of the software
for the use in this research work.
6. References
Bartell, S.M.; Breck, J.E.; Gardner, R.H.; Brenkert, A.L. Individual parameter perturbation
and error analysis of fish bioenergetics models. Can. J. Fish. Aquat. Sci. 1986, 43, 160-
168.
Bergin, M.S.; Noblet, G.S.; Petrini, K.; Dhieux, J.R.; Milford, J.B.; Harley, R.A. Formal
uncertainty analysis of a lagrangian photochemical air pollution model. J. Environ.
Sci. Technol. 1999, 33, 1116–1126.
Bhat, A.S. Development and evaluation of a screening type dispersion model for bioaerosols
emission from land application of Class B biosolids. Master’s Thesis, The University
of Toledo. 2008, 78 pp
Bowers, J.F.; Bjorkland J.R.; Cheney C.S. (1979).Industrial Source Complex (ISC) dispersion
model user’s guide. U.S. Environmental Protection Agency Report. EPA 450/4-79-
030.
Brenkert, A.L.; Gardner, R.H.; Bartell, S.M.; Hoffman, F.O. In Reliability of Radioactive
Transfer Models; Desmet, G.; Ed.; Uncertainties associated with estimates of
radium accumulation in lake sediments and biota. Elsevier Applied Science:
London, UK, 1988; pp 185-192.
Briggs, G.A. Plume dispersion in the convective boundary layer. Part II: analysis of
CONDORS field experiment data. J. Appl Meteorol. 1993, 32, 1388-1425.
Cacuci, D.G. Sensitivity theory for nonlinear systems. Part I and II. J. Math. Phys. 1981, 22,
2794-2812.
Chen Y.; Dwaine B.; Steven H. Development of model of dispersion parameters for odour
transmission from agricultural sources. J. Agr. Eng. 1998, 69, 229-238.
Cullen, A.C.; Frey, H.C. (1999). Probabilistic techniques in exposure assessment: a handbook
for dealing with variability and uncertainty in risk analysis. New York: Plenum
Press.
Dabberdt, W.F.; Miller, E. Uncertainty, ensembles, and air quality dispersion modeling:
applications and challenges. J. Atmos. Environ. 2000, 34, 4667–4673.
Dempster, A.P. Upper and lower probabilities induced by a multi-valued mapping. Ann.
Math. Statistics. 1967, 38, 325–339.
Derwent, R.; Hov, Ø. Application of sensitivity and uncertainty analysis techniques to a
photochemical ozone model. J. Geophys. Res. 1988, 93, 5185–5199.
Downing, D.J.; Gardner, R.H.; Hoffman, F.O. An examination of response-surface
methodologies for uncertainty analysis in assessment models. Technometrics. 1985,
27, 151–163.
Eugene, Y.; Fue-Sang, L.; Andrew, K.; D’Amours, R. Bayesian inversion of concentration
data: source reconstruction in the adjoint representation of atmospheric diffusion. J.
Wind. Eng. Ind. Aerodyn. 2008, 96, 1805-1816.
Ferson, S. Kuhn, R. In Computer Techniques in Environmental Studies IV; Zannetti, P.; Ed.;
Propagating uncertainty in ecological risk analysis using interval and fuzzy
arithmetic. Elsevier Applied Science: London, UK, 1992; pp 387-401.
Freeman, D.L.; Egami, R.T.; Robinson, N.F.; Watson, J.G. A method for propagating
measurement uncertainties through dispersion models. J. Air. Pollut. Control. Assoc.
1986, 36, 246–253.
Frey, H.C. Separating variability and uncertainty in exposure assessment: motivations and
method. Paper No. 93-79.01. Proceedings of the 86th Annual Meeting of Air and
Waste Management Association. June 1993.
Frey, H.C.; Li, S. Methods for quantifying variability and uncertainty in AP-42 emission
factors: case studies for natural gas-fueled engines. Emissions inventories—
partnering for the future. Proceedings of the EPA 11th International Emission
Inventory Conference. April 15–18, 2002.
Frey, H.C.; Rhodes, D.S. Characterizing, simulating, and analyzing variability and
uncertainty: an illustration of methods using an air toxics example. J. Hum. Ecol.
Risk. Assess. 1996, 2, 762–797.
Frey, H.C.; Zheng, J. Method for development of probabilistic emission inventories: example
case study for utility NO
x
emissions. Emissions inventories—partnering for the
future. Proceedings of the EPA 11th International Emission Inventory Conference.
April 15–18, 2002.
Gabriel, G.K. A model for sensible heat flux probability density function for near-neutral
and slightly stable atmospheric flows. Bound. Lay. Meteorol. 1994, 71, 1-20.
Gao, D.; Stockwell, W.R.; Milford, J.B. Global uncertainty analysis of a regional-scale gas-
phase chemical mechanism. J. Geophys. Res. 1996, 101, 9107–9119.
Gardner, R.H.; O'Neill, R.V.; Mankin, J.B.; Carney, J.H. A comparison of sensitivity analysis
and error analysis based on a stream ecosystem model. Ecol. Model. 1981, 12, 177-
194.
Garratt, J.R. The Atmospheric Boundary Layer; Cambridge University Press: New York, NY,
1992, 334 pp.
Gottschalk, P.; Wattenbach, M.; Neftel, A.; Fuhrer, J.; Jones, M.; Lanigan, G.; Davis, P.;
Campbell, C.; Soussana, J.F.; Smith, P. The role of measurement uncertainties for
the simulation of grassland net ecosystem exchange (NEE) in Europe. Agricult.
Ecosys. Environ. 2007, 121, 175–185
Estimation of uncertainty in predicting ground level concentrations from
direct source releases in an urban area using the USEPA’s AERMOD model equations 195
4. In SBL, for low values of wind speed, Monin-Obukhov length, and ambient
temperature, the contribution to variance by emission rate (Q) is considerably more
than that of vertical dispersion parameter (σ
z
).
5. In CBL, concentration predictions are sensitive to vertical dispersion (σ
z
) and
horizontal distribution (F
y
), i.e. σ
y
regardless of stack height and surface roughness.
6. In SBL, concentration predictions are sensitive to horizontal distribution (F
y
), i.e. σ
y
and vertical dispersion (σ
z
) regardless of the stack heights.
7. The predicted concentration equation is sensitive to vertical dispersion parameter
(σ
z
), horizontal distribution (F
y
) (lateral dispersion parameter (σ
y
)), and emission
rate. Other parameters have negligible or no influence on sensitivity with the
exception of wind speed that has a negative correlation.
5. Acknowledgements
The authors would like to thank Lakes Environmental for providing a copy of the software
for the use in this research work.
6. References
Bartell, S.M.; Breck, J.E.; Gardner, R.H.; Brenkert, A.L. Individual parameter perturbation
and error analysis of fish bioenergetics models. Can. J. Fish. Aquat. Sci. 1986, 43, 160-
168.
Bergin, M.S.; Noblet, G.S.; Petrini, K.; Dhieux, J.R.; Milford, J.B.; Harley, R.A. Formal
uncertainty analysis of a lagrangian photochemical air pollution model. J. Environ.
Sci. Technol. 1999, 33, 1116–1126.
Bhat, A.S. Development and evaluation of a screening type dispersion model for bioaerosols
emission from land application of Class B biosolids. Master’s Thesis, The University
of Toledo. 2008, 78 pp
Bowers, J.F.; Bjorkland J.R.; Cheney C.S. (1979).Industrial Source Complex (ISC) dispersion
model user’s guide. U.S. Environmental Protection Agency Report. EPA 450/4-79-
030.
Brenkert, A.L.; Gardner, R.H.; Bartell, S.M.; Hoffman, F.O. In Reliability of Radioactive
Transfer Models; Desmet, G.; Ed.; Uncertainties associated with estimates of
radium accumulation in lake sediments and biota. Elsevier Applied Science:
London, UK, 1988; pp 185-192.
Briggs, G.A. Plume dispersion in the convective boundary layer. Part II: analysis of
CONDORS field experiment data. J. Appl Meteorol. 1993, 32, 1388-1425.
Cacuci, D.G. Sensitivity theory for nonlinear systems. Part I and II. J. Math. Phys. 1981, 22,
2794-2812.
Chen Y.; Dwaine B.; Steven H. Development of model of dispersion parameters for odour
transmission from agricultural sources. J. Agr. Eng. 1998, 69, 229-238.
Cullen, A.C.; Frey, H.C. (1999). Probabilistic techniques in exposure assessment: a handbook
for dealing with variability and uncertainty in risk analysis. New York: Plenum
Press.
Dabberdt, W.F.; Miller, E. Uncertainty, ensembles, and air quality dispersion modeling:
applications and challenges. J. Atmos. Environ. 2000, 34, 4667–4673.
Dempster, A.P. Upper and lower probabilities induced by a multi-valued mapping. Ann.
Math. Statistics. 1967, 38, 325–339.
Derwent, R.; Hov, Ø. Application of sensitivity and uncertainty analysis techniques to a
photochemical ozone model. J. Geophys. Res. 1988, 93, 5185–5199.
Downing, D.J.; Gardner, R.H.; Hoffman, F.O. An examination of response-surface
methodologies for uncertainty analysis in assessment models. Technometrics. 1985,
27, 151–163.
Eugene, Y.; Fue-Sang, L.; Andrew, K.; D’Amours, R. Bayesian inversion of concentration
data: source reconstruction in the adjoint representation of atmospheric diffusion. J.
Wind. Eng. Ind. Aerodyn. 2008, 96, 1805-1816.
Ferson, S. Kuhn, R. In Computer Techniques in Environmental Studies IV; Zannetti, P.; Ed.;
Propagating uncertainty in ecological risk analysis using interval and fuzzy
arithmetic. Elsevier Applied Science: London, UK, 1992; pp 387-401.
Freeman, D.L.; Egami, R.T.; Robinson, N.F.; Watson, J.G. A method for propagating
measurement uncertainties through dispersion models. J. Air. Pollut. Control. Assoc.
1986, 36, 246–253.
Frey, H.C. Separating variability and uncertainty in exposure assessment: motivations and
method. Paper No. 93-79.01. Proceedings of the 86th Annual Meeting of Air and
Waste Management Association. June 1993.
Frey, H.C.; Li, S. Methods for quantifying variability and uncertainty in AP-42 emission
factors: case studies for natural gas-fueled engines. Emissions inventories—
partnering for the future. Proceedings of the EPA 11th International Emission
Inventory Conference. April 15–18, 2002.
Frey, H.C.; Rhodes, D.S. Characterizing, simulating, and analyzing variability and
uncertainty: an illustration of methods using an air toxics example. J. Hum. Ecol.
Risk. Assess. 1996, 2, 762–797.
Frey, H.C.; Zheng, J. Method for development of probabilistic emission inventories: example
case study for utility NO
x
emissions. Emissions inventories—partnering for the
future. Proceedings of the EPA 11th International Emission Inventory Conference.
April 15–18, 2002.
Gabriel, G.K. A model for sensible heat flux probability density function for near-neutral
and slightly stable atmospheric flows. Bound. Lay. Meteorol. 1994, 71, 1-20.
Gao, D.; Stockwell, W.R.; Milford, J.B. Global uncertainty analysis of a regional-scale gas-
phase chemical mechanism. J. Geophys. Res. 1996, 101, 9107–9119.
Gardner, R.H.; O'Neill, R.V.; Mankin, J.B.; Carney, J.H. A comparison of sensitivity analysis
and error analysis based on a stream ecosystem model. Ecol. Model. 1981, 12, 177-
194.
Garratt, J.R. The Atmospheric Boundary Layer; Cambridge University Press: New York, NY,
1992, 334 pp.
Gottschalk, P.; Wattenbach, M.; Neftel, A.; Fuhrer, J.; Jones, M.; Lanigan, G.; Davis, P.;
Campbell, C.; Soussana, J.F.; Smith, P. The role of measurement uncertainties for
the simulation of grassland net ecosystem exchange (NEE) in Europe. Agricult.
Ecosys. Environ. 2007, 121, 175–185
Air Quality196
Griewank, A.; Corliss, H. (1991). Automatic differentiation of algorithms: theory,
implementation, and application. Philadelphia: Society for Industrial and Applied
Mathematics.
Grenfell, J.L.; Savage, N.H.; Harrison, R.M.; Penkett, S.A. ; Forberich, O. ;Comes, F.J. ;
Clemitshaw, K.C. ; Burgess, R.A. ; Cardenas, L.M. ; Davison, B.; McFadyen, G.G.
Tropospheric box-modelling and analytical studies of the hydroxyl (OH) radical
and related species: comparison with observations. J. Atmos. Chem. 1999, 33, 183–
214.
Guensler, R.; Leonard, J.D. Monte Carlo technique for assessing motor vehicle emission
model uncertainty. Proceedings of the Transportation Congress. Part 2 (of 2),
October 22–26, 1995. New York, NY.
Hakami, A.; Odman, M.T.; Russell, A.G. High-order, direct sensitivity analysis of
multidimensional air quality models. J. Environ. Sci. Technol. 2003, 37, 2442–2452.
Hanna, S.R. Air quality model evaluation and uncertainty. J. Air Pollut. Control Assoc. 1988,
38, 406–412.
Hanna, S.R.; Chang, J.S. Hybrid Plume Dispersion Model (HPDM), improvements and
testing at three field sites. J.Atmos. Environ. 1993, 27A, 1491-1508.
Hanna, S.R.; Chang, J.C.; Fernau, M.E. Monte Carlo estimates of uncertainties in predictions
by a photochemical grid model (UAM-IV) due to uncertainties in input variables. J.
Atmos. Environ. 1998, 32, 3619–3628.
Hanna, S.R.; Davis, J.M. Evaluation of a photochemical grid model using estimates of
concentration probability density functions. J. Atmos. Environ. 2002, 36, 1793–1798.
Hanna, S.R.; Weil, J.C.; Paine, R.J. Plume model development and evaluation-hybrid
approach. EPRI Contract No. RP-1616-27, Electric Power Research Institute, Palo
Alto, California, 1986.
Hanna, S.R.; Zhigang, L.; Frey, H.C.; Wheeler, N.; Vukovich, J.; Arunachalam, S.; Fernau, M.;
Hansen, D.A. Uncertainties in predicted ozone concentrations due to input
uncertainties for the UAM-V photochemical grid model applied to the July 1995
OTAG domain. J. Atmos. Environ. 2001, 35, 891–903.
Hansen, E.; Walster, G.W. (2004). Global optimization using interval analysis. Second Ed.
New York: Marcel Dekker.
Hwang, D.; Karimi, H.A.; Byun, D.W. Uncertainty analysis of environmental models within
GIS environments. Comput. Geosci. 1998, 24, 119-130.
Iman, R.L.; Helton, J.C. The repeatability of uncertainty and sensitivity analyses for complex
probabilistic risk assessments. Risk. Anal. 1991, 11, 591-606.
Iman, R.L.; Helton, J.C.; Campbell, J.E. An approach to sensitivity analysis of computer
models, Part 1. Introduction, input variable selection and preliminary variable
assessment. J. Qual. Technol. 1981a, 13, 174-183.
Iman, R.L.; Helton, J.C.; Campbell, J.E. An approach to sensitivity analysis of computer
models, Part 2. Ranking of input variables, response surface validation, distribution
effect and techniques synopsis. J. Qual. Technol. 1981b, 13, 232-240.
Int Panis, L.; De Nocker, L.; Cornelis, E.; Torfs, R., An uncertainty analysis of air pollution
externalities from road transport in belgium in 2010. J.Sci. Total Environ. 2004, 334-
335, 287-298.
International Atomic Energy Agency (IAEA). (1989). Evaluating the reliability of predictions
made using environmental transfer models. Vienna, Austria: IAEA Safety Series
100.
Irwin, J.S.; Rao, S.T.; Petersen, W.B.; Turner, D.B. Relating error bounds for maximum
concentration estimates to diffusion meteorology uncertainty. J. Atmos. Environ.
1987, 21, 1927–1937.
Jaarsveld, J.A.V.; Van Pul, W.A.J.; De Leeuw, F.A.A.M. Modeling transportation and
deposition of persistent organic pollutant in european region. J. Atmos. Environ.
1997, 31, 1011–1024.
Kumar, A.; Thomas, S.T.; Kong, S. Local sensitivity analysis of a long range transport model.
Meteorology of Acid Deposition, Vol. 2, APCA Transactions TR-8, Air Pollution
Control Association, 1987, pp. 158-168.
Kumar, A.; Manocha, A.; Shenoy, T. Sensitivity and uncertainty analysis of a regulatory risk
model. Paper No. 219. Proceedings of the 89th Annual Meeting of Air and Waste
Management Association. June 1996.
Kumar, A.; Mahurkar, A.; Joshi, A. Sensitivity analysis of an instantaneous box release
model with surface heat transfer. Paper No. 42755. Proceedings of the 95th Annual
Meeting of Air and Waste Management Association. June 2002.
Kumar, A.; Varadarajan, C.; Bhardwaj, K. Chapter 8, In Air Quality in the 21st Century;
Romano, G.C.; Conti, A.G.; Ed.; Sensitivity of land use parameters and population
on the prediction of concentration using the AERMOD model for an urban area.
Nova Science: Hauppauge, NY, 2009.
Kuruvilla, S.A.; Kumar, A.; Varadarajan, C.; Vijayan, A. Development of a spreadsheet to
model releases from continuous volume sources. Environ. Prog. 2005, 24, 349-353.
Lamb, R.G. In Atmospheric Turbulence and Air Pollution Modeling; Nieuwstadt, F.T.M.;
Van Dop, H.; Eds.; Diffusion in the convective boundary layer. Reidel: Boston, MA,
1982; pp 159-229.
Martz, H.F.; Waller, R.A. (1982). Bayesian Reliability Analysis. New York: John Wiley & Sons.
Mead, R.; Pike, D.J. A review of response surface methodology from a biometric viewpoint.
Biometrics. 1975, 31, 803-851.
Moore, G.E.; Londergan, R.J. Sampled Monte Carlo uncertainty analysis for photochemical
grid models. J. Atmos. Environ. 2001, 35, 4863–4876.
Morgan, M.G.; Henrion, M. (1990). Uncertainty: A guide to dealing with uncertainty in
quantitative risk and policy analysis. New York: Cambridge University Press.
Morton, R.H. Response Surface Methodology. Math. Sci. 1983, 8, 31-52.
Myers, R.H. (1971). Response surface methodology. Boston: Allyn and Bacon.
Patel, I.; Kumar, A.; Manne, G. Sensitivity analysis of CAL3QHC roadway intersection
model. J. TRB. 2003, 1842, 109-117.
Perry, S.G. CTDMPLUS: A dispersion model for sources in complex topography. Part I:
technical formulation. J. Appl. Meteorol. 1992, 31, 633-645
Phenix, B.D.; Dinaro, J.L.; Tatang, M.A.; Tester, J.W. ; Howard, J.B. ; McRae, G.J. Incorporation
of parametric uncertainty into complex kinetic mechanisms: application to hydrogen
oxidation in supercritical water. Combust. Flame. 1998, 112, 132–146.
Poosarala, V. V.; Kumar, A.; Kadiyala, A. Development of a spreadsheet for computing
downwind concentrations based on the USEPA's AERMOD model. Environ.
Prog. & Sustainable Energy. 2009, 28, 185-191.
Estimation of uncertainty in predicting ground level concentrations from
direct source releases in an urban area using the USEPA’s AERMOD model equations 197
Griewank, A.; Corliss, H. (1991). Automatic differentiation of algorithms: theory,
implementation, and application. Philadelphia: Society for Industrial and Applied
Mathematics.
Grenfell, J.L.; Savage, N.H.; Harrison, R.M.; Penkett, S.A. ; Forberich, O. ;Comes, F.J. ;
Clemitshaw, K.C. ; Burgess, R.A. ; Cardenas, L.M. ; Davison, B.; McFadyen, G.G.
Tropospheric box-modelling and analytical studies of the hydroxyl (OH) radical
and related species: comparison with observations. J. Atmos. Chem. 1999, 33, 183–
214.
Guensler, R.; Leonard, J.D. Monte Carlo technique for assessing motor vehicle emission
model uncertainty. Proceedings of the Transportation Congress. Part 2 (of 2),
October 22–26, 1995. New York, NY.
Hakami, A.; Odman, M.T.; Russell, A.G. High-order, direct sensitivity analysis of
multidimensional air quality models. J. Environ. Sci. Technol. 2003, 37, 2442–2452.
Hanna, S.R. Air quality model evaluation and uncertainty. J. Air Pollut. Control Assoc. 1988,
38, 406–412.
Hanna, S.R.; Chang, J.S. Hybrid Plume Dispersion Model (HPDM), improvements and
testing at three field sites. J.Atmos. Environ. 1993, 27A, 1491-1508.
Hanna, S.R.; Chang, J.C.; Fernau, M.E. Monte Carlo estimates of uncertainties in predictions
by a photochemical grid model (UAM-IV) due to uncertainties in input variables. J.
Atmos. Environ. 1998, 32, 3619–3628.
Hanna, S.R.; Davis, J.M. Evaluation of a photochemical grid model using estimates of
concentration probability density functions. J. Atmos. Environ. 2002, 36, 1793–1798.
Hanna, S.R.; Weil, J.C.; Paine, R.J. Plume model development and evaluation-hybrid
approach. EPRI Contract No. RP-1616-27, Electric Power Research Institute, Palo
Alto, California, 1986.
Hanna, S.R.; Zhigang, L.; Frey, H.C.; Wheeler, N.; Vukovich, J.; Arunachalam, S.; Fernau, M.;
Hansen, D.A. Uncertainties in predicted ozone concentrations due to input
uncertainties for the UAM-V photochemical grid model applied to the July 1995
OTAG domain. J. Atmos. Environ. 2001, 35, 891–903.
Hansen, E.; Walster, G.W. (2004). Global optimization using interval analysis. Second Ed.
New York: Marcel Dekker.
Hwang, D.; Karimi, H.A.; Byun, D.W. Uncertainty analysis of environmental models within
GIS environments. Comput. Geosci. 1998, 24, 119-130.
Iman, R.L.; Helton, J.C. The repeatability of uncertainty and sensitivity analyses for complex
probabilistic risk assessments. Risk. Anal. 1991, 11, 591-606.
Iman, R.L.; Helton, J.C.; Campbell, J.E. An approach to sensitivity analysis of computer
models, Part 1. Introduction, input variable selection and preliminary variable
assessment. J. Qual. Technol. 1981a, 13, 174-183.
Iman, R.L.; Helton, J.C.; Campbell, J.E. An approach to sensitivity analysis of computer
models, Part 2. Ranking of input variables, response surface validation, distribution
effect and techniques synopsis. J. Qual. Technol. 1981b, 13, 232-240.
Int Panis, L.; De Nocker, L.; Cornelis, E.; Torfs, R., An uncertainty analysis of air pollution
externalities from road transport in belgium in 2010. J.Sci. Total Environ. 2004, 334-
335, 287-298.
International Atomic Energy Agency (IAEA). (1989). Evaluating the reliability of predictions
made using environmental transfer models. Vienna, Austria: IAEA Safety Series
100.
Irwin, J.S.; Rao, S.T.; Petersen, W.B.; Turner, D.B. Relating error bounds for maximum
concentration estimates to diffusion meteorology uncertainty. J. Atmos. Environ.
1987, 21, 1927–1937.
Jaarsveld, J.A.V.; Van Pul, W.A.J.; De Leeuw, F.A.A.M. Modeling transportation and
deposition of persistent organic pollutant in european region. J. Atmos. Environ.
1997, 31, 1011–1024.
Kumar, A.; Thomas, S.T.; Kong, S. Local sensitivity analysis of a long range transport model.
Meteorology of Acid Deposition, Vol. 2, APCA Transactions TR-8, Air Pollution
Control Association, 1987, pp. 158-168.
Kumar, A.; Manocha, A.; Shenoy, T. Sensitivity and uncertainty analysis of a regulatory risk
model. Paper No. 219. Proceedings of the 89th Annual Meeting of Air and Waste
Management Association. June 1996.
Kumar, A.; Mahurkar, A.; Joshi, A. Sensitivity analysis of an instantaneous box release
model with surface heat transfer. Paper No. 42755. Proceedings of the 95th Annual
Meeting of Air and Waste Management Association. June 2002.
Kumar, A.; Varadarajan, C.; Bhardwaj, K. Chapter 8, In Air Quality in the 21st Century;
Romano, G.C.; Conti, A.G.; Ed.; Sensitivity of land use parameters and population
on the prediction of concentration using the AERMOD model for an urban area.
Nova Science: Hauppauge, NY, 2009.
Kuruvilla, S.A.; Kumar, A.; Varadarajan, C.; Vijayan, A. Development of a spreadsheet to
model releases from continuous volume sources. Environ. Prog. 2005, 24, 349-353.
Lamb, R.G. In Atmospheric Turbulence and Air Pollution Modeling; Nieuwstadt, F.T.M.;
Van Dop, H.; Eds.; Diffusion in the convective boundary layer. Reidel: Boston, MA,
1982; pp 159-229.
Martz, H.F.; Waller, R.A. (1982). Bayesian Reliability Analysis. New York: John Wiley & Sons.
Mead, R.; Pike, D.J. A review of response surface methodology from a biometric viewpoint.
Biometrics. 1975, 31, 803-851.
Moore, G.E.; Londergan, R.J. Sampled Monte Carlo uncertainty analysis for photochemical
grid models. J. Atmos. Environ. 2001, 35, 4863–4876.
Morgan, M.G.; Henrion, M. (1990). Uncertainty: A guide to dealing with uncertainty in
quantitative risk and policy analysis. New York: Cambridge University Press.
Morton, R.H. Response Surface Methodology. Math. Sci. 1983, 8, 31-52.
Myers, R.H. (1971). Response surface methodology. Boston: Allyn and Bacon.
Patel, I.; Kumar, A.; Manne, G. Sensitivity analysis of CAL3QHC roadway intersection
model. J. TRB. 2003, 1842, 109-117.
Perry, S.G. CTDMPLUS: A dispersion model for sources in complex topography. Part I:
technical formulation. J. Appl. Meteorol. 1992, 31, 633-645
Phenix, B.D.; Dinaro, J.L.; Tatang, M.A.; Tester, J.W. ; Howard, J.B. ; McRae, G.J. Incorporation
of parametric uncertainty into complex kinetic mechanisms: application to hydrogen
oxidation in supercritical water. Combust. Flame. 1998, 112, 132–146.
Poosarala, V. V.; Kumar, A.; Kadiyala, A. Development of a spreadsheet for computing
downwind concentrations based on the USEPA's AERMOD model. Environ.
Prog. & Sustainable Energy. 2009, 28, 185-191.
Air Quality198
Rao, S.K. Uncertainty analysis in atmospheric dispersion modeling. Pure Appl. Geophys. 2005,
162, 1893-1917.
Rodriguez, M.A.; Brouwer, J.; Samuelsen, G.S.; Dabdub, D. Air quality impacts of
distributed power generation in the south coast air basin of california 2: model
uncertainty and sensitivity analysis. J. Atmos. Environ. 2007, 41, 5618–5635
Romano, D.; Bernetti, A.; De Lauretis, R. Different methodologies to quantify uncertainties
of Air Emissions. Environ. Int. 2004, 30, 1099-1107
Rubinstein, R.Y. (1981). Simulation and the Monte Carlo Method. John Wiley & Sons.
Sathyajith, M.; Pandey, K.P.; Kumar, A.V. Analysis of wind regimes for energy estimation.
Renew. Energ. 2002, 25, 381-399.
Sax, T.; Isakov, V. A case Study for assessing uncertainty in local scale regulatory air quality
modeling applications. J. Atmos. Environ. 2003, 37, 3481-3489
Scavia, D.; Powers, W.F.; Canale, R.P.; Moody, J.L. Comparison of first-order error analysis
and monte carlo simulation in time-dependent lake eutrophication models. Water.
Resour. Res. 1981, 17, 1051-1059.
Seigneur, C.; Constantinou, E.; Permutt, T. Uncertainty analysis of health risk estimates.
Document No. 2460-009-510, Electric Power Research Institute, Palo Alto,
California, 1992.
Shafer, G. (1976). A mathematical theory of evidence. New Jersey: Princeton Univ. Press.
Smith, R.I.; Fowler, D.; Sutton, M.A.; Flechard, C.; Coyle, M. Regional estimation of
pollutant gas dry deposition in the UK: model description, sensitivity analyses and
outputs. J. Atmos. Environ. 2000, 34, 3757–3777.
Thomas, S.T.; Kumar, A.; Vangipuram, R.N. Sensitivity analysis of a statistical type long
range transport model. Paper No. 85-5.8. 78th Annual Meeting of Air Pollution
Control Association. June 1985.
Vardoulakis, S.; Fisher, B.E.A.; Gonzalez-Flesca, N.; Pericleous, K. Model sensitivity and
uncertainty analysis using roadside air quality measurements. J. Atmos. Environ.
2002, 36, 2121-2134.
Venkatram, A.; Strimaitis, D.G.; Dicristofaro, D. A semiemperical model to estimate vertical
dispersion of eleveated releases in the stable boundary layer. J. Atmos. Environ.
1984, 18, 923-928
Vuilleumier, L.; Bamer, J.T.; Harley, R.A.; Brown, N.J. Evaluation of nitrogen dioxide
photolysis rates in an urban area using data from the 1997 southern california
ozone study. J. Atmos. Environ. 2001, 35, 6525–6537.
Weil, J.C.; Corio, L.A.; Brower, R.P. A PDF dispersion model for buoyant plumes in the
convective boundary layer. J. Appl Meteorol. 1997, 36, 982-1002.
Willis, G.E.; Deardroff, J.W. A laboratory study of dispersion in the middle of the
convectively mixed layer. J. Atmos. Environ. 1981, 15, 109-117.
Worley, B.A. (1987). Deterministic uncertainty analysis. ORNL-6428. Oak Ridge National
Laboratory, Oak Ridge, Tennessee.
Yang, Y.J.; Wilkinson, J.G.; Russell, A.G. Fast, direct sensitivity analysis of multidimensional
models. J. Environ. Sci. Technol. 1997, 31, 2859–2868.
Yegnan, A.; Williamson, D.G.; Graettinger, A.J. Uncertainty analysis in air dispersion
modeling. J. Environ. Modell. Softw. 2002, 17, 639-649.
Zadeh, L. Fuzzy sets as a basis for a theory of possibility. Fuzzy. Set. Syst. 1978, 1, 3-28.
Nomenclature
C
d
(x,y,z) ground level concentration from the direct source (CBL) (g m
-3
)
C
s
(x,y,z) ground level concentration (SBL) (g m
-3
)
c
p
specific heat at constant pressure (= 1004 J g
-1
K
-1
)
C
D
neutral drag coefficient (cal g
-1
o
C
-1
)
F
b
plume buoyancy flux (m
4
s
3
)
F
y
total horizontal/lateral distribution function (m
-1
)
F
m
plume momentum flux (m
4
s
2
)
f
p
fraction of plume mass contained in CBL = (1 - penetration factor)
(dimensionless)
g acceleration due to gravity (9.81 m s
-2
)
H sensible heat flux (W m
-2
)
H
p
plume centroid height (m)
h
s
stack height corrected for stack tip downwash (m)
h
es
plume rise for the stable source (m)
∆h
d
plume rise for the direct source (m)
∆h
s
plume rise for the stable source (m)
k Von Karman constant k = 0.4 (dimensionless)
l length used in determining the Lagrangian time scale (m)
l
n
neutral length scale – a component of l (m)
l
s
stable length scale – a component of l (m)
L Monin-Obukhov length (m)
m multiple reflections of plume (dimensionless)
N Brunt-Vaisala frequency (s
-1
)
n cloud cover (fractional)
Q source emission rate (g s
-1
)
R solar insolation (W m
-2
)
r
s
stack radius (m)
S skewness factor (dimensionless)
T ambient temperature (
o
K)
T
lzs
vertical lagrangian time scale for the SBL (sec)
T
ref
ambient temperature - at reference temperature height (
o
K)
T
s
stack gas temperature (
o
K)
t time (sec)
∆T difference between stack gas and ambient temperature (K)
u wind speed (m s
-1
)
u
ref
wind speed at reference height (m s
-1
)
u
*
surface friction velocity (m s
-1
)
w
j
mean vertical velocity for the updraft (j = 1) and the downdraft (j = 2)
distributions (m-s
-1
)
w
s
stack exit gas velocity (m-s
-1
)
w
*
convective velocity scale (m-s
-1
)
x downwind distance to a receptor (m)
y receptor location on the y axis
z z
r
and z
p
in the horizontal and terrain following states
z
r
height of the receptor above local source base (m)
Estimation of uncertainty in predicting ground level concentrations from
direct source releases in an urban area using the USEPA’s AERMOD model equations 199
Rao, S.K. Uncertainty analysis in atmospheric dispersion modeling. Pure Appl. Geophys. 2005,
162, 1893-1917.
Rodriguez, M.A.; Brouwer, J.; Samuelsen, G.S.; Dabdub, D. Air quality impacts of
distributed power generation in the south coast air basin of california 2: model
uncertainty and sensitivity analysis. J. Atmos. Environ. 2007, 41, 5618–5635
Romano, D.; Bernetti, A.; De Lauretis, R. Different methodologies to quantify uncertainties
of Air Emissions. Environ. Int. 2004, 30, 1099-1107
Rubinstein, R.Y. (1981). Simulation and the Monte Carlo Method. John Wiley & Sons.
Sathyajith, M.; Pandey, K.P.; Kumar, A.V. Analysis of wind regimes for energy estimation.
Renew. Energ. 2002, 25, 381-399.
Sax, T.; Isakov, V. A case Study for assessing uncertainty in local scale regulatory air quality
modeling applications. J. Atmos. Environ. 2003, 37, 3481-3489
Scavia, D.; Powers, W.F.; Canale, R.P.; Moody, J.L. Comparison of first-order error analysis
and monte carlo simulation in time-dependent lake eutrophication models. Water.
Resour. Res. 1981, 17, 1051-1059.
Seigneur, C.; Constantinou, E.; Permutt, T. Uncertainty analysis of health risk estimates.
Document No. 2460-009-510, Electric Power Research Institute, Palo Alto,
California, 1992.
Shafer, G. (1976). A mathematical theory of evidence. New Jersey: Princeton Univ. Press.
Smith, R.I.; Fowler, D.; Sutton, M.A.; Flechard, C.; Coyle, M. Regional estimation of
pollutant gas dry deposition in the UK: model description, sensitivity analyses and
outputs. J. Atmos. Environ. 2000, 34, 3757–3777.
Thomas, S.T.; Kumar, A.; Vangipuram, R.N. Sensitivity analysis of a statistical type long
range transport model. Paper No. 85-5.8. 78th Annual Meeting of Air Pollution
Control Association. June 1985.
Vardoulakis, S.; Fisher, B.E.A.; Gonzalez-Flesca, N.; Pericleous, K. Model sensitivity and
uncertainty analysis using roadside air quality measurements. J. Atmos. Environ.
2002, 36, 2121-2134.
Venkatram, A.; Strimaitis, D.G.; Dicristofaro, D. A semiemperical model to estimate vertical
dispersion of eleveated releases in the stable boundary layer. J. Atmos. Environ.
1984, 18, 923-928
Vuilleumier, L.; Bamer, J.T.; Harley, R.A.; Brown, N.J. Evaluation of nitrogen dioxide
photolysis rates in an urban area using data from the 1997 southern california
ozone study. J. Atmos. Environ. 2001, 35, 6525–6537.
Weil, J.C.; Corio, L.A.; Brower, R.P. A PDF dispersion model for buoyant plumes in the
convective boundary layer. J. Appl Meteorol. 1997, 36, 982-1002.
Willis, G.E.; Deardroff, J.W. A laboratory study of dispersion in the middle of the
convectively mixed layer. J. Atmos. Environ. 1981, 15, 109-117.
Worley, B.A. (1987). Deterministic uncertainty analysis. ORNL-6428. Oak Ridge National
Laboratory, Oak Ridge, Tennessee.
Yang, Y.J.; Wilkinson, J.G.; Russell, A.G. Fast, direct sensitivity analysis of multidimensional
models. J. Environ. Sci. Technol. 1997, 31, 2859–2868.
Yegnan, A.; Williamson, D.G.; Graettinger, A.J. Uncertainty analysis in air dispersion
modeling. J. Environ. Modell. Softw. 2002, 17, 639-649.
Zadeh, L. Fuzzy sets as a basis for a theory of possibility. Fuzzy. Set. Syst. 1978, 1, 3-28.
Nomenclature
C
d
(x,y,z) ground level concentration from the direct source (CBL) (g m
-3
)
C
s
(x,y,z) ground level concentration (SBL) (g m
-3
)
c
p
specific heat at constant pressure (= 1004 J g
-1
K
-1
)
C
D
neutral drag coefficient (cal g
-1
o
C
-1
)
F
b
plume buoyancy flux (m
4
s
3
)
F
y
total horizontal/lateral distribution function (m
-1
)
F
m
plume momentum flux (m
4
s
2
)
f
p
fraction of plume mass contained in CBL = (1 - penetration factor)
(dimensionless)
g acceleration due to gravity (9.81 m s
-2
)
H sensible heat flux (W m
-2
)
H
p
plume centroid height (m)
h
s
stack height corrected for stack tip downwash (m)
h
es
plume rise for the stable source (m)
∆h
d
plume rise for the direct source (m)
∆h
s
plume rise for the stable source (m)
k Von Karman constant k = 0.4 (dimensionless)
l length used in determining the Lagrangian time scale (m)
l
n
neutral length scale – a component of l (m)
l
s
stable length scale – a component of l (m)
L Monin-Obukhov length (m)
m multiple reflections of plume (dimensionless)
N Brunt-Vaisala frequency (s
-1
)
n cloud cover (fractional)
Q source emission rate (g s
-1
)
R solar insolation (W m
-2
)
r
s
stack radius (m)
S skewness factor (dimensionless)
T ambient temperature (
o
K)
T
lzs
vertical lagrangian time scale for the SBL (sec)
T
ref
ambient temperature - at reference temperature height (
o
K)
T
s
stack gas temperature (
o
K)
t time (sec)
∆T difference between stack gas and ambient temperature (K)
u wind speed (m s
-1
)
u
ref
wind speed at reference height (m s
-1
)
u
*
surface friction velocity (m s
-1
)
w
j
mean vertical velocity for the updraft (j = 1) and the downdraft (j = 2)
distributions (m-s
-1
)
w
s
stack exit gas velocity (m-s
-1
)
w
*
convective velocity scale (m-s
-1
)
x downwind distance to a receptor (m)
y receptor location on the y axis
z z
r
and z
p
in the horizontal and terrain following states
z
r
height of the receptor above local source base (m)
Air Quality200
z
p
receptor “flagpole” height - the height of a receptor above local terrain (m)
z
i
mixing height (m): z
i
= MAX [z
ic
; z
im
] in the CBL and z
i
= z
im
in the
SBL
z
ic
convective mixing height (m)
z
ie
equilibrium height of stable boundary layer
z
ieff
height of the reflecting surface in the SBL or in the stable layer above
the CBL (m)
z
im
mechanical mixing height (m)
z
o
surface roughness length (m)
(0.03 m for open flat terrain, grass, few obstacles; 1 m for more obstacles)
z
ref
reference height for wind (m)
θ potential temperature (
o
K)
θ
*
temperature scale (
o
K)
λ
j
weighting coefficient for the updraft (j = 1) and downdraft (j = 2)
distributions
ρ density of air (Kg m
-3
)
σ
v
lateral turbulence (m s
-1
)
σ
wt
total vertical turbulence (m s
-1
)
σ
y
total lateral dispersion parameter for the direct source (m)
σ
z
total vertical dispersion parameter for the direct source (m)
σzas ambient dispersion for the stable source (m)
σzes elevated portion of σzas (m)
σzgs surface portion of σzas (m)
σ
zj
total vertical dispersion for the updrafts and downdrafts
(j=1, 2 respectively)
σ
zs
total dispersion for the stable source (m)
τ time constant controlling the temporal interpolation of zim (sec)
ψ
dj
total height of the direct source plume (i.e. release height + buoyancy +
convection) (m)
β
m
5
height of the direct source plume
Modeling of Ventilation Efciency 201
Modeling of Ventilation Efciency
Mahmoud Farghaly Bady
X
Modeling of Ventilation Efficiency
Mahmoud Farghaly Bady
Assiut University
Egypt
1. Introduction
There are two types of pollution sources: high level sources such as tall stacks and low level
sources such as automobile stacks. With respect to high level sources, Gaussian Plume
Model (GPM) (Chock, 1977 and Kanda, 2006) is usually applied to estimate the pollutant
concentrations, where the obstacles (such as buildings) little influence the diffusion
characteristics of pollutants at such levels. In the case of low-level stacks, it is not
appropriate to estimate the pollutant concentrations using GPM due to the effect of
surrounding obstacles which make the pollutant removal efficiency by the applied wind
vary from location to another in the same domain. In addition, the GPM do not take some
architectural factors such as the form of building, the configuration of building, street
widths, and relative positions of pollution source into account. Therefore, this model is not
generally applicable to the built environment. Practically, in order to predict the
concentration of pollutants in urban space, wind tunnel experiments and CFD simulation
are used to estimate the pollutants concentration for this type of sources.
Many researchers have studied the distribution of pollutants inside urban domains such as
street canyons (Xiaomin et al., 2005; Tsai et al., 2004; Baker et al., 2001; Ahmad et al., 2005 )
and densely built-up areas (Ahmad et al., 2005, Bady et al., 2008). However, based on these
studies, it is thought that the determination of pollutant concentrations alone is insufficient
to obtain a complete picture of the air quality in urban domains. In other words, if the
pollutant source changes, the concentration distributions will also change. In such case, it is
difficult to comprehend the removal capacity of pollutants by the wind within urban
domains. In order to obtain a complete evaluation for the removal efficiency of pollutants by
the natural wind within such domains, other parameters have to be considered in addition
to the concentration. Consequently, there is a need to set an index (or a group of indices)
that completely describes the air quality of the domain. Such index (or indices) may be used
as a guide while designing new areas, or when the evaluation of air quality for urban
domains is needed. At the same time, there is a concept of ventilation efficiency (VE) for
indoor environments, which indicates the removal capacity of pollutants within indoor
domains. This concept is thought to be suitable for evaluating the air quality of urban
domains as well. Indeed, the air flow characteristics within outdoor environments are
different from those of indoor environments as a result of the unsteadiness caused by
fluctuations of wind in both speed and direction. This means that; some additional indices
might be needed to evaluate outdoor air quality due to wind variations. In another study by
9
Air Quality202
our group (Bady et al., 2008), the fluctuations of wind conditions within urban sites is
considered and investigated using the exceedance probability concept. Such probability was
introduced as a parameter or as a measure of the ventilation performance of the applied
wind within a domain when the wind conditions of the site are varying.
The air quality of indoor domains in terms of VE indices has been studied by many
researchers, such as (Sandberg, 1992; Ito et al., 2000; Kato et al., 2003). With respect to
outdoor environments (Uehara et al., 1997) studied experimentally the diffusion of
pollutants emitted from a line source located within an urban street canyon and they
defined a concept similar to purging flow rate (PFR). More recently, it was confirmed that
the ventilation efficiency indices of enclosed environments are also effective in evaluating
the air quality of urban domains, as mentioned by (Huang et al., 2006).
2. Ventilation Efficiency Indices
Before presenting the ventilation efficiency indices, it is worth mentioning the fact that the
distribution of pollutant concentrations in urban areas is not uniform, which represents a
problem when analyzing the removal capacity of pollutants within urban domains. At the
same time, the accuracy of the calculated VE indices depends on the uniformity of the
pollutant generation strength within the considered local domain (local domain is a term
introduced in order to represent a partial zone within the whole urban space such as a
pedestrian zone). Thus, the VE indices were estimated in this study based on average
values.
Ventilation efficiency indices can be evaluated mainly through CFD simulations since they
are principally based on spatial distribution characteristics of pollutants (tracer diffusion).
Until now, it is difficult to use wind tunnel experiments to obtain such indices. The problem
is that the data needed to evaluate the VE indices is very difficult to be obtained through
wind tunnel experiments. For example, to be independent of the source location within the
study domain, a uniform generation rate is required, a condition which is difficult to satisfy
using wind tunnel experiments. Another difficulty is that to calculate the visitation
frequency of the pollutants, the total inflow flux to the study domain is needed which is
difficult to estimate experimentally.
In addition to the above difficulties, there are many problems that reduce the chance of
achieving successful experimental results. These problems include:
1) Symmetrical condition along the sides of the flow field is not easy to satisfy in wind
tunnel experiments due to the lateral flow of wind to the domain.
2) The assumption of steady wind flow is wholly impractical.
3) The assumed boundary layer profile is over-simplistic compared with reality.
4) Fluctuations in the applied wind direction are not considered in the analysis.
These problems make the process of evaluating the VE indices experimentally very difficult.
However, many trials were conducted by the authors of this study to estimate purging flow
rate and visitation frequency experimentally, but unfortunately the results of these
experiments were not readily useable. One way to generate the pollutant uniformly within
the considered domain was through the use of four movable point sources which were
adjusted in a certain manner to cover the total volume of the domain and then applying the
principle of superposition to estimate the domain’s average concentration. This low number
of release points was selected based on the fact that the greater the presence of gas release
points within the domain, the more wind flow characteristics are affected. The behaviour of
the plumes from the four point sources was totally different from those which were emitted
from the whole volume. In addition, the measured data showed that the averaged domain
concentration is quite sensitive to the source location. This led to inaccurate results.
There are different indices such as the age theory (Sandberg, 1983), purging flow rate,
visitation frequency (Kato et al., 2003) and the six indices SVE1-6 (Kato et al., 1992) that are
used to assess the air quality of a room or a domain located within an enclosed
environment. Among these indices, three indices were adopted to implement the present
study, i.e. purging flow rate (PFR), visitation frequency (VF), and pollutant residence time
(TP).
Values of VE indices for a domain are of practical importance in reflecting the effect of the
geometrical characteristics of such domain, i.e. the PFR value for a domain represents the
local ventilation effectiveness of such domain. A small purging flow rate means that this
domain is weakly ventilated. Also, higher values for the visitation frequency and residence
time of pollutants are indications of poor removal efficiency of the pollutants by the applied
wind. In the following section, definitions of the three indices will be explained in details.
2.1 Purging flow rate
The purging flow rate is the most important index for defining the ventilation efficiency of a
local domain. It can be considered as the local ventilation efficiency. For a domain, PFR is
defined as the effective airflow rate required to remove/purge the air pollutants from that
domain (Kato et al., 2003). In other words, the purging flow rate can be considered as the net
rate by which the pollutants are flushed out of the domain. It reflects the capacity at which
the wind removes the pollutant from the domain. The following equation is used to
calculate PFR:
q q
p p
PFR
c c ρ
p
(1)
where:
q
p
denotes pollutant generation rate (kg/s).
c
P
is the domain-averaged concentration (= c×ρ) (kg/m
3
).
ρ is the air density (kg/m
3
).
c is the mass concentration (kg/kg).
It is important to mention that PFR can be defined for a source point, not for the whole
domain, but in this study, it is defined as common to the domain. Moreover, in addition to
average concentrations, PFR can be estimated using the peak concentration of the domain.
In such cases, the calculated PFR reflects dilution properties more than removal properties.
2.2 Visitation frequency
There are many parameters which affect the diffusion characteristics of pollutants within
urban areas. These factors can be related to wind characteristics itself such as wind speed
and direction, and it can be related to the geometry of the urban area such as obstacles
dimensions, obstacles exits, and variable pollutant sources and strengths. So, it is important
to study not only the level of the pollutant concentration but also the pollutant behaviour
within these domains, including how many returns, circulates and stays inside it.
Modeling of Ventilation Efciency 203
our group (Bady et al., 2008), the fluctuations of wind conditions within urban sites is
considered and investigated using the exceedance probability concept. Such probability was
introduced as a parameter or as a measure of the ventilation performance of the applied
wind within a domain when the wind conditions of the site are varying.
The air quality of indoor domains in terms of VE indices has been studied by many
researchers, such as (Sandberg, 1992; Ito et al., 2000; Kato et al., 2003). With respect to
outdoor environments (Uehara et al., 1997) studied experimentally the diffusion of
pollutants emitted from a line source located within an urban street canyon and they
defined a concept similar to purging flow rate (PFR). More recently, it was confirmed that
the ventilation efficiency indices of enclosed environments are also effective in evaluating
the air quality of urban domains, as mentioned by (Huang et al., 2006).
2. Ventilation Efficiency Indices
Before presenting the ventilation efficiency indices, it is worth mentioning the fact that the
distribution of pollutant concentrations in urban areas is not uniform, which represents a
problem when analyzing the removal capacity of pollutants within urban domains. At the
same time, the accuracy of the calculated VE indices depends on the uniformity of the
pollutant generation strength within the considered local domain (local domain is a term
introduced in order to represent a partial zone within the whole urban space such as a
pedestrian zone). Thus, the VE indices were estimated in this study based on average
values.
Ventilation efficiency indices can be evaluated mainly through CFD simulations since they
are principally based on spatial distribution characteristics of pollutants (tracer diffusion).
Until now, it is difficult to use wind tunnel experiments to obtain such indices. The problem
is that the data needed to evaluate the VE indices is very difficult to be obtained through
wind tunnel experiments. For example, to be independent of the source location within the
study domain, a uniform generation rate is required, a condition which is difficult to satisfy
using wind tunnel experiments. Another difficulty is that to calculate the visitation
frequency of the pollutants, the total inflow flux to the study domain is needed which is
difficult to estimate experimentally.
In addition to the above difficulties, there are many problems that reduce the chance of
achieving successful experimental results. These problems include:
1) Symmetrical condition along the sides of the flow field is not easy to satisfy in wind
tunnel experiments due to the lateral flow of wind to the domain.
2) The assumption of steady wind flow is wholly impractical.
3) The assumed boundary layer profile is over-simplistic compared with reality.
4) Fluctuations in the applied wind direction are not considered in the analysis.
These problems make the process of evaluating the VE indices experimentally very difficult.
However, many trials were conducted by the authors of this study to estimate purging flow
rate and visitation frequency experimentally, but unfortunately the results of these
experiments were not readily useable. One way to generate the pollutant uniformly within
the considered domain was through the use of four movable point sources which were
adjusted in a certain manner to cover the total volume of the domain and then applying the
principle of superposition to estimate the domain’s average concentration. This low number
of release points was selected based on the fact that the greater the presence of gas release
points within the domain, the more wind flow characteristics are affected. The behaviour of
the plumes from the four point sources was totally different from those which were emitted
from the whole volume. In addition, the measured data showed that the averaged domain
concentration is quite sensitive to the source location. This led to inaccurate results.
There are different indices such as the age theory (Sandberg, 1983), purging flow rate,
visitation frequency (Kato et al., 2003) and the six indices SVE1-6 (Kato et al., 1992) that are
used to assess the air quality of a room or a domain located within an enclosed
environment. Among these indices, three indices were adopted to implement the present
study, i.e. purging flow rate (PFR), visitation frequency (VF), and pollutant residence time
(TP).
Values of VE indices for a domain are of practical importance in reflecting the effect of the
geometrical characteristics of such domain, i.e. the PFR value for a domain represents the
local ventilation effectiveness of such domain. A small purging flow rate means that this
domain is weakly ventilated. Also, higher values for the visitation frequency and residence
time of pollutants are indications of poor removal efficiency of the pollutants by the applied
wind. In the following section, definitions of the three indices will be explained in details.
2.1 Purging flow rate
The purging flow rate is the most important index for defining the ventilation efficiency of a
local domain. It can be considered as the local ventilation efficiency. For a domain, PFR is
defined as the effective airflow rate required to remove/purge the air pollutants from that
domain (Kato et al., 2003). In other words, the purging flow rate can be considered as the net
rate by which the pollutants are flushed out of the domain. It reflects the capacity at which
the wind removes the pollutant from the domain. The following equation is used to
calculate PFR:
q q
p p
PFR
c c ρ
p
(1)
where:
q
p
denotes pollutant generation rate (kg/s).
c
P
is the domain-averaged concentration (= c×ρ) (kg/m
3
).
ρ is the air density (kg/m
3
).
c is the mass concentration (kg/kg).
It is important to mention that PFR can be defined for a source point, not for the whole
domain, but in this study, it is defined as common to the domain. Moreover, in addition to
average concentrations, PFR can be estimated using the peak concentration of the domain.
In such cases, the calculated PFR reflects dilution properties more than removal properties.
2.2 Visitation frequency
There are many parameters which affect the diffusion characteristics of pollutants within
urban areas. These factors can be related to wind characteristics itself such as wind speed
and direction, and it can be related to the geometry of the urban area such as obstacles
dimensions, obstacles exits, and variable pollutant sources and strengths. So, it is important
to study not only the level of the pollutant concentration but also the pollutant behaviour
within these domains, including how many returns, circulates and stays inside it.
Air Quality204
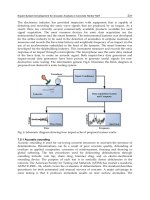
Fig. 1. Pollutant circulation
The index that can describe the pollutant history within a domain is the visitation frequency
VF, which represents the number of times a particle enters the domain and passes through
it. VF = 1 means that after being generated, a particle stays only one time in the domain. VF
= 2 means that a particle stays in the domain for the first time, is transported to the outside
and then returns again to the domain, due to recirculation flow for only one time. A
schematic of pollutant circulation within a domain is illustrated in Fig. 5. In order to
calculate VF, the following equation is applied, as mentioned by (Kato et al., 2003):
P
q
p
q
VF
1
(2)
where:
n
1i
cuuc
i
Aρ
p
Δq
S V
p
q
(3)
where:
∆q
p
is the inflow flux of pollutants into the domain (kg/s).
A
i
is the inflow area of a face i (m
2
).
u is the inflow wind speed (m/s).
c is pollutant concentration at the boundary of the face i (kg/kg).
n is the number of faces subjected to flow.
V is the domain volume (m
3
).
u
is the velocity fluctuation (m/s)
c
is the concentration fluctuation (kg/kg).
uc together with ρA
i
represents the convection part of the inflow flux (kg/s).
cu
together with ρA
i
represents the diffusion part of the inflow flux (kg/s).
S is the uniform generation source strength (kg/m
3
/s).
Visitation frequency can be calculated using the particle tracking method based on Large
Eddy Simulation (LES) or by using the passive pollutant flux method based on the Reynolds
Circulatio
n
Turbulence diffusio
n
Local
domain
Averaged Navier–Stokes (RANS). Although large-eddy simulation (LES) models attract
much interest, their use is restricted because it is computationally expensive. For this reason,
RANS models are widely used in urban flows and dispersion research. In the present study,
calculation of VF based on RANS method was applied.
2.3 Average residence time
One of the most promising parameters being used as an indication of the ventilation
performance is the average residence time of pollutants in a domain. It represents the
average residence times of all particles inside the domain. For one particle, the residence
time is defined as the time the particle takes from once coming (or being generated) into the
domain to its leaving (Kato et al., 2003).
Average residence time of domain pollutants is a measure of the air freshness and thus the
dilution capability of wind inside such domain (Hui et al., 1997). It is calculated according to
the equation:
VFPFR
V
TP
(4)
Applying the principle of average values, the multiplication of the visitation frequency by
the particle residence time (VF × TP) indicates the average residence time of all particles
within the considered domain.
3. Method of calculating the ventilation efficiency indices
Ventilation efficiency indices are estimated using dynamically passive pollutants, which
means that the flow field is not influenced by the pollutants. This makes it possible to
calculate the flow field at first and then this calculated flow field is used in estimating the
VE indices. Thus, the first step is to solve the flow filed. Second, after the flow filed is
calculated, the pollutant concentration is calculated through the solution of the convective-
diffusion equation for a passive scalar (Ferzigere & Peric, 1997):
S
i
x
c
K
i
x
i
x
c
i
ρu
(5)
where:
K is the mass diffusivity coefficient for the concentration (kg/m/s);
x
i
is the Cartesian coordinates (m);
u
i
is the Cartesian components of the velocity (m/s).
A uniform generation rate within the study domain is considered to be independent of the
source location within the domain. In the third step, the pollutant average concentration
within the domain is estimated and PFR is calculated according to Equation (1). Finally, the
total domain inlet flux is calculated and VF is estimated from Equation (2), while TP is
obtained according to Equation (5).
It is worth mentioning here the fact that the numerical simulation for diffusion is sometimes
inaccurate. This can be attributed to two main reasons: insufficient spatial resolution and the
steep concentration gradients that exist within the same calculation domain. These steep
Modeling of Ventilation Efciency 205
Fig. 1. Pollutant circulation
The index that can describe the pollutant history within a domain is the visitation frequency
VF, which represents the number of times a particle enters the domain and passes through
it. VF = 1 means that after being generated, a particle stays only one time in the domain. VF
= 2 means that a particle stays in the domain for the first time, is transported to the outside
and then returns again to the domain, due to recirculation flow for only one time. A
schematic of pollutant circulation within a domain is illustrated in Fig. 5. In order to
calculate VF, the following equation is applied, as mentioned by (Kato et al., 2003):
P
q
p
q
VF
1
(2)
where:
n
1i
cuuc
i
Aρ
p
Δq
S V
p
q
(3)
where:
∆q
p
is the inflow flux of pollutants into the domain (kg/s).
A
i
is the inflow area of a face i (m
2
).
u is the inflow wind speed (m/s).
c is pollutant concentration at the boundary of the face i (kg/kg).
n is the number of faces subjected to flow.
V is the domain volume (m
3
).
u
is the velocity fluctuation (m/s)
c
is the concentration fluctuation (kg/kg).
uc together with ρA
i
represents the convection part of the inflow flux (kg/s).
cu
together with ρA
i
represents the diffusion part of the inflow flux (kg/s).
S is the uniform generation source strength (kg/m
3
/s).
Visitation frequency can be calculated using the particle tracking method based on Large
Eddy Simulation (LES) or by using the passive pollutant flux method based on the Reynolds
Circulatio
n
Turbulence diffusio
n
Local
domain
Averaged Navier–Stokes (RANS). Although large-eddy simulation (LES) models attract
much interest, their use is restricted because it is computationally expensive. For this reason,
RANS models are widely used in urban flows and dispersion research. In the present study,
calculation of VF based on RANS method was applied.
2.3 Average residence time
One of the most promising parameters being used as an indication of the ventilation
performance is the average residence time of pollutants in a domain. It represents the
average residence times of all particles inside the domain. For one particle, the residence
time is defined as the time the particle takes from once coming (or being generated) into the
domain to its leaving (Kato et al., 2003).
Average residence time of domain pollutants is a measure of the air freshness and thus the
dilution capability of wind inside such domain (Hui et al., 1997). It is calculated according to
the equation:
VFPFR
V
TP
(4)
Applying the principle of average values, the multiplication of the visitation frequency by
the particle residence time (VF × TP) indicates the average residence time of all particles
within the considered domain.
3. Method of calculating the ventilation efficiency indices
Ventilation efficiency indices are estimated using dynamically passive pollutants, which
means that the flow field is not influenced by the pollutants. This makes it possible to
calculate the flow field at first and then this calculated flow field is used in estimating the
VE indices. Thus, the first step is to solve the flow filed. Second, after the flow filed is
calculated, the pollutant concentration is calculated through the solution of the convective-
diffusion equation for a passive scalar (Ferzigere & Peric, 1997):
S
i
x
c
K
i
x
i
x
c
i
ρu
(5)
where:
K is the mass diffusivity coefficient for the concentration (kg/m/s);
x
i
is the Cartesian coordinates (m);
u
i
is the Cartesian components of the velocity (m/s).
A uniform generation rate within the study domain is considered to be independent of the
source location within the domain. In the third step, the pollutant average concentration
within the domain is estimated and PFR is calculated according to Equation (1). Finally, the
total domain inlet flux is calculated and VF is estimated from Equation (2), while TP is
obtained according to Equation (5).
It is worth mentioning here the fact that the numerical simulation for diffusion is sometimes
inaccurate. This can be attributed to two main reasons: insufficient spatial resolution and the
steep concentration gradients that exist within the same calculation domain. These steep
Air Quality206
gradients are explained as follows: upwind of a source, the pollutant concentration is zero,
while in the region closest to the source; the concentration is at a maximum and decreases as
the plume travels downwind of the source. Accordingly, there is a significant variation
occur in the concentration values between adjacent cells which lead to steep concentration
gradients. To overcome these two problems, a huge number of cells is needed to produce
gradual concentration gradients, which is computationally expensive. In this study, in order
to overcome the problem of insufficient spatial resolution, a grid-convergence analysis has
been carried out during the design of the mesh systems of the building models and in each
case; a reasonable number of grids was attained.
Another important matter to be mentioned here relates to the diffusivity coefficient K which
is a function of the turbulent Schmidt number (K = ν
t
/ Sc
t
). It is known that the value of Sc
t
is not constant and varies from one location to another within the same calculation domain.
In high concentration regions –which means high concentration gradients– the turbulent
Schmidt number is less than one, while in low concentration regions –which means that the
mixing of pollutants with ambient fluid is almost finished– its value is sometimes greater
than one. This means that the diffusivity coefficient is not equal to the eddy diffusivity of the
momentum. However, in this work, Sc
t
is assumed to be constant. This assumption has been
applied in many of the previous studies (Xiaomin et al. 2005; Tsai et al., 2004). The authors
consider that this simplification is accepted at this stage of the research.
4. Numerical simulations
Numerical simulations for wind environments in urban areas were performed using CFD
code STAR-CD. The standard k-ε model was considered to simulate the turbulence effects.
Steady-state analysis was adopted, and the Monotone Advection and Reconstruction
Scheme (MARS) was applied to the spatial difference (He et al., 1997).
At the inflow boundary, the turbulent kinetic energy was set to be constant as given by
Equation (6), while the turbulent dissipation rate was calculated according to Equation (7),
which arises from the assumption of local equilibrium (Lien et al., 2004).
2
I u 1.5k
z
u
k
1/2
μ
Cε
(6)
(7)
where k is the turbulent kinetic energy (m
2
/s
2
), I is the turbulent intensity of the applied
flow, and C
μ
is a constant (= 0.09).
Free slip condition was applied to the top and side boundaries. The logarithmic law with the
parameter E = 9 was applied to the boundaries at ground level; (i.e. streets and traffic roads)
and for building walls, as smooth surfaces. Table (1) summarizes all parameters used in the
simulations together with the applied boundary conditions.
Turbulent Model The standard k-ε model
Differential scheme MARS scheme [18]
Inflow conditions
0.09
μ
C ,
z
u
k
μ
Cε
I) (u 1.5k
m 74.6z & m/s 1u ,(z/zuu
1/2
2
oo
0.25
o
o
)
Sides and sky Free slip
Building walls and ground Generalized logarithmic law
Table 1. CFD simulation parameters together with applied boundary conditions
5. Examples of Applying the Ventilation Efficiency Indices
Urban street width and street building heights are considered the most important
parameters in controlling the air quality of the pedestrian level domain (Bady et al., 2008).
Also, the arrangement of building arrays within urban areas is very important in controlling
the air quality of the pedestrian level domains by enhancing more wind to these domains.
Thus, it is worth investigating the effects of these parameters on the air quality of urban
domains in terms of the ventilation efficiency indices, in a way that explains the method of
applying such indices. Indeed, there are other parameters which may influence the air
quality of urban domains such as wind direction, wind velocity, and building roof
geometry, etc., but in the present study only the above parameters are considered.
A wind environment containing two buildings of dimensions 5 (L) 25 (W) (H) m, was
simulated and a street was considered to have one building on each side. The study domain
has the dimensions (D × 10 × H) and occupies the mid-third of the whole domain of the
street. An isometric view of the model configurations is presented in Fig. 2, while Fig. 3
shows the wind flow domain around the buildings together with the applied boundary
conditions.
Fig. 2. Building model.
D
Calculation domain
(
D
x 10 x H
)
5 m
10 m
z
x
y
H
W =25 m
Flow
Modeling of Ventilation Efciency 207
gradients are explained as follows: upwind of a source, the pollutant concentration is zero,
while in the region closest to the source; the concentration is at a maximum and decreases as
the plume travels downwind of the source. Accordingly, there is a significant variation
occur in the concentration values between adjacent cells which lead to steep concentration
gradients. To overcome these two problems, a huge number of cells is needed to produce
gradual concentration gradients, which is computationally expensive. In this study, in order
to overcome the problem of insufficient spatial resolution, a grid-convergence analysis has
been carried out during the design of the mesh systems of the building models and in each
case; a reasonable number of grids was attained.
Another important matter to be mentioned here relates to the diffusivity coefficient K which
is a function of the turbulent Schmidt number (K = ν
t
/ Sc
t
). It is known that the value of Sc
t
is not constant and varies from one location to another within the same calculation domain.
In high concentration regions –which means high concentration gradients– the turbulent
Schmidt number is less than one, while in low concentration regions –which means that the
mixing of pollutants with ambient fluid is almost finished– its value is sometimes greater
than one. This means that the diffusivity coefficient is not equal to the eddy diffusivity of the
momentum. However, in this work, Sc
t
is assumed to be constant. This assumption has been
applied in many of the previous studies (Xiaomin et al. 2005; Tsai et al., 2004). The authors
consider that this simplification is accepted at this stage of the research.
4. Numerical simulations
Numerical simulations for wind environments in urban areas were performed using CFD
code STAR-CD. The standard k-ε model was considered to simulate the turbulence effects.
Steady-state analysis was adopted, and the Monotone Advection and Reconstruction
Scheme (MARS) was applied to the spatial difference (He et al., 1997).
At the inflow boundary, the turbulent kinetic energy was set to be constant as given by
Equation (6), while the turbulent dissipation rate was calculated according to Equation (7),
which arises from the assumption of local equilibrium (Lien et al., 2004).
2
I u 1.5k
z
u
k
1/2
μ
Cε
(6)
(7)
where k is the turbulent kinetic energy (m
2
/s
2
), I is the turbulent intensity of the applied
flow, and C
μ
is a constant (= 0.09).
Free slip condition was applied to the top and side boundaries. The logarithmic law with the
parameter E = 9 was applied to the boundaries at ground level; (i.e. streets and traffic roads)
and for building walls, as smooth surfaces. Table (1) summarizes all parameters used in the
simulations together with the applied boundary conditions.
Turbulent Model The standard k-ε model
Differential scheme MARS scheme [18]
Inflow conditions
0.09
μ
C ,
z
u
k
μ
Cε
I) (u 1.5k
m 74.6z & m/s 1u ,(z/zuu
1/2
2
oo
0.25
o
o
)
Sides and sky Free slip
Building walls and ground Generalized logarithmic law
Table 1. CFD simulation parameters together with applied boundary conditions
5. Examples of Applying the Ventilation Efficiency Indices
Urban street width and street building heights are considered the most important
parameters in controlling the air quality of the pedestrian level domain (Bady et al., 2008).
Also, the arrangement of building arrays within urban areas is very important in controlling
the air quality of the pedestrian level domains by enhancing more wind to these domains.
Thus, it is worth investigating the effects of these parameters on the air quality of urban
domains in terms of the ventilation efficiency indices, in a way that explains the method of
applying such indices. Indeed, there are other parameters which may influence the air
quality of urban domains such as wind direction, wind velocity, and building roof
geometry, etc., but in the present study only the above parameters are considered.
A wind environment containing two buildings of dimensions 5 (L) 25 (W) (H) m, was
simulated and a street was considered to have one building on each side. The study domain
has the dimensions (D × 10 × H) and occupies the mid-third of the whole domain of the
street. An isometric view of the model configurations is presented in Fig. 2, while Fig. 3
shows the wind flow domain around the buildings together with the applied boundary
conditions.
Fig. 2. Building model.
D
Calculation domain
(
D
x 10 x H
)
5 m
10 m
z
x
y
H
W =25 m
Flow
Air Quality208
Fig. 3. Calculation conditions and boundary conditions of the wind flow domain.
5.1 Effect of street width (D)
Effects of varying the street width (D) on the wind flow patterns and ventilation efficiency
indices are displayed in Figs. 4-7. Figure 4 shows the wind flow field within the mid section
of the street for four selected cases of D/H (i.e. D/H = 0.6, 1.0, 1.5 and 2.0).
In the subplot (a), nearly there is no vortex circulation occurred inside the domain which is
reflected in a small rotating speed which in turn leads to difficulty in removing the
pollutants out of the domain. In Fig 4(b), a small vortex circulation covers the upper right
hand side of the domain was generated. The domain average wind speed in this case is
greater than that of case (a), which was resulted in a lower average concentration compared
with the previous case. In the cases of D/H = 1.5 and 2.0 which are illustrated in Figs. 4(c)
and (d), clockwise vortex circulations are generated within the domain when the wind is
blown across the shear layer at the buildings height level. These vortices have large rotating
velocities and hence transport the pollutant outside the domain from the windward side of
the buildings.
Sky: slip
Slip
Slip
25 m
Buildings height = 2 10 m
W = 120 m
D = 6 20 m
Calculation
domain
120 350 m
Ground: log-law
y
x
Building walls: lo
g
-law
(a)
(b)
(c)
(d)
Fig. 4. Influence of street width on the wind flow pattern within the domain (y/W = 0.5)
(a) D/H = 0.6 (b) D/H = 1.0 (c) D/H = 1.5 (d) D/H = 2.0
x
z
Modeling of Ventilation Efciency 209
Fig. 3. Calculation conditions and boundary conditions of the wind flow domain.
5.1 Effect of street width (D)
Effects of varying the street width (D) on the wind flow patterns and ventilation efficiency
indices are displayed in Figs. 4-7. Figure 4 shows the wind flow field within the mid section
of the street for four selected cases of D/H (i.e. D/H = 0.6, 1.0, 1.5 and 2.0).
In the subplot (a), nearly there is no vortex circulation occurred inside the domain which is
reflected in a small rotating speed which in turn leads to difficulty in removing the
pollutants out of the domain. In Fig 4(b), a small vortex circulation covers the upper right
hand side of the domain was generated. The domain average wind speed in this case is
greater than that of case (a), which was resulted in a lower average concentration compared
with the previous case. In the cases of D/H = 1.5 and 2.0 which are illustrated in Figs. 4(c)
and (d), clockwise vortex circulations are generated within the domain when the wind is
blown across the shear layer at the buildings height level. These vortices have large rotating
velocities and hence transport the pollutant outside the domain from the windward side of
the buildings.
Sky: slip
Slip
Slip
25 m
Buildings height = 2
10 m
W = 120 m
D = 6 20 m
Calculation
domain
120 350 m
Ground: log-law
y
x
Building walls: lo
g
-law
(a)
(b)
(c)
(d)
Fig. 4. Influence of street width on the wind flow pattern within the domain (y/W = 0.5)
(a) D/H = 0.6 (b) D/H = 1.0 (c) D/H = 1.5 (d) D/H = 2.0
x
z
Air Quality210
(a)
(b)
(c)
(d)
Fig. 5. Concentration fields for different widths of the street domain (y/W = 0.5).
(a) D/H = 0.6 (b) D/H = 1.0 (c) D/H = 1.5 (d) D/H = 2.0
kg/kg
0.1500
0.1393
0.1286
0.1179
0.1071
0.0964
0.0857
0.0750
0.0642
0.0535
0.0428
0.0321
0.0214
0.0107
0.0000
x
z
Figure 5 shows the concentration fields within the study domain for the same values of
D/H. The figure shows that the level of pollutants within the domain was decrease as D
increased, due to the variation of the wind flow characteristics within the street domain with
the variation of its width as explained above. Also, the figure shows that the size of the
region of influence (Mfula et al., 2005) at which the pollutants disperse becomes larger as the
street widens. The wide spread of such region is referred to the increase of the circulation
strength (which is generated inside the domain), which improves the wind removal
efficiency for purging the pollutants towards the domain exit (Bady et al., 2008).
Effect of street width on the average concentration within the domain is shown in Fig. 6.
From this figure, it is obvious that the increase of D has a desirable effect on the
concentration, since the concentration decreases as the street widens.
As the street width becomes 20 m (i.e. D/H = 2.0), the concentration level was reduced by
about 50 % of its value at D/H = 0.6. This note reflects the fact that the street width is very
important parameter in controlling the air quality of urban domains. However, increasing
the widths of urban streets depends primarily on the space availability of the construction
sites.
0.00
0.05
0.10
0.15
0.20
0.6 0.8 1.0 1.2 1.4 1.6 1.8 2.0
C
p
(kg/m
3
)
D / H
Fig. 6. Effect of street width D on the domain averaged concentration.
Figure 7 shows the influence of D on the wind removal efficiency for the domain’s
pollutants in terms of the ventilation efficiency indices. The figure shows the normalized
PFR and also the air exchange rate which represents the rate at which the total volume of air
inside the study domain is replaced with fresh air (AER is calculated through dividing PFR
by the volume of the corresponding domain, AER = PFR/V).
As mentioned previously, PFR represents how much fresh air is supplied to the domain
which means that PFR has strong dependence on the domain size. Consequently, it is
expected that increasing the domain volume increases PFR. This conclusion agrees exactly
with the simulation result as shown in Fig. 7, where PFR increases in nearly a linear way
with the domain volume.
Modeling of Ventilation Efciency 211
(a)
(b)
(c)
(d)
Fig. 5. Concentration fields for different widths of the street domain (y/W = 0.5).
(a) D/H = 0.6 (b) D/H = 1.0 (c) D/H = 1.5 (d) D/H = 2.0
kg/kg
0.1500
0.1393
0.1286
0.1179
0.1071
0.0964
0.0857
0.0750
0.0642
0.0535
0.0428
0.0321
0.0214
0.0107
0.0000
x
z
Figure 5 shows the concentration fields within the study domain for the same values of
D/H. The figure shows that the level of pollutants within the domain was decrease as D
increased, due to the variation of the wind flow characteristics within the street domain with
the variation of its width as explained above. Also, the figure shows that the size of the
region of influence (Mfula et al., 2005) at which the pollutants disperse becomes larger as the
street widens. The wide spread of such region is referred to the increase of the circulation
strength (which is generated inside the domain), which improves the wind removal
efficiency for purging the pollutants towards the domain exit (Bady et al., 2008).
Effect of street width on the average concentration within the domain is shown in Fig. 6.
From this figure, it is obvious that the increase of D has a desirable effect on the
concentration, since the concentration decreases as the street widens.
As the street width becomes 20 m (i.e. D/H = 2.0), the concentration level was reduced by
about 50 % of its value at D/H = 0.6. This note reflects the fact that the street width is very
important parameter in controlling the air quality of urban domains. However, increasing
the widths of urban streets depends primarily on the space availability of the construction
sites.
0.00
0.05
0.10
0.15
0.20
0.6 0.8 1.0 1.2 1.4 1.6 1.8 2.0
C
p
(kg/m
3
)
D / H
Fig. 6. Effect of street width D on the domain averaged concentration.
Figure 7 shows the influence of D on the wind removal efficiency for the domain’s
pollutants in terms of the ventilation efficiency indices. The figure shows the normalized
PFR and also the air exchange rate which represents the rate at which the total volume of air
inside the study domain is replaced with fresh air (AER is calculated through dividing PFR
by the volume of the corresponding domain, AER = PFR/V).
As mentioned previously, PFR represents how much fresh air is supplied to the domain
which means that PFR has strong dependence on the domain size. Consequently, it is
expected that increasing the domain volume increases PFR. This conclusion agrees exactly
with the simulation result as shown in Fig. 7, where PFR increases in nearly a linear way
with the domain volume.
Air Quality212
The second index of the ventilation efficiency indices is the visitation frequency. Figure 7(c)
shows that, increasing the width of the street decreases the visitation frequency of the
pollutants to it. The trend of VF can be interpreted as follows: the increase of D increases the
area subjected to the inlet flux from the boundaries of the domain, which increases the
domain inlet fluxes. As a first thinking, increasing the total inlet flux is expected to increase
the value of VF as given by Equation (2). This conclusion is not absolutely true because the
value of VF depends on the value of the inlet flux as well as the value of the domain volume.
The ratio between these two quantities determines the value of VF.
Regarding the residence time of pollutants, Fig. 7(d) shows that the greater the street width,
the smaller the time the pollutants stay within the domain. This behaviour is referred to the
increased purging capability of the domain wind for pushing the pollutants towards the
outside as its volume increases, which reduces the time it takes towards the exit.
The above results for the VE indices supported absolutely that increasing urban streets widths
purposefully reduces the air pollution levels (and hence improves the air quality) in the most
heavily used streets by enhancing ventilation from the prevailing winds (Bady et al., 2008).
(a)
(b)
0
5
10
15
20
25
30
0.6 0.8 1.0 1.2 1.4 1.6 1.8 2.0
PFR (m
3
/s)
D /
H
0.0
0.5
1.0
1.5
2.0
0.6 0.8 1.0 1.2 1.4 1.6 1.8 2.0
Air exchange rate (1/h)×100
D / H
(c)
(d)
Fig. 7. Effect of street width on the VE indices within the study domain (H = 10 m).
(a) Purging flow rate; (b) Air exchange rate; (c) Visitation frequency; (d) Residence time
5.2 Effect of street buildings height (H)
The other parameter that affects the air flow characteristics in urban domain is the height of
street buildings. Figure 8 displays the configuration of the velocity field for four selected
cases of H/D (D = 5 m). It can be observed that, as the buildings height increases, a large
clockwise vortex circulation is generated along the void between the buildings. The airflow
at the center of the vortex circulation is slow and it becomes faster when it approaches the
wall of the buildings and the ground level. Changing the height H affects the characteristics
of the vortex circulation inside the domain, which in turn affects the diffusion process of the
pollutants.
0
20
40
60
80
100
0.6 0.8 1.0 1.2 1.4 1.6 1.8 2.0
TP (s)
D / H
0.0
0.5
1.0
1.5
2.0
2.5
0.6 0.8 1.0 1.2 1.4 1.6 1.8 2.0
VF
D / H
Modeling of Ventilation Efciency 213
The second index of the ventilation efficiency indices is the visitation frequency. Figure 7(c)
shows that, increasing the width of the street decreases the visitation frequency of the
pollutants to it. The trend of VF can be interpreted as follows: the increase of D increases the
area subjected to the inlet flux from the boundaries of the domain, which increases the
domain inlet fluxes. As a first thinking, increasing the total inlet flux is expected to increase
the value of VF as given by Equation (2). This conclusion is not absolutely true because the
value of VF depends on the value of the inlet flux as well as the value of the domain volume.
The ratio between these two quantities determines the value of VF.
Regarding the residence time of pollutants, Fig. 7(d) shows that the greater the street width,
the smaller the time the pollutants stay within the domain. This behaviour is referred to the
increased purging capability of the domain wind for pushing the pollutants towards the
outside as its volume increases, which reduces the time it takes towards the exit.
The above results for the VE indices supported absolutely that increasing urban streets widths
purposefully reduces the air pollution levels (and hence improves the air quality) in the most
heavily used streets by enhancing ventilation from the prevailing winds (Bady et al., 2008).
(a)
(b)
0
5
10
15
20
25
30
0.6 0.8 1.0 1.2 1.4 1.6 1.8 2.0
PFR (m
3
/s)
D /
H
0.0
0.5
1.0
1.5
2.0
0.6 0.8 1.0 1.2 1.4 1.6 1.8 2.0
Air exchange rate (1/h)×100
D / H
(c)
(d)
Fig. 7. Effect of street width on the VE indices within the study domain (H = 10 m).
(a) Purging flow rate; (b) Air exchange rate; (c) Visitation frequency; (d) Residence time
5.2 Effect of street buildings height (H)
The other parameter that affects the air flow characteristics in urban domain is the height of
street buildings. Figure 8 displays the configuration of the velocity field for four selected
cases of H/D (D = 5 m). It can be observed that, as the buildings height increases, a large
clockwise vortex circulation is generated along the void between the buildings. The airflow
at the center of the vortex circulation is slow and it becomes faster when it approaches the
wall of the buildings and the ground level. Changing the height H affects the characteristics
of the vortex circulation inside the domain, which in turn affects the diffusion process of the
pollutants.
0
20
40
60
80
100
0.6 0.8 1.0 1.2 1.4 1.6 1.8 2.0
TP (s)
D / H
0.0
0.5
1.0
1.5
2.0
2.5
0.6 0.8 1.0 1.2 1.4 1.6 1.8 2.0
VF
D / H
Air Quality214
(a)
(b)
(c)
(d)
Fig. 8. Influence of building height on the flow pattern within the domain (y/W = 0.5)
(a) H/D = 0.4 (b) H/D = 0.6 (c) H/D = 0.8 (d) H/D = 1.0
Figure 9 shows the concentration fields inside the street at different values of H. In the
subplot (a), the pollutant in the study domain is well dispersed and diluted, and the
concentration value in such case is the lowest among the four cases. When H increases as
shown in the subplots (b) and (d) (i.e. H/D = 0.6 and 0.8), the pollutant dispersion is limited
and high concentration zones are observed within the study domain. With the further
increased H (i.e. H/D = 1.0), the high concentration zone increased and covered a large area
between the two buildings.
(a)
(b)
(c)
(d)
Fig. 9. Concentration fields for different heights of the street buildings (y/W = 0.5).
(a) H/D = 0.4 (b) H/D = 0.6 (c) H/D = 0.8 (d) H/D = 1.0
Modeling of Ventilation Efciency 215
(a)
(b)
(c)
(d)
Fig. 8. Influence of building height on the flow pattern within the domain (y/W = 0.5)
(a) H/D = 0.4 (b) H/D = 0.6 (c) H/D = 0.8 (d) H/D = 1.0
Figure 9 shows the concentration fields inside the street at different values of H. In the
subplot (a), the pollutant in the study domain is well dispersed and diluted, and the
concentration value in such case is the lowest among the four cases. When H increases as
shown in the subplots (b) and (d) (i.e. H/D = 0.6 and 0.8), the pollutant dispersion is limited
and high concentration zones are observed within the study domain. With the further
increased H (i.e. H/D = 1.0), the high concentration zone increased and covered a large area
between the two buildings.
(a)
(b)
(c)
(d)
Fig. 9. Concentration fields for different heights of the street buildings (y/W = 0.5).
(a) H/D = 0.4 (b) H/D = 0.6 (c) H/D = 0.8 (d) H/D = 1.0
Air Quality216
Figure 10 shows the effect of increasing the street buildings height H on the air quality
parameters. As shown, the average concentration increases as the height of the buildings
increases which in turn decreases the air exchange rate within the domain. Such effect is
attributed to the fact that; increasing the height H weakens the street wind and decreases its
ability to purge the pollutants outside the domain as illustrated in Fig. 10; in other words,
the pollutants were trapped along the lower part of the domain. The figure shows also that
the greater H, the greater the VF values. This can be referred to the increased domain inlet
flux with increasing H. Also, the figure shows that the values of VF are greater than one
which means that the return or circulation of pollutants is confirmed in the study domain.
The relation between the residence time and the building height H is illustrated also in Fig.
10, in which TP increases with the increase of H. This behaviour reflects bad removal
efficiency of the wind inside the domain due to the lower vortex strength as the street
buildings height increases.
(a)
(b)
0.00
0.05
0.10
0.15
0.20
0.3 0.4 0.5 0.6 0.7 0.8 0.9 1.0 1.1
C
p
(kg/m
3
)
H / D
0.0
0.5
1.0
1.5
2.0
2.5
0.3 0.4 0.5 0.6 0.7 0.8 0.9 1.0 1.1
Air exchange rate (1/h)×100
H / D
(c)
(d)
Fig. 10. Effect of street building’s height on the air quality parameters within the study
domain (D = 5 m); (a) Domain averaged concentration, (b) Air exchange rate, (c) Visitation
frequency, (b) Average residence time
5.3 Effect of wind direction
Figure 11 presents the wind vector fields for the five inlet wind directions. According to the
incident wind direction, simulated flows can be classified into three patterns regarding the
characteristics of the flow circulation generated behind the upwind building (Kim et al., 2004).
The first flow pattern appears when the inlet wind angle is 0
o
. In such case, the horizontal
distribution of the wind vector shows symmetric separation located at each lateral side of the
upwind building. The figure shows that, there is apparently no motion in the y-direction
which reflects a bad removal efficiency of the domain local wind against the pollutant.
The second pattern appears when the flowing wind angle is located in the range 0
o
< θ < 90
o
.
This pattern appears in the cases of θ = 30
o
, 45
o
, 60
o
in the above figure. For such pattern,
0.0
0.4
0.8
1.2
1.6
2.0
0.3 0.4 0.5 0.6 0.7 0.8 0.9 1.0 1.1
VF
H / D
0
20
40
60
80
100
0.3 0.4 0.5 0.6 0.7 0.8 0.9 1.0 1.1
TP (s)
H / D
Modeling of Ventilation Efciency 217
Figure 10 shows the effect of increasing the street buildings height H on the air quality
parameters. As shown, the average concentration increases as the height of the buildings
increases which in turn decreases the air exchange rate within the domain. Such effect is
attributed to the fact that; increasing the height H weakens the street wind and decreases its
ability to purge the pollutants outside the domain as illustrated in Fig. 10; in other words,
the pollutants were trapped along the lower part of the domain. The figure shows also that
the greater H, the greater the VF values. This can be referred to the increased domain inlet
flux with increasing H. Also, the figure shows that the values of VF are greater than one
which means that the return or circulation of pollutants is confirmed in the study domain.
The relation between the residence time and the building height H is illustrated also in Fig.
10, in which TP increases with the increase of H. This behaviour reflects bad removal
efficiency of the wind inside the domain due to the lower vortex strength as the street
buildings height increases.
(a)
(b)
0.00
0.05
0.10
0.15
0.20
0.3 0.4 0.5 0.6 0.7 0.8 0.9 1.0 1.1
C
p
(kg/m
3
)
H / D
0.0
0.5
1.0
1.5
2.0
2.5
0.3 0.4 0.5 0.6 0.7 0.8 0.9 1.0 1.1
Air exchange rate (1/h)×100
H / D
(c)
(d)
Fig. 10. Effect of street building’s height on the air quality parameters within the study
domain (D = 5 m); (a) Domain averaged concentration, (b) Air exchange rate, (c) Visitation
frequency, (b) Average residence time
5.3 Effect of wind direction
Figure 11 presents the wind vector fields for the five inlet wind directions. According to the
incident wind direction, simulated flows can be classified into three patterns regarding the
characteristics of the flow circulation generated behind the upwind building (Kim et al., 2004).
The first flow pattern appears when the inlet wind angle is 0
o
. In such case, the horizontal
distribution of the wind vector shows symmetric separation located at each lateral side of the
upwind building. The figure shows that, there is apparently no motion in the y-direction
which reflects a bad removal efficiency of the domain local wind against the pollutant.
The second pattern appears when the flowing wind angle is located in the range 0
o
< θ < 90
o
.
This pattern appears in the cases of θ = 30
o
, 45
o
, 60
o
in the above figure. For such pattern,
0.0
0.4
0.8
1.2
1.6
2.0
0.3 0.4 0.5 0.6 0.7 0.8 0.9 1.0 1.1
VF
H / D
0
20
40
60
80
100
0.3 0.4 0.5 0.6 0.7 0.8 0.9 1.0 1.1
TP (s)
H / D