Báo cáo toán học: " Exploiting periodicity to extract the atrial activity in atrial arrhythmias" doc
Bạn đang xem bản rút gọn của tài liệu. Xem và tải ngay bản đầy đủ của tài liệu tại đây (538.61 KB, 16 trang )
RESEARCH Open Access
Exploiting periodicity to extract the atrial activity
in atrial arrhythmias
Raul Llinares
*
and Jorge Igual
Abstract
Atrial fibrillation disorders are one of the main arrhythmias of the elderly. The atrial and ventricular activities are
decoupled during an atrial fibrillation episode, and very rapid and irregular waves replace the usual atrial P-wave in
a normal sinus rhythm electrocardiogram (ECG). The estimation of these wavelets is a must for clinical analysis. We
propose a new approach to this problem focused on the quasiperiodicity of these wavelets. Atrial activity is
characterized by a main atrial rhythm in the interval 3-12 Hz. It enables us to establish the problem as the
separation of the original sources from the instantaneous linear combination of them recorded in the ECG or the
extraction of only the atrial component exploiting the quasiperiodic feature of the atrial signal. This methodology
implies the previous estimation of such main atrial period. We present two algorithms that separate and extract
the atrial rhythm starting from a prior estimation of the main atrial frequency. The first one is an algebraic method
based on the maximization of a cost function that measures the periodicity. The other one is an adaptive
algorithm that exploits the decorrelation of the atrial and other signals diagonalizing the correlation matrices at
multiple lags of the period of atrial activity. The algorithms are applied successfully to synthetic and real data. In
simulated ECGs, the average correlation index obtained was 0.811 and 0.847, respectively. In real ECGs, the
accuracy of the results was validated using spectral and temporal parameters. The average peak frequency and
spectral concentration obtained were 5.550 and 5.554 Hz and 56.3 and 54.4%, respectively, and the kurtosis was
0.266 and 0.695. For validation purposes, we compared the proposed algorithms with established methods,
obtaining better results for simulated and real registers.
Keywords: Source separation, Electrocardiogram, Atrial fibrillation, Periodic component analysis, Second-order
statistics
1 Introduction
In biomedical signal processing, da ta are recorded with
the most appropriate technology in order to optimize
the study and analysis of a clinically interesting applica-
tion. Depending on the different nature of the underly-
ing physics and the corresponding signals, diverse
information is obtained such as electrical and magnetic
fields, electromagnetic radiation (visible, X-ray), chemi-
cal concentrations or acoustic signals just to name some
of the most popular. In many of these different applica-
tions, for example, the ones based on biopotentials, such
as electro- and magnetoencephalogram, electromyogram
or electrocardiogram (ECG), it is usual to consider the
observations as a linear combination of different kinds
of biological signals, in addition to some artifacts and
noise due to the recording system. This is the case of
atrial tachyarrhythmias, such as atrial fibrillation (AF) or
atrial flutter ( AFL), where the atrial and the ventricular
activity can be considered as signals generated by inde-
pendent bioelectric sources mixed in the ECG together
with other ancillary sources [1].
AF is the most common arrhythmia encountered in
clinical practice. I ts study has received and continues
receiving considerable research interest. According to
statistics, AF affects 0.4% of the general population, but
the probability of developing it rises with age, less than
1% for people under 60 years of age and greater than
6% in those over 80 year s [2]. The diagnosis and treat-
ment of these arrhythmias can be enriched by the infor-
mation provided by the electrical signal generated in the
atria (f-waves) [3]. Frequency [4] and time-frequency
* Correspondence:
Departamento de Comunicaciones, Universidad Politécnica de Valencia,
Camino de Vera s/n, 46022 Valencia, Spain
Llinares and Igual EURASIP Journal on Advances in Signal Processing 2011, 2011:134
/>© 2011 Llinares and Igual; licensee Springer. This is an Open Access article distributed under the terms of the Creative Commons
Attribution License (http://creativecom mons.org/licenses/by/2.0), w hich permits unrestricted use, distribution, and repro duction in
any medium, provided the original work is properly cited.
analysis [5] of these f-waves can be used for the identifi-
cation of underlying AF mechanisms and prediction o f
therapy efficacy. In particular, the fibrillatory rate has
primary importance in AF spontaneous behavior [6],
response to therapy [7] or cardioversion [8]. The atrial
fibrillatory frequency (or rate) can reliably be assessed
from the surface ECG using digital signal processing:
firstly, extracting the atrial signal and then, carrying out
a spectral analysis.
There are two main methodologies to obtain the at rial
signal. The first one is based on t he cancellation of the
QRST complexes. An established method for QRST
cancellation consists of a spatiotemporal signal model
that accounts for dynamic changes in QRS morphology
caused, for example, by variations in the electrical axis
of the heart [9]. The other appr oach involves the
decomposition of the ECG as a linear combination of
different source signals [10]; in this case, it can be con-
sideredasablindsourceseparation(BSS)problem,
where the source vector includes the atrial, ventricular
and ancillary sources and the mixture is the ECG
recording. The problem has been solved previously
using independent component analysis (ICA), see [1,11].
ICA methods are blind, that is, they do not impose any-
thing on the linear combination but the statistical inde-
pendence. In addition, the ICA algorithms based on
higher-order statistics need the signals to be non-Gaus-
sian, with the possible exception of one component.
When these restrictions are not satisfied, BSS can still
be carried out using only second-order statistics, in this
case the restriction being sources with different spectra,
allowing the separation of more than one Gaussian
component.
Regardlessofwhethersecond-orhigher-orderstatis-
tics are used, BS S methods usually assume that the
available information about the problem is minimum,
perhaps the number of components (dimensions of the
problem), the kind of combination (linear or not, with
or without additive noise, instantaneous or convolutive,
real or complex mixtures), or some restrictions to fix
the inherent indeterminacies about sign, amplitude and
order in the recovered sources. However, it is more rea-
listic to consider that we have some prior information
about the nature of the signals and the way they are
mixed before obtaining the multidimensional recording.
One of the most common types of prior information
in many of the applications involving the ECG is that
the biopotentials have a periodic behavior. For exampl e,
in cardiology, we can assume the periodi city of the
heartbeat when re cording a he althy electrocardiogram
ECG. Obviously, depending on the disease under study,
this assumption applies or not, but although the exact
periodic assumption can be very restric tive, a quasiper-
iodic behavior can still be appropriated. Anyway, the
most important point is that this fact is known in
advanc e, since the clinical study of the disease is carried
out usually before the signal processing analysis. This is
the kind of knowledge that BSS methods ignore and do
not take into account avoidi ng the specialization ad hoc
of classical algorithms to exploit all the available infor-
mation of the problem under consideration.
We prese nt here a new approach to estimate the atrial
rhythm in atrial tachyarrhythmias based on the quasi-
periodicity of the atrial waves. We will exploit this
knowledge in two directions, firstly in the statement of
the problem: a separation or extraction approach. The
classical BSS separation approach that tries to recover
all the original signals starting from the linear mixtures
of them can be adapted to an extraction approach that
estimates only one so urce, sinceweareonlyinterested
in the clinically significant quasiperiodic atrial signal.
Secondly, we will impose the quasiperiodicity feature in
two different implementations, obtaining an algebraic
solution to the problem and an a daptive algorithm to
extract the atrial activity. The use of periodicity has two
advantages: First, it alleviates the computational cost
and the effectiveness of the estimates when we imple-
ment the algorithm, since we will have to estimate only
second-order statistics, avoiding the difficulties o f
achieving good higher-order statistics estimates; second,
it allows the development of algorithms that focus on
the recovering of signals that mat ch a cost function that
measure in one or another way the distance of the esti-
mated signal to a quasiper iodic signal. It h elps in relax-
ing the much stronger assumption of independence and
allows the definition of new cost functions or the proper
selection of parameters such as the time lag in the cov-
arianc e matrix in traditional second-order BSS meth ods.
The drawback i s that the main period of the atrial
rhythm must be previously estimated.
2 Statement of the problem
2.1 Observation model
A healthy heart is de fined by a regular well-organized
electromechanical activity, the so-called normal sinus
rhythm (NSR). As a consequence of this coordinated
behavior of the ventricles and atria, the surface ECG is
characteri zed by a regular periodic co mbination of
waves and complexes. The ventricles are responsible for
the QRS complex (during ventricular depolarization)
and the T wave (during ventricular repolarization). The
atria generate t he P wave (during atrial depolarization).
Thewavecorrespondingtotherepolarizationofthe
atria is thought to be masked by the higher amplitude
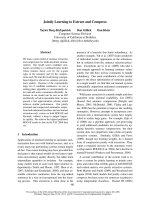
QRS complex. Figure 1a shows a typical NSR, indicating
the different components of the ECG.
During an atrial fibrillation episode, all this coordina-
tion between ventricles and atria disappears and they
Llinares and Igual EURASIP Journal on Advances in Signal Processing 2011, 2011:134
/>Page 2 of 16
become decoupled [9]. In the surface ECG, the atrial
fibrillation arrhythmia is defined by the substitution of
the regular P waves by a set of irregular and fast wave-
lets usually referred to as f-waves. This is due to the fact
that, during atrial fibrillation, the atria beat chaotically
and irregularly, out of coordination with the ventricles.
In the case that these f-waves are not so irregular
(resembling a sawtooth signal) an d have a much lower
rate (typically 240 waves per minute against up to
almost 600 for the atrial fibrillation case), the arrhyth-
mia is called atrial f lutter. In Figure 1b, c, we can see
the ECG recorded at the lead V1 for a typical atrial
fibrillation and atrial flutter episode, respectively, in
order to clarify the differences from a visual point of
view among healthy, atrial fibrillation and flutter
episodes.
From the signal processing point of view, during an
atrial fibrillation or flutter episode, the surface ECG at a
time instant t can be represented as the linear combina-
tion of the decoupled atrial and ventricular sources and
some other components, such as breathing, muscle
movements or the power line interference:
x
(
t
)
= As
(
t
)
(1)
where
x
(
t
)
∈
12×
1
is the electrical signal reco rded at
the standard 12 leads in an ECG recording,
A
∈
12×
M
is the unknown full colu mn rank mixing matrix, and
s
(
t
)
∈
M×
1
is the source vector that assembles all the
possible M sources involved in the ECG, including the
interesting atrial component. Note that since the num-
ber of sources is usually less than 12, the problem is
overdetermined (more mixtures than sources). Never-
theless, the dimensions of the problem are not reduced
since the atrial signal is usually a low power component
and the inclusion of up to 12 sources can be helpful in
order to recover some novel source or a multidimen-
sional subspace for some of them, for example, when
the ventricular component is composed of several sub-
components defining a basis for the ventricular activity
subspace due to the morphological changes of the ven-
tricular signal in the surface ECG.
2.2 On the periodicity of the atrial activity
A normal ECG is a recurrent signal, that is, it h as a
highly structured morphology that is basically repeated
in every beat. It means that classical averaging methods
can be helpful in the analysis of ECGs of healthy
patients just aligning in time the different heartbeats, for
(a)
Atrial
Activity
P-wave
Ventricular
Activity
Q
R
S
T
-0.2
0
0.2
0.4
(b)
Amplitude (milivolt)
-1
0
1
t(sec.)
(c)
0123456
-0.5
0
0.5
1
1.5
Figure 1 a Example of normal sinus rhythm. b Example of atrial fibrillation episode. c Example of atrial flutter episode.
Llinares and Igual EURASIP Journal on Advances in Signal Processing 2011, 2011:134
/>Page 3 of 16
example, for the reduction of noise in the recordings.
However, during an atrial arrhythmia, regular RR-period
intervals disappear, since every beat becomes irregular
in time and sha pe, being composed of very chaotic f-
waves. In addition, the ventricular response also
becomes irregular, with higher average rate (shorter RR
intervals).
Attending to the morphology and rate of these wave-
lets, the arrhythmias are classified in atrial flutter or
atrial fibrillation, as aforementioned. This characteristic
time structure is translated to frequency domain in two
different ways. In the case of atrial flutter, the relatively
slow and regular shape of the f-waves produces a spec-
trum with a high low frequency peak and some harmo-
nics; in the case of atrial fibrillation, there also exists a
main atrial rhythm, but its characteristic frequency is
higher and the power distribution is not so well struc-
tured around harmonics, since the signal is more irregu-
lar than t he flutter. In Figure 2, we show the spectrum
for the atrial fibrillation and atrial flutter activities
shown in Figure 1. As can be seen, both of them show a
power spectral density concentrated around a main peak
in a frequency band (n arrow-band signal). In our case,
the main atrial rhythms correspond to 3.88 and 7.07 Hz
for the flutter and fibrillation cases, respectively; in addi-
tion, we can observe in the figure the harmonics for the
flutter case. This atrial frequency band presents slight
variations depending on the authors, for example, 4-9
Hz [12,13], 5-10 Hz [14], 3.5-9 Hz [11] or 3-12 Hz [15].
Note that even in the case of a patient with atrial
fibrillation, the highly irregular f-waves can be consid-
ered regular in a short period of time, typically up to 2 s
[5]. From a signal processing point of view, this fact
implies that the atrial signal can be considered a quasi-
periodic signal with a time-varying f-wave shape. On the
other hand, for the case of atrial flutter, it is usually sup-
posed that t he waveform can be modeled by a simple
stationary sawtooth signal. Anyway, the time structure
of the atrial rhythm guarantees that the short time spec-
trum is defined by the Fourier transform of a quasiper-
iodic signal, that is, a fundamental frequency in addition
to some harmonics in the bandwidth 2.5-25 Hz [5].
In conclusion, the f-waves satisfy approximately the
periodicity condition:
s
A
(
t
)
s
A
(
t + nP
)
(2)
where P is the period defined as the inverse of the
main atrial rhythm and n is any integer number. Note
that we assume that the signals x(t) are obtained by
sampling the original periodic analog signal with a sam-
pling period much larger than the bandwidth of the
atrial activity.
The covariance function of the atrial activity is defined
by:
ρ
s
A
(τ )=E
s
A
(t + τ)s
A
(t )
ρ
s
A
(τ + nP
)
(3)
corresponding to one entry in the diagonal of the cov-
ariance matrix of the source signals R
s
(τ)=E [s(t + τ)s
(t)
T
]. At the lag equal to the period, the covariance
matrix becomes:
R
s
(P )=E
s(t + P)s(t)
T
(4)
As we mentioned before, the sources that are com-
bined in the ECG are decoupled, so the covariance
dB/Hz
f
p
:7.07Hz
5 101520
-30
-20
-10
0
dB/Hz
f
p
:3.88Hz
f(Hz)
5 101520
-30
-20
-10
0
Figure 2 Spectrum of atrial fibrillation signal (top) and atrial flutter signal (bottom).
Llinares and Igual EURASIP Journal on Advances in Signal Processing 2011, 2011:134
/>Page 4 of 16
matrix is a diagonal one, that i s, the off-diagonal entries
are null,
R
s
(
P
)
=
(
P
)
(5)
where the elements of the diagonal of Λ(P)arethe
covariance of the sources Λ
i
(P )=r
si
(P)=E [s
i
(t + P) s
i
(t)].
We do not require the sources to be statistically inde-
pendent but only second-order independent. This sec-
ond-order approach is robust against additive Gaussian
noise, since there is no limitation in the number of
Gaussian sources that the algorithms can extract. Other-
wise, the restriction is imposed in the spectrum of the
sources: They must be different, that is, the autocovar-
iance function of the sources must be different r
si
(τ).
Thi s restriction is fulfilled since the spectrum of ventri-
cular and atrial activities is overlapping but different
[16]. Taking into account Equation 5, we can assure
that the covariance matrices at lags multiple of P will be
also diagonal with one entry being almost the same, the
one corresponding to the autocovariance of the atrial
signal.
3 Methods
3.1 Periodic component analysis of the electrocardiogram
in atrial flutter and fibrillation episodes
The blind source extraction of the atrial c omponent s
A
(t) can be expressed as:
s
A
(
t
)
= w
T
x
(
t
)
(6)
The aim is to recover a signal s
A
(t) with a maximal
periodic structure by means of estimating the recovering
vector (w). In mathematical terms, we establish the fol-
lowing equation as a measure of the periodicity [17]:
p(P)=
t
s
A
(t + P) − s
A
(t )
2
t
s
A
(t )
2
(7)
where P is the period of interest, that is, the inverse of
the fundamental frequency of the atrial rhythm. Note
that p(P) is 0 for a periodic signal with period P.This
equation can be expressed in terms of the covariance
matrix of the recorded ECG, C
x
(τ)=E {x(t + τ) x(t)
T
}:
p(P)=
w
T
A
x
(P ) w
w
T
C
x
(
0
)w
(8)
with
A
x
(P )=E
[x(t + P) −x(t)][x(t + P) − x(t)]
T
=
=2C
x
(
0
)
− 2C
x
(
P
)
(9)
As stated in [17], the vector w minimizing Equat ion 8
corresponds to the eigenvector of the smallest general-
ized eigenv alue of the matrix pair (A
x
(P), C
x
(0)), that is,
U
T
A
x
(P)U = D,whereD is the diagonal generalized
eigenvalue matrix corresponding to the eigenmatrix U
that simultaneously diagonalizes A
x
(P)andC
x
(0), with
real eigenvalues sorted in descending order on its diago-
nal entries.
In order to assure the symmetry of the covariance
matrix and guarantee that the eigenvalues are real
valued, in practice instead of the covariance matrix, we
use the symmetric version [17]:
ˆ
C
x
(P )=
C
x
(P )+C
T
x
(P )
/
2
(10)
The covariance matrix must be estimated at the pseu-
doperiod of the atrial signal. The next subsection
explains how to obtain this i nformation. Once the pair
ˆ
C
x
(P ), C
x
(0)
is obtained, the tran sformed signals are y
(t)=U
T
x(t) corresponding to the periodic components.
The elements of y(t) are ordered according to the
amount of periodicity close to the P value, that is, y
1
(t)
is the estimated atrial signal since it is the most periodic
component with respect to the atrial frequency. In other
words, attending to the previously estimated period P,
the y
i
(t) component is less periodic in terms of P than y
j
(t) for i>j.
Regarding the algorithms focused on the extraction of
only one component, periodic component analysis
allows the possibility to assure the dimension of the
subspace of the atrial activity observing the first compo-
nents in y(t). With respect to the BSS methods, it allows
the correct extraction of the atrial rhythm in an alge-
braic way, with no postprocessing step to identify it
among the rest of an cillary signals nor the use of a pre-
vious whitening step to decouple the components, since
we know that at lea st the first one y
1
(t)belongstothe
atrial subspace. The fact that we can recover more com-
ponents can be helpful in situations where the atrial
subspace is composed of more than one atrial signal
with similar frequencies. In that case, instead of discard-
ing all the components of the vect or y(t)butthefirst
one, we could keep more than one.
If we are interested in a sequential algorithm instead
of in a batch type solution such as the periodic compo-
nent analysis, we can exploit the fact that the vector x(t)
in Equation 1 can be understood as a linear combina-
tion of the columns of matrix A instead of as a mixture
of sources defined by the rows of A, that is, the contri-
bution of the atrial component to the observation vector
is defined by the corresponding column a
i
in the mixing
matrix A. Following this interpretation of Equation 1,
Llinares and Igual EURASIP Journal on Advances in Signal Processing 2011, 2011:134
/>Page 5 of 16
one intuitive way to extract the ith source is to project x
(t) onto the space in
12×
1
orthogonal to, denoted by ⊥,
all o f the columns o f A except a
i
,thatis,{a
1
, . , a
i-1
, a
i
+1
, , a
12
}.
Therefore, the optimal vector w that permits the
extraction of the atrial source can be obtained by for-
cing s
A
(t)tobeuncorrelatedwiththeresidualcompo-
nents in
E
w
⊥|t
= I −
(
tw
T
/w
T
t
)
, the oblique projector
onto direction w
⊥
, that is, the space orthogonal to w,
along t (direction of a
i
,thecolumni of the mixing
matrix A when the atrial component is the ith source).
The vector w is defined for the case of 12 sources as
w⊥span {a
1
, , a
i-1
, a
i+1
, , a
1
2}.
The cost function to be maximized is:
J
w, t, d
0
, d
1
, , d
Q
= −
Q
τ
=
0
R
x
(τ )w − d
τ
t
2
(11)
where d
0
, d
1
, ,d
Q
are Q +1unknownscalarsand
||·|| denotes the Euclidean length of vectors. In order to
avoid the trivial solution, the constraints ||t|| = 1 and ||
[ d
0
, d
1
, , d
Q
]|| = 1 are imposed. One source is per-
fectly extracted if R
x
(τ)w = d
τ
t, because t is collinear
with one c olumn vector in A,andw is orthogonal to
the other M - 1 column vectors in the mixing matrix.
If we diagonalize the Q+1 covariance matrices R
x
(τ)at
time lags the multiple periods of the main atrial rhythm
τ =0,P, , QP, the restriction || [d
0
, d
1
, , d
Q
]||=1
implies
d0=d1=···= dQ =
1
√
Q+1
, that is, the vector of
unknown scalars d
0
, d
1
, , d
Q
is fixed and the cost func-
tion must be maximized only with respect to the
extracting vector. The final version of the algorithm (we
omit details, see [18]) is:
w =
Q
r=0
R
2
rP
−
1
1
√
Q +1
Q
r=0
R
rP
t, w = w/ w
t =
1
√
Q +1
Q
r
=
0
R
rP
w, t = t/ t
(12)
Regardless of the algorithm we follow, the algebraic or
sequential solution, both of them require an initia l esti-
mation of the period P as a parameter.
3.2 Estimation of the atrial rhythm period
An initial estimation of the atrial frequency must be first
addressed. Although the ventricular signal amplitude
(QRST complex) is much higher than the atrial one,
during the T-Qintervals, the ventricular amplitude is
very low. From the lead with higher AA, usually V1
[12], the main peak frequency is estimated using the
Iterati ve Singular Spectrum Algorithm (ISSA) [15]. ISSA
consists of two steps: In the first one, it fills the gaps
obtained on an ECG signal after the removal of the
QRST intervals; in the second step, the algorithm
locates the dominant frequency as the largest peak in
theinterval[3,12]Hzofthespectralestimateobtained
with a Welch’s periodogram.
To fill the gaps after the QRST intervals are removed,
SSA embeds the original signal V1 in a subspace of
higher-dimension M.TheM-lag covariance matrix is
computed as usual. Then, the singular value deco mposi-
tion (SVD) of the MxM covariance matrix is obtained
so the original signal can be reconstructed with the
SVD. Excluding the dimensions associated with the
smaller eigenvalues (noise), the SSA reconstructs the
mis sing samples using the eigenvectors of the SVD as a
basis. In this way, we can obtain an approximation of
the signal in the QRST intervals that from a spectral
point of view is better than other polynomial
interpolations.
To check how many components to use in the SVD
reconstruction, the estimated signal is compared with a
known interval of the signal, so when both of them
become similar, the number of components in the SVD
reconstruction is fixed. Figure 3 shows the block dia-
gram of the method.
4 Materials
4.1 Database
We will use simulated and real ECG data in order to
test the performance of the algorithms under control led
(synthetic ECG) and real situations (rea l ECG). The
simulated signals come from [11] (see Section 4.1 in
[11] for details about the procedure to generate them);
the most interesting property of these signals is that the
different components correspond to the same patient
and session (preserving the electrode position), being
only necessary the interpolation during the QRST inter-
vals for the atrial component. The data were provided
by the authors and consist of ten recordings, four
marked as “atrial flutter” (AFL) and six marked as “atrial
fibrillation” (AF). The real recording database contains
forty-eight registers (ten AFL and thirty eight AF)
belonging to a clinical database recorded at the Clinical
University Hospital, Vale ncia, Spain. The ECG record-
ings were taken with a commercial recording system
with 12 leads (Prucka Engineering Cardiolab system).
The signals were digitized at 1,000 samples per second
with 16 bits resolution.
In our experiments, we have used all the available
leads for a period of 10 s for every patient. The signals
were preprocessed in order to reduce the baseline wan-
der, high-frequency noise and power line interference
for the later signal processing. The recordings were fil-
tered with an 8-coeffcient highpass Chebyshev filter and
with a 3-coeffcient lowpass Butterworth filter to select
Llinares and Igual EURASIP Journal on Advances in Signal Processing 2011, 2011:134
/>Page 6 of 16
the bandwidth of interes t: 0.5-40 Hz. In order to reduce
the computational load, the data were downsampled to
200 samples per second with no significant changes in
the quality of the results.
4.2 Performance measures
In source separation problems, the fact that the target
signal is known allows us to measure with accuracy the
degree of performance of the separation. There exist
many objective ways of evaluating the likelihood of the
recovered signal, for example, the normalized mean
square error (NMSE), the sign al-to-interference ratio or
the Pearson cross-correlation coeffcient. We will use the
cross-correlation coeffcient (r)betweenthetrueatrial
signal, x
A
(t), and the extracted one,
ˆ
x
A
(
t
)
;forunitvar-
iance signals and
m
x
A
, m
ˆ
x
A
is the means of the signals:
ρ = E
(x
A
(t ) −m
x
A
)(
ˆ
x
A
(t ) −m
ˆ
x
A
)
(13)
For real recordings, the measure of the quality of the
extraction is very difficult because the true signal is
unknown. An index that is extensively used in the BSS
literature about the problem is the spectral concentra-
tion (SC) [11]. It is defined as:
SC =
1.17f
p
0.82f
p
P
A
(f )df
∞
0
P
A
(f )df
(14)
where Pa(f) is the power spectrum of the extracted
atrial signal
ˆ
x
A
(
t
)
and f
p
is the fibrillatory frequency
peak (main peak frequency in the 3-12 Hz band). A
large SC is usually understood as a good extraction of
the atrial f-waves because a more concentrated spectrum
implies better cancellation of low- and high-frequency
interferences due to breathing, QRST complexes or
power line signal.
In time domain, the validation of the results with the
real recordings will be carried out using kurtosis [19].
Although the true kurtosis value of the atrial component
is unknown, a large value of kurtosis is associated with
remaining QRST complexes and conse quently implies a
poor extraction.
4.3 Statistical analysis
Parametric or nonparametric statistics were used depend-
ing on the distribution of the variables. Initially, the Jar-
que-Bera test was applied to assess the normality of the
distributions, and later, the Levene test proved the homo-
scedasticity of the distribut ions. Next, the statistical tests
used to analyze the data were ANOVA or Kruskal-Wallis.
Statistical significance was assumed for p < 0.05.
5 Results
The p roposed algorithms were exhaustively tested with
the synthetic and real recordings explained in the pre-
vious s ection. We refer to them as periodic component
analysis (piCA) and periodic sequential approximate
diagonalization (pSAD). The prior information (initial
period
(
˜
P
)
) was estimated for each patient from the lead
V1 and was calculated as the inverse of the initial esti-
mation of the main peak frequency
˜
p =1/
˜
f
p
. In addi-
tion, for comparison purposes,weindicatetheresults
obtained by two established methods in the literature:
spatio temporal QRST cancellation (STC) [9] and spatio-
temporal blind source separation (ST-BSS) [11].
5.1 Synthetic recordings
The results are summarized in Table 1. For the AFL and
AF cases, it shows the mean and standard deviation of
correlation (r) and peak frequency
(
ˆ
f
p
)
values obtained
by the algorithms (the two proposed and the two estab-
lished algorithms). The mean true fibrillatory frequency
is 3.739 Hz for the AFL case and 5.989 Hz for the AF
recordings (remember that in the atrial flutter case, the
f-w aves are slower and less irregular). The spectral ana-
lysis was carried out with the modified periodogram
using the Welch-WOSA method with a Hamming win-
dow of 4,096 points length, a 50% overlapping between
adjacent windowed sections and an 8,192-point fast
Fourier transform (FFT).
Figure 3 Estimation of the main frequency peak from lead V1 using ISSA filling.
Table 1 Correlation values (r) and peak frequency
(
ˆ
f
p
)
obtained by the algorithms piCA, pSAD, STC and ST-BSS
in the case of synthetic registers for AFL and AF.
piCA pSAD STC ST-BSS
AFL patients
r 0.822 ± 0.116 0.884 ± 0.046 0.708 ± 0.080 0.792 ± 0.206
ˆ
f
p
(Hz
)
3.742 ± 0.126 3.647 ± 0.230 3.721 ± 0.230 4.155 ± 0.997
AF patients
r 0.804 ± 0.080 0.823 ± 0.078 0.709 ± 0.097 0.789 ± 0.072
ˆ
f
p
(Hz
)
5.981 ± 0.812 5.974 ± 0.813 5.927 ± 0.788 5.974 ± 0.814
Llinares and Igual EURASIP Journal on Advances in Signal Processing 2011, 2011:134
/>Page 7 of 16
The extraction with the proposed algorithms is very
good, with cross-correlation above 0.8 and with a very
accurate estimation of the fibrillatory frequency. Com-
pared to the STC and ST-BSS methods, the result s
obtained by piCA and pSAD are better, as we can
observe in Table 1.
Figure 4 represents the cross-correlation coeffcient (r)
and the true (f
p
) and estimated main atrial rhythm or
fibrillatory f requency peak
(
ˆ
f
p
)
for the four AFL and six
AF recordings. For the sake of simplicity, Figure 4 only
shows the results for the two new algorithms. The beha-
vior of both algorit hms is quite similar; only for patient
2 in the AFL case, the performance of pSAD is clearly
better than piCA.
We conclude that both algorithms perform very well
for the synthetic signals and must be tested with real
recordings, with the inconvenience that objective error
measures cannot be obtained since there is no grounded
atrial signal to be compared to.
5.2 Real recordings
In the case of real recordings, we cannot compute the
correlation since the true f-waves are not available. To
assess the quality of the extraction, the typical error
measures must be now substituted by approximative
measurements. In this case, SC and kurtosis will be used
to measure the performance of the algorithms in fre-
que ncy and time domain. In addi tion, we can still com-
pute the atrial rate, that is, the main peak frequency,
although again we cannot measure its goodness in abso-
lute units. SC and
ˆ
f
p
values were obtained from the
power spectrum using the same estimation method as
in the case of synthetic recordings.
We start to consider the extraction as successful when
the extracted signal has a SC value higher than 0.30 [15]
and a kurtosis value lower than 1.5 [11]. Both thresholds
are established heuristically in the literature. We have
confirmed these values in our experiments analyzing
visually the estimated atrial signals when these restric-
tions are satisfied simultaneously. Hence, the compari-
son of the atrial activities obtained for the same patient
by the d ifferent methods is straightforward: The signal
with lowest kurtosis and largest SC will be the best
estimate.
As for synthetic ECGs, we summarize the mean and
standard deviation of the quality parameters (SC, kurto-
sis and
ˆ
f
p
) obtained by the proposed and classic
ρ
AFL AF
1234 123456
0
0.2
0.4
0.6
0.8
1
piCA
pSAD
ˆ
f
p
(Hz)
AFL AF
1234 123456
0
2
4
6
8
piCA
pSAD
f
p
Figure 4 Top ross-correlation values (r) obtained by the algorithms piCA (circles) and pSAD (crosses) in the case of synthetic registers
for AFL (numbered 1-4 left side) and AF (numbered 1-6 right side); bottom estimated peak frequency
(
ˆ
f
p
)
by respective algorithm
and true peak frequency f
p
.
Llinares and Igual EURASIP Journal on Advances in Signal Processing 2011, 2011:134
/>Page 8 of 16
algorithms in Table 2. The results obtained by piCA and
pSAD are very consistent again.The main atrial rhy thm
estimated is almost the same for all the recordings for
both algorithms. This fact reveals that both of them are
using the same prior and that they converge to a solu-
tion that satisfies the same quasiperiodic restriction.
With respect to the STC and ST-BSS algorithms, the
results obtained by piCA and pSAD are also better as in
the case of synthetic ECGs. Note that the kurtosis in the
STCcaseisverylarge;thisisduetothefactthatthe
algorithm was not able to cancel the QRST complex for
some recordings.
Figure 5 shows the SC, kurtosis and main atrial fre-
quency
ˆ
f
p
for the 10 patients l abeled as AFL (l eft part of
the figure) and the 38 recordings labeled as AF (right
part of the figure) for pICA solution (circles) and pSA D
estimate (crosses).
To check whether the performa nces of the new algo-
rithms are stat istically different, we calculated the statis-
tical significance with the corresponding test for the SC,
kurtosis a nd frequency. We found no significant dif fer-
ences between piCA and pSAD as we expected after
seeing Figure 5, since the results are quite similar for
many recordings. On the other h and, when comparing
piCA and pSAD with STC and ST-BSS in all the cases,
there were statistically significant differenc es (p < 0.05)
for SC and kurtosis parameters. All the algorithms esti-
mated the frequency with no statistically significant
differences.
To compare the signals obtained by the proposed
algorithms for the same recording, we show an exam-
ple in Figure 6. It cor responds to patient number 5
with AF. We show the f-waves obtained by pSAD
(top) and piCA (middle) scaled by the factor asso-
ciated with its projection onto the lead V1. In addi-
tion, we show the signal recorded in lead V1 (bottom).
As can be seen, they are almost identical (this is not
surprising since the SC and kurtosis values in Figure 5
are the same for this patient); during the n onventricu-
lar activity periods, the estimated and the V1 signals
are very similar (the algorithms basically canceled the
baseline); during the QRS complexes, the algorithms
were able to subtract the high-amplitude ventricular
component, remaining the atrial signal without
discontinuities.
However, we can observe attending to the SC and
kurtosis values in Figure 5 that the f-waves obtained by
the two algorithms are not exactly the same for the 48
recordings. The recordings where the estimated signals
are clearly different are number 2 and 8 for AFL and
number 2 for AF case. We will analyze these three cases
in detail. For patient number 8 with AFL, the kurtosis
value is high for pSAD algorithm. Observing the signal
in time (Figure 7, atrial signal recovered by pSAD (top)
and by piCA (middle), both scaled by the factor asso-
ciated with its projection onto the lead V1, and lead V1
(bottom)), we can see that it is due to one ectopic beat
located around second 5.8 which pSAD was not able to
cancel. If we do not include it in the estimation of the
kurtosis, it is reduced to 0.9, a close to Gaussian distri-
bution as we expected. This result confirms the good-
ness of kurtosis as an index to measure the quality of
the extraction. Note that since it is very sensitive to
large values of the signal, it is a very good detector of
residual QRST complexes.
With respect to patient number 2 in AF, the kurtosis
value is high for both algorithms. Again, it is due to the
presence of large QRS residues in the r ecovered atrial
activity. We show the recovered f-waves in Figure 8.
This case does not correspond to an algorithm failure,
but it is due to a probl em with the recording. Neverthe-
less, the algorithms recover a quasiperiodic component
and for the case of pSAD even with an a cceptable kur-
tosis value (it is able to cancel t he beats between sec-
onds 6 and 8 of the recording).
The most interesting case is patient num ber 2 in AFL.
Its explanation will help us to understand the differ-
ences between both algorithms. Remember that piCA
solution is based on the decomposition of the ECG
using as waveforms with a period close to the main
atrial period as a basis. We show in Figure 9 the first
four signals obtained by piCA for this patient.
Table 2 Spectral concentration (SC), kurtosis and peak frequency
(
ˆ
f
p
)
obtained by the algorithms in the case of real
registers.
piCA pSAD STC ST-BSS
AFL patients
SC 0.687 ± 0.126 0.600 ± 0.151 0.378 ± 0.092 0.661 ± 0.134
Kurtosis -0.610 ± 0.350 -0.007 ± 1.728 1.866 ± 1.260 -0.543 ± 0.295
ˆ
f
p
(Hz)
4.117 ± 0.783 4.114 ± 0.780 5.139 ± 1.455 4.444 ± 1.048
AF patients
SC 0.527 ± 0.114 0.529 ± 0.112 0.380 ± 0.133 0.438 ± 0.164
Kurtosis 0.497 ± 1.020 0.874 ± 2.134 7.886 ± 18.746 0.138 ± 0.563
ˆ
f
p
(Hz)
5.927 ± 1.067 5.933 ± 1.067 6.115 ± 1.065 5.881 ± 1.083
Llinares and Igual EURASIP Journal on Advances in Signal Processing 2011, 2011:134
/>Page 9 of 16
The solution is algebraic, and there is no adaptive
learning. The first recovered signal is clearly the cleanest
atrial component (remember that one advantage of
piCA with respect to classical ICA-based solutions is
that we do not need a postprocessing to identify the
atrial component, since in piCA the recovered compo-
nents are ordered by periodicity). The second one could
be considered an atrial signal too, although the f-waves
are contaminated by some residual QRST complexes,
for example, in second 1 or 2.5. In fact, this second
atrial component is very similar to the signal that
recovers pSAD. Since pSAD is extracting only one
source, it is not able to recover the atrial subspace when
it includes more than one component. In this case, the
problem arises because some of the QRS complexes are
by chance periodic with period the half of the f-waves
period, so the signal estimated by pSAD is also periodic
with the correct period.
Next, we analyzed the convergence of the adaptive
algorithm pSAD. It converges very fast, requiring from 1
to 5 iterations to obtain the f-waves. In Figure 10, w e
show the extracted atrial signal for recording number 33
with AF after the first, second and fifth iteration. As we
can observe, just after two iterations, the QRS com-
plexes that are still visible after the first iteration have
been canceled. The remaining large values are continu-
ously reduced in every iteration, obtaining a very good
estimate of the f-waves after five iterations.
Finally, we compared the requirements in terms of
time for both algorithms. The mean and standard devia-
tion of the time consumed by the algorithms to estimate
the atrial activity for each patient were 0.0114 ± 0.0016
s for piCA and 0.0110 ± 0.0040 s for pSAD (f or a fixed
number of iterations of 20).
5.3 Influence of the estimation of the initial period
In this section, we study the influence of the initial esti-
mation of the period in the performance of the algo-
rithms. From ISSA algorithm, we obtain an estimation
of the main peak frequency of the AA,
˜
f
p
,andthenwe
convert it to period using the exp ression
˜
P =1/
˜
f
p
.Inthe
experiment, we varied the initial estimation o f the per-
iod measured in samples, referred to as
i
˜
P
, from
i
˜
P −2
0
samples up to
i
˜
P +2
0
samples. Figures 11 and 12 sho w
the results for the studied parameters: SC, estimated
peak frequency and kurtosis. The graphs correspond to
SC
AFL AF
1 5 10 1 5 10 15 20 25 30 35 38
0
0.5
1
piCA
pSAD
kurt
AFL AF
1 5 10 1 5 10 15 20 25 30 35 38
-10
0
10
20
piCA
pSAD
ˆ
f
p
(Hz)
AFL AF
1 5 10 1 5 10 15 20 25 30 35 38
0
5
10
piCA
pSAD
Figure 5 Top Spectral concentration (SC) for real recordings 1-10 with AFL and 1-38 with AF, for the piCA (circles) and pSAD (crosses)
algorithms; middle kurtosis; bottom main atrial frequency
(
ˆ
f
p
)
.
Llinares and Igual EURASIP Journal on Advances in Signal Processing 2011, 2011:134
/>Page 10 of 16
the average of the 38 AF patients. For a peak frequency
of 6 Hz (the average frequency obtained) and taking
into account the sample frequency, every sample
approximately corresponds to 0.2 Hz(
[
i
˜
P −20, i
˜
P +20
]
samples that is equivalent to [2,10] Hz for a 6 Hz atrial
activity).
6 Discussion
In this Section, we discuss the characteristics of the pro-
posed algorithms, emphasizing the advantages and
drawbacks, and their relationships with the solutions
based on the cancellation of the QRST complexes and
BSS-ICA approach, represented by the STC and ST-BSS
methods, respectively.
The algorithms piCA and pSAD use the pseudoperio-
dic property of the atrial activity in time domain. They
do not require whitening nor the use of higher-order
cumulants as found in BSS-ICA solutions. They only
rely on the noniden tical spectrum of the sources and
exploit the periodicity feature in a different way. The
algorithm piCA is based on a cost function that mea-
sures periodicity ; the establishment of such a c ost func-
tion in an appropriate way allows us to obtain an
algebraic solution, where the estimated components are
ordered attending to this periodic criterion; the obtained
algorithm has the great advantage with respect to ICA-
based algorithms that it avoids the typ ical ordering pro-
blem due to the inherent indeterminacies of ICA and
that the independence assumption is not required. On
the other hand, pSAD exploits the structure of the spa-
tial correlation matrix of the sources at different lags.
Periodicity is used to select the lags adapting the general
algorithm to the atrial arrhythmia problem.
The results show that although the approaches and
implementations of the periodicity hypothesis are quite
different, piCA and pSAD obtained similar results for
synthetic and real recordings in terms of quality para-
meters and time consumed. Since the piCA decomposi-
tion recovers signals according to the similarity to the
period value in descending order, if the error is very
large, it is easy to detect that none of the recovered sig-
nals corresponds to an atrial activity. In the case of
piCA, we just have to analyze the first component to be
sure whether the algorithm worked or not. In addition,
we can explore the first piCA signals to assure whether
there are more candidates to be considered as atrial
AA pSAD
AA piCA
V1
Amplitude (milivolt)
t(sec.)
012345678910
-1
-0.5
0
0.5
1
1.5
Figure 6 Comparison of atrial activity (AA) extraction for AF patient number 5. AA obtained by pSAD (top), by piCA (middle) and lead V1
(bottom).
Llinares and Igual EURASIP Journal on Advances in Signal Processing 2011, 2011:134
/>Page 11 of 16
AA pSAD
AA piCA
V1
Amplitude (milivolt)
t(sec.)
012345678910
-1.5
-1
-0.5
0
0.5
1
1.5
2
2.5
3
Figure 7 Comparison of atrial activity (AA) extraction for AFL patient number 8. AA obtained by pSAD (top), by piCA (middle) and lead V1
(bottom).
(a)
-0.1
0
0.1
(b)
t(sec.)
012345678910
-10
-5
0
5
Amplitude (milivolt)
Figure 8 Comparison of AA extraction for AF patient number 2. AA obtained by piCA (top) and by pSAD (bottom).
Llinares and Igual EURASIP Journal on Advances in Signal Processing 2011, 2011:134
/>Page 12 of 16
signals, defining the atrial subspace. For the pSAD algo-
rithm, since we only obtain a signal, it i s also very sim-
ple t o assure the quality of the extraction (or at least if
it can be considered successful or not attending to the
criteria established in the paper that depend on the SC
and kurtosis values of the estimated f-waves).
Both algorithms require an approximate value of the
atrial dominant frequency as a parameter. It implies that
these methods are not blind, such as classical BSS-ICA
methods, since they are dependent on this parameter.
This value is obtained through the ISSA algorithm,
which works well even in the case of very fast heart
rate, since it averages through various beats in the filling
of the gaps during the QRST intervals. Never theless, we
have analyzed the influence of the initial estimate of the
frequency obtained by ISSA
(
˜
f
p
)
in the performance of
the algorithms. The piCA algorithm is very robust to
poor estimates of the initial atrial rhythm period, that is,
the performance of the algorithm does not deteriorate
too much for the studied interval of the initial period.
This is because piCA searches for the closest periodic
signal to the initial period; when the initial value is not
the correct one, the algorithm is still looking for a peri-
odic signal in the interval, and the only one is th e atrial
activity. Of course, the better the initial estimation, the
better the quality of the extraction. In the case of pSAD,
the algorithm can obtain a good estimation of the AA
when the initial period changes up to 5 samples in abso-
lute value (± 1 Hz), that is, it is n ot so robust. The rea-
son is that when the initial frequency is far from the
correct one, the assumption
d
0
= d
1
= ···= d
Q
=
1
√
Q+1
is
not correct (Equation 12), since the time lags τ =0,P,
, QP are not multiple of the true period in this case.
The comparison of the results has been carried out
using SC and kurtosis. When two method s are com-
pared for the same recording, the one with larger SC
value is usually considered as the algorithm that per-
formed better. We must remark that this is not an abso-
lute error measurement, since we do not have access to
thetrueatrialsignalforthecaseofrealrecordings,
since it is unknown by definition unless we can obtain a
clean recording of only the atrial activity thanks to an
invasive procedure. On the other hand, the different sta-
tistical properties of the atrial (most often a sub-Gaus-
sian close to Gaussian variable, i.e., a distribution with
small negative kurtosis value) and ventricular activities
(super-Gaussian random variable, i.e., a heavy-tailed dis-
tribution with positive kurtosis value) can be used to
(a)
-0.1
0
0.1
(b)
-0.1
0
0.1
(c)
-0.2
0
0.2
(d)
t(sec.)
012345678910
-0.2
0
0.2
Amplitude (milivolt)
Figure 9 First four signals recovered using piCA for AFL patient number 2.
Llinares and Igual EURASIP Journal on Advances in Signal Processing 2011, 2011:134
/>Page 13 of 16
measure the cancellation of the v entricular rhythm in
the estimated f-waves. Note that kurtosis i s very sensi-
tive to outliers, so a remaining ventricular activity will
reveal as a large kurtosis value, far away from the theo-
retical value for the atrial rhythm (kurtosis around zero
value). For synthetic and real recordings, both algo-
rithms obtained better results than STC and ST-BSS
algorithms. Only for the case of the kurtosis and AF
patients, ST-BSS obtained a better result than the pro-
posed methods. This result was expected since the first
step of ST-BSS removes sources with kurto sis greater
than 1.5 before executing SOBI algorithm [20] in the
second step.
One limitation of the new algorithms, as it is usual in
the BSS-ICA methods, is that they do not preserve the
amplitude of the atrial signal, since all of them are
based on the model x(t)=As(t), so the source vector
can be multiplied by a constant factor and the mixing
matrix divided by the same factor, obtaining the sam e
recorded ECG. This is not the case of the methods
based on the cancellation of the QRST complexes. Since
they are based on the subtraction of templates of the
QRST complexes, they preserve the amplitude of the
original ECG. The main problem of this framework is
the reduction of performance when a high-quality
QRST cancellation template is difficult to obtain. This is
the case of clinical practice where no more t han 10 s
areavailable[21],asithappens in our study. This fact
explains the poor results obtained by STC for some reg-
isters as we mentioned in the Results section. Other
limitations are their high sensitiveness to variations in
QRST morphology or the difficulty of finding the opti-
mal selection of the complexes to generate the template
[22].
7 Conclusion
We have presented a new approach to solve the pro-
blem of the extraction of the atrial activity for atrial
arrhythmias. We have shown that the periodicity of the
atrial signal can be exploited in two different ways: in a
classical BSS approach based on second-order statistics
helping in the selection of the time lags where the cor-
relation function is computed (pSAD) and in a novel
way introducing a cost function that is related to the
periodicity (pICA). The methods depend on the pre-
vious estimation of the period or main atrial frequency.
As the results have shown, both methods work very
well, analyzing the influence of the quality of this initial
(a)
-5
0
5
(b)
Amplitude (milivolt)
-5
0
5
(c)
t(sec.)
-5
0
5
Figure 10 Time courses of the estimates from pSAD for AF patient number 33 (a) Iteration number 1, (b) iteration number 2 and (c)
iteration number 5.
Llinares and Igual EURASIP Journal on Advances in Signal Processing 2011, 2011:134
/>Page 14 of 16
SC
0
0.2
0.4
0.6
0.8
ˆ
f
p
(Hz)
4
6
8
10
kurt
0
5
10
i
˜
P − 20 i
˜
P − 15 i
˜
P − 10 i
˜
P − 5 i
˜
Pi
˜
P +5 i
˜
P +10 i
˜
P +15 i
˜
P +20
Figure 11 Influence of P in spectral concentration (SC), estimated frequency
(
ˆ
f
p
)
and kurtosis (kurt) for the piCA algorithm (
i
˜
P
means
initial period in samples).
SC
0
0.2
0.4
0.6
0.8
ˆ
f
p
(Hz)
4
6
8
10
kurt
0
5
10
i
˜
P − 20 i
˜
P − 15 i
˜
P − 10 i
˜
P − 5 i
˜
Pi
˜
P +5 i
˜
P +10 i
˜
P +15 i
˜
P +20
Figure 12 Influence of P in spectral concentration (SC), estimated frequency
(
ˆ
f
p
)
and kurtosis (kurt) for the pSAD algorithm (
i
˜
P
means
initial period in samples).
Llinares and Igual EURASIP Journal on Advances in Signal Processing 2011, 2011:134
/>Page 15 of 16
estimation in the performance of the methods. In addi-
tion, we have compared the results with two well-e stab-
lished methodologies and discussed the limitations and
advantages of all of them. The proposed methods work
very well in the case of high-dimensional recordings
such as 12 lead ECGs and where it is not difficult to
obtain a rough estimate of the main atrial frequency.
Endnotes
a
This paper is in part supported by the V alencia Regio-
nal Government (Generalitat Valenciana) through pro-
ject GV/2010/002 (Conselleria d ’ Educacio) and by the
Universidad Politecnica de Valencia under grant no.
PAID-06-09-003-382.
Acknowledgements
The authors would like to thank Roberto Sassi for his collaboration in the
estimation of the initial frequencies and to Francisco Castells and Jose Millet
for sharing the AF synthetic and real database obtained with the help of the
cardiologists Ricardo Ruiz and Roberto Garcia-Civera during the project
TIC2002-00957.
Competing interests
The authors declare that they have no competing interests.
Received: 4 April 2011 Accepted: 13 December 2011
Published: 13 December 2011
References
1. J Rieta, F Castells, C Sanchez, V Zarzoso, J Millet, IEEE Trans Biomed Eng.
51(7), 1176 (2004). doi:10.1109/TBME.2004.827272
2. V Fuster, L Ryden, R Asinger, et al, Circulation. 104, 2118 (2001)
3. L Sörnmo, M Stridh, D Husser, A Bollmann, S Olsson, Philos Trans A.
367(1887), 235 (2009). doi:10.1098/rsta.2008.0162
4. A Bollmann, D Husser, L Mainardi, F Lombardi, P Langley, A Murray, J Rieta,
J Millet, S Olsson, M Stridh, L Sörnmo, Europace. 8(11), 911 (2006).
doi:10.1093/europace/eul113
5. M Stridh, L Sornmo, C Meurling, S Olsson, IEEE Trans Biomed Eng. 51(1),
100 (2004). doi:10.1109/TBME.2003.820331
6. Y Asano, J Saito, K Matsumoto, K Kaneko, T Yamamoto, M Uchida, Am J
Cardiol. 69(12), 1033 (1992). doi:10.1016/0002-9149(92)90859-W
7. B Stambler, M Wood, K Ellenbogen, Circulation. 96(12), 4298 (1997)
8. E Manios, E Kanoupakis, G Chlouverakis, M Kaleboubas, H Mavrakis, P
Vardas, Cardiovasc Res. 47(2), 244 (2000). doi:10.1016/S0008-6363(00)00100-0
9. M Stridh, L Sornmo, IEEE Trans Biomed Eng. 48(1), 105 (2001). doi:10.1109/
10.900266
10. F Castells, J Igual, J Rieta, C Sanchez, J Millet, in Proceedings of the IEEE
International Conference on Acoustics, Speech, and Signal Processing
(ICASSP’03). 5 (2003)
11. F Castells, J Rieta, J Millet, V Zarzoso, IEEE Trans Biomed Eng. 52(2), 258
(2005). doi:10.1109/TBME.2004.840473
12. S Petrutiu, J Ng, G Nijm, H Al-Angari, S Swiryn, A Sahakian, IEEE Eng Med
Biol Mag. 25(6), 24 (2006)
13. M Stridh, A Bollmann, S Olsson, L Sornmo, IEEE Eng Med Biol Mag. 25(6), 31
(2006)
14. P Langley, J Bourke, A Murray, Computers in Cardiology (2000)
15. R Sassi, V Corino, L Mainardi, Ann Biomed Eng. 37(10), 2082–921 (2009).
doi:10.1007/s10439-009-9757-3
16. R Llinares, J Igual, A Salazar, A Camacho, Digit Signal Process. 21(2), 391
(2011). doi:10.1016/j.dsp.2010.06.005
17. R Sameni, C Jutten, M Shamsollahi, IEEE Trans Biomed Eng. 55(8), 1935
(2008)
18. X Li, IEEE Signal Process Lett. 14(1), 58 (2006)
19. R Llinares, J Igual, J Miró-Borrás, Comput Biol Med. 40(11-12), 943 (2010).
doi:10.1016/j.compbiomed.2010.10.006
20. A Belouchrani, K Abed-Meraim, J Cardoso, E Moulines, IEEE Trans Signal
Process. 45(2), 434 (1997). doi:10.1109/78.554307
21. M Lemay, J Vesin, A van Oosterom, V Jacquemet, L Kappenberger, IEEE
Trans Biomed Eng. 54(3), 542 (2007)
22. R Alcaraz, J Rieta, Physiol Meas. 29(12), 1351 (2008). doi:10.1088/0967-3334/
29/12/001
doi:10.1186/1687-6180-2011-134
Cite this article as: Llinares and Igual: Exploiting periodicity to extract
the atrial activity in atrial arrhythmias. EURASIP Journal on Advances in
Signal Processing 2011 2011:134.
Submit your manuscript to a
journal and benefi t from:
7 Convenient online submission
7 Rigorous peer review
7 Immediate publication on acceptance
7 Open access: articles freely available online
7 High visibility within the fi eld
7 Retaining the copyright to your article
Submit your next manuscript at 7 springeropen.com
Llinares and Igual EURASIP Journal on Advances in Signal Processing 2011, 2011:134
/>Page 16 of 16