Forex Trading Using Intermarket Analysis_6 potx
Bạn đang xem bản rút gọn của tài liệu. Xem và tải ngay bản đầy đủ của tài liệu tại đây (336.2 KB, 14 trang )
TRADE SECRETS
42
very useful in spotting market turns, as will be discussed
later.
The momentum oscillators evaluate how current prices compare
to previous prices and provide clues about overbought or oversold
conditions that suggest a possible change in price direction. These
indicators are most reliable in non-trending situations when prices are
moving up and down. However, in trending situations, these indicators
may give a buy or sell signal early in the move and then just remain
stuck on that signal as long as the trend continues.
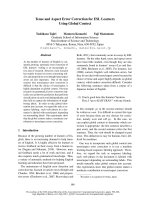
Look at the euro chart with the stochastics indicator as an example of
this problem (Figure 4.4). A downside crossover of the two stochastics
lines above a reading of 80 indicates sell, and an upside crossover
Source: VantagePoint Intermarket Analysis Software (www.TraderTech.com)
Fi g u r e 4.4.
indiCators provide more objeCtive information. indiCators suCh as
stoChastiCs Can provide timely signals in Choppy markets but beCome
unreliable when markets trend, as this euro Chart illustrates. their
best use may be in spotting divergenCe—priCes go one way and the
indiCator goes another.
43
FOREX TRADING USING INTERMARKET ANALYSIS
below 20 indicates buy. Stochastics indicators give a good crossover
sell signal at the high in April, but then show a crossover buy signal
in May during the middle of the downtrend. After giving a signal
too early, the buy signal provided by a stochastics reading below 20
persists for more than a month until the market finally does bottom in
early July, making that indicator relatively worthless to the euro trader
during the time the market was trending downward.
Even though the oscillator indicators often are not reliable in trending
conditions, they can still provide some good clues about future price
direction because of divergence—that is, while prices may hit a new
high or low, the indicator reading does not. Divergence is a visible sig-
nal that the indicator is seeing some underlying weakness or strength
not revealed by the price action. On the right side of the euro chart,
note that the price rises to a new high, but the second stochastics high
is lower than the previous high, a divergence from price action, sug-
gesting the downtrend that followed. For these types of clues, forex
traders may want to include some type of momentum oscillator in their
analysis to confirm a signal provided by another indicator.
moVing To moVing aVerages
Probably the most widely used indicator is some form of moving aver-
age. Moving averages are rather simple to understand and easy to
calculate. Traders who do not want to do the math can just choose
simple, weighted, or exponential moving averages from their analyti-
cal software. The length of moving averages can be adjusted quickly,
depending on the trading time frame, and traders can use the closing
price for a period or any combination of open/high/low/close.
A simple moving average is the sum of prices for number of days (N)
divided by the number of days (N). As each new price is recorded, the
oldest price is removed from the average and is replaced by the new
TRADE SECRETS
44
price as markets move through time. Weighted and exponential moving
averages are structured to give more weight to the newest price, based
on the assumption that current price action is more significant to the
near-term outlook than an old price that happened N periods ago.
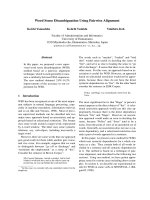
Traditional technical analysis with moving averages is rather straight-
forward. In the simplest arrangement, if prices move above the moving
average, you buy and remain long while prices stay above the average;
if prices fall below the moving average, you sell and stay short while
prices remain below the average (Figure 4.5). Many traders use a com-
bination of several moving averages, buying when the shorter average
crosses above the longer average and selling when the shorter average
drops below the longer average.
Moving averages have the same problem as other indicators in relying
on prices that have already occurred, meaning a moving average is
another lagging indicator. Some analysts use displaced moving aver-
Source: VantagePoint Intermarket Analysis Software (www.TraderTech.com)
Fi g u r e 4.5.
traditional moving averages: a lagging indiCator. perhaps the most
popular teChniCal indiCator is a moving average, shown on this
japanese yen Chart. however, beCause it is based on past priCes, it is
a lagging indiCator subjeCt to whipsaws and does not provide the
forward view a trader really needs.
45
FOREX TRADING USING INTERMARKET ANALYSIS
ages—that is, today’s average is shifted several days into the future on
a chart to reduce the lag effect of moving averages. Although this gives
some semblance of a price forecast, it is a forecast based on past prices
and prices that have not yet occurred, giving it a shaky foundation as
a forecasting tool.
In addition, while the momentum oscillator indicators lose their value
in trending market conditions, moving averages have the disadvantage
of being subject to whipsaw moves when market conditions are choppy
as prices vacillate above and below the moving average. Despite
advances in technology and more sophisticated software, moving aver-
age analysis has remained much the same as it was years ago, and
most traders still using traditional approaches to moving averages are
no more profitable than ever before.
Broadening THe moVing aVerage VieW
In order for traders to gain an edge by taking a position just as a
price move begins to develop, they need indicators such as predicted
moving averages that not only look back at past prices and patterns
but also look forward to anticipate market action. In addition, they
need tools that can look sideways at related markets to see how price
action in those markets is affecting price action in the market that is
being traded.
Weather forecasts for thirty days or ninety days into the future often
are not that accurate, but forecasters have used technology in recent
years to predict the weather accurately for tomorrow or the next few
days. They forecast accurately the temperature highs and lows and
the likelihood of storms or sunny weather. Their forecasts still are not
perfect, of course, but the probability for the predicted conditions to
occur has become quite high.
Most traders would be very happy to have a similarly reliable forecast
for prices for the next two to four days. Using leading indicators that
incorporate intermarket data, predicted moving averages can be calcu-
TRADE SECRETS
46
lated for the next few days. Forecasting future values of moving aver-
ages is easier than forecasting future prices themselves because moving
averages smooth out the data and remove much of the market “noise”
that clutters price forecasting. Through such financial forecasting,
traders can develop mathematical probabilities and expectations of the
future, which can give the traders a tremendous advantage over others
still relying on single-market indicators that tend to lag the market.
For instance, VantagePoint software compares a predicted ten-day
moving average for four days in the future with today’s actual ten-day
moving average as of today’s close. It also compares a predicted five-
day moving average for two days in the future with today’s actual five-
day moving average as of today’s close. Then, if the predicted moving
average is above the actual moving average, the trend is expected to
be up and vice versa.
Figure 4.6 adds the predicted ten-day moving average to the chart in
Figure 4.5 and shows how it compares with the actual ten-day moving
average. Because the predicted moving average is being forecasted
for four days in advance, note how closely it tracks market action and
does not lag behind price turns as the actual ten-day moving average
does. When the predicted ten-day moving average suggests that a top
or bottom is forming before the actual ten-day moving average does or
when the predicted average crosses the actual ten-day moving aver-
age, that is a signal to buy or sell because it means that the market is
expected to make a turn.
Broadening THe markeT VieW
Forex traders who want to tap the advantages of leading indicators
such as predicted moving averages in today’s fast-moving markets
have to move beyond single-market analysis. It is still necessary to
analyze each market to observe its chart patterns, trendlines, indica-
tors, and so on because they are pieces of information that other trad-
47
FOREX TRADING USING INTERMARKET ANALYSIS
Source: VantagePoint Intermarket Analysis Software (www.TraderTech.com)
ers are watching and using for their trading signals and can provide
further insight about internal market dynamics.
However, with the influence of other currencies and other markets on
forex in today’s global marketplace, traders cannot afford to concen-
trate on analyzing just the internal market dynamics of one market at a
time. Forex traders will have to pay more attention to linkages between
related markets and the “market synergy” that drives these intercon-
nected markets, as is explained in more detail in Chapter 5.
Fi g u r e 4.6.
prediCted moving averages give traders an edge. if traders Compare
a prediCted moving average to today’s aCtual moving average on this
japanese yen Chart, they Can see how the prediCted moving average
turns earlier, giving them an edge of a day or two to get into a position.
5
inTermarkeT
analysis
oF Forex
markeTs
The previous chapters stressed the role of fundamental information
and historical single-market price data in market analysis and the
value of using these forms of analysis for the purpose of price and
trend forecasting. As indicated earlier, traders must look at past price
action to put current price action in perspective. However, in the real
trading world, they must anticipate what will happen to prices if their
analyses are to pay.
To look ahead with confidence, however, traders must look sideways
to what is happening in related markets, which has a major influence
on price action in a target market. What are the external market forces
that affect the internal market dynamics of the target market—that is,
the intermarket context or environment?
moVing Beyond single-markeT
analysis
Intuitively, traders know that markets are interrelated and that a devel-
opment in one market is likely to have repercussions in other markets.
49
TRADE SECRETS
50
No market is isolated in today’s global financial system. Single-mar-
ket analysis, focusing on one chart at a time, has been traditionally
emphasized. However, it fails to keep up with structural changes that
have occurred in financial markets as the global economy has emerged
with advances in telecommunications and increasing internationaliza-
tion of business and commerce.
Many traders still rely on mass-marketed, single-market analysis tools
and information sources that have been around since the 1970s. As a
result, a large percentage of traders lose their trading capital. If traders
continue to do what the masses do, is it not likely that they will end up
losing their hard-earned money, too?
In the forex markets especially, traders cannot ignore the broader
intermarket context affecting the market in which they are trading.
Traders still need to analyze the behavior of individual markets to see
the double tops, broken trendlines, or indicator crossovers that other
traders are following because these are part of the mass psychology
that drives price action. It is increasingly important that traders factor
into their analysis the external intermarket forces that influence each
market being traded.
HisToriCal rooTs
Intermarket analysis is certainly not a new development for traders,
having roots in both the equities and commodities markets. Futures
traders are probably familiar with equities traders who compare
returns between small caps and big caps, one market sector versus
another, a sector against a broad market index, one stock against
another, and international stocks against domestic stocks. Portfolio
managers talk about diversification as they try to achieve the best
performance. Whether they are speculating for profits or arbitraging to
take advantage of temporary price discrepancies, intermarket analysis
in this sense has been part of equities trading for a long time.
51
FOREX TRADING USING INTERMARKET ANALYSIS
Traders in the commodities markets have used intermarket analysis for
a long time, trading spreads that have a reliable track record. Farmers
have been involved in intermarket analysis for years although they may
not have thought of what they do in those terms. When they calculate
what to plant in fields where they have several crop choices—between
corn and soybeans, for example—they typically consider current or
anticipated prices of each crop, the size of the yield they can expect
from each crop, and the cost of production in making their decision.
They do not look at one market in isolation but know that what they
decide for one crop will likely have a bearing on the price of the other,
keeping the price ratio between the two crops somewhat in line on an
historical basis.
The price relationships of corn to soybeans, hogs to cattle, gold to
silver, or Treasury bonds to Treasury notes have been the subject of
intra-commodity and inter-commodity spread analysis and have been
an integral part of technical analysis of the commodities markets for
decades, long before John Murphy and I brought the term “intermarket
analysis” into vogue.
The commodities markets, in turn, have a tremendous effect on the
financial markets such as Treasury notes and bonds, which have a
powerful effect on the equities markets, which have an effect on the
value of the U.S. dollar and forex markets, which has an effect on
commodities. The ripple effect through all markets is a circular cause-
and-effect dynamic, involving inflationary expectations, changes in
interest rates, corporate earnings growth rates, stock prices, and forex
fluctuations. You cannot name a market that is not affected by other
markets or, in turn, does not affect other markets. Whatever the mar-
ket, assets tend to migrate toward the one producing or promising the
highest return. That is as true for forex as any other market.
Traders have probably heard the expression, “If the U.S. economy
sneezes, the rest of the world catches cold” or that the health of the
TRADE SECRETS
52
U.S. economy is the engine that drives the global economy. It works
both ways as a sneeze elsewhere in the world can have a significant
impact on U.S. markets, as was evident during the Asian financial cri-
sis in 1997 and other events over the years that have provided proof, if
any was still needed, of how linked today’s global markets are.
inTermarkeT analysis: THe nexT
logiCal sTeP
A quantitative approach to implement intermarket analysis, which
has been the basis of my research since the mid-1980s, is neither a
radical departure from traditional single-market technical analysis nor
an attempt to undermine it or replace it. Intermarket analysis, in my
opinion, is just the next logical developmental stage in the evolution of
technical analysis, given the global context of today’s interdependent
economies and financial markets.
The bottom line is if traders want to trade forex markets today, they
have to use a trading tool or adopt an approach or trading strategy that
incorporates intermarket analysis in one way or another. An important
aspect of my ongoing research involves analyzing which markets have
the most influence on each other and determining the degree of influ-
ence these markets have on one another.
Hurricaneomic Analysis
SM
is a perfect example of the interconnected-
ness of events and markets and how nothing can be viewed in isolation.
Take the spate of hurricanes that hit the Gulf Coast and Florida in
2005. They did not simply cause local damage to the economy of those
regions. On the contrary, there are hurricaneomic effects that will
ripple throughout the world economy for months and years, impacting
the energy markets, agricultural markets, building materials including
lumber, the federal deficit, interest rates, and, of course, the forex mar-
ket as it pertains to the U.S. dollar. So, hurricaneomic analysis goes
53
FOREX TRADING USING INTERMARKET ANALYSIS
hand-in-hand with intermarket analysis in looking at events such as
natural disasters and their effects on the global financial markets.
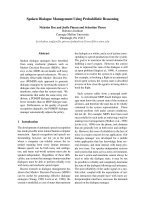
Our research in the ongoing development of VantagePoint since its
introduction in 1991 indicates that, if traders want to analyze the value
of the euro against the U.S. dollar (EUR/USD), for instance, they not
only have to look at euro data but also at the data for the other related
markets to find hidden patterns and relationships that influence the
EUR/USD relationship (Figure 5.1):
• Australiandollar/U.S.dollar(AUD/USD)
• Australiandollar/Japaneseyen(AUD/JPY)
• Britishpound
• Euro/Canadiandollar(EUR/CAD)
Source: Market Technologies, LLC (www.MarketTechnologies.com)
related markets influenCing the eur/usd pair. teChniCal analysis in
the past foCused on one market at a time, but as this diagram illus-
trate, data from related markets have a bearing on the priCe aCtion
of a target market in intermarket analysis.
Fi g u r e 5.1.
TRADE SECRETS
54
• Gold
• Nasdaq100Index
• Britishpound/Japaneseyen(GBP/JPY)
• Britishpound/U.S.dollar(GBP/USD)
• Japaneseyen
When trading the USD/JPY forex pair, traders need to take into
account another set of intermarket relationships including the follow-
ing markets:
• Five-yearU.S.Treasurynotes
• Euro/Japaneseyen(EUR/JPY)
• Gold
• Euro/Canadiandollar(EUR/CAD)
• Euro/U.S.dollar(EUR/USD)
• Britishpound/Swissfranc(GBP/CHF)
• Crudeoil
• Nikkei225stockaverage
• S&P500Index
Many market interrelationships are obvious, but others may seem
more distant and unrelated, such as the importance of stock indices,
U.S. Treasury notes, or crude oil prices on pricing of the USD/JPY
forex pair. Research has verified that these related markets do have
an important influence on a target forex market and can provide early
insights into the forex market's future price direction.
Additionally, through hurricaneomic analysis, data related to events
such as the recent natural disasters in the U.S. can also be incorpo-
rated into forecasting models, along with single-market, intermarket,
and fundamental data. This results in an analytic paradigm that I call
Synergistic Market Analysis
SM
(see Chapter 8).
55
FOREX TRADING USING INTERMARKET ANALYSIS
gold, oil, and Forex
In some cases, the correlation is inverse, especially for markets such
as gold or oil that are priced in U.S. dollars in international trade. The
chart that compares the price of gold and the value of the U.S. dollar
(Figure 5.2) shows that when the U.S. dollar declines, not only do
foreign currencies rise but gold prices also rise. Studies on data from
the last few years have shown a negative correlation between gold and
the dollar of more than minus 0.90—that is, they almost never move in
tandem but almost always move in opposite directions.
The value of EUR/USD versus gold prices, on the other hand, shows a
high positive correlation—that is, the value of the euro and gold prices
often go hand-in-hand, suggesting these markets are both beneficiaries
when funds are flowing away from the U.S. dollar (Figure 5.3).
Source: VantagePoint Intermarket Analysis Software (www.TraderTech.com)
gold and the u.s. dollar—an inverse relationship. this Chart Clearly
shows that gold priCes and the value of the u.s. dollar go in oppo-
site direCtions most of the time, an important input in intermarket
analysis.
Fi g u r e 5.2.