Cash Rules: Learn & Manage the 7 Cash-Flow Drivers for Your Company''''s Success_4 pot
Bạn đang xem bản rút gọn của tài liệu. Xem và tải ngay bản đầy đủ của tài liệu tại đây (161.3 KB, 22 trang )
57
|
well accepted terms in the field of cash-flow analysis; it is
essentially identical to cash after debt amortization from the
UCA cash-flow format.
The basic idea behind the starting point of the indirect
method is that net income in a stable world ought to be avail-
able in cash. The main exception would be an adjustment for
those expenses incurred for accounting purposes though not
involving an actual expenditure during the period. Examples
include depreciation, depletion, amortization and a variety of
expenses reserved for, such as future warranty costs. Since these
not-yet-spent costs have already been subtracted in calculating
Statements of Cash Flow & Analysis of Ratios
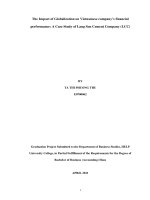
Net income $223,308
Adjustments to reconcile:
Depreciation, amortization $338,233
Fixed asset adjustment (12,411)
Undistributed earnings (52,136)
Change in accounts receivable (197,442)
Change in inventory (46,298)
Change in prepaids 37,905
Change in other current assets 12,243
Change in account payable 372,267
Change in accrued liabilities 226,471
Change in other current liabilities 140,000
Change in non-current income 52,444
Net cash provided by operating activities $1,094,584
Cash flows from investing activities
Capital spending/long-term investments $(676,739)
Net cash used in investing activities $(676,739)
Cash flows from financing activities
Change in short-term financing $(572,376)
Change in long-term financing (29,082)
Change in equity 171,069
Net cash from financing activities $ 430,389
Net increase in cash $(12,544)
Actual change in cash $(12,544)
BOX 4-3
Cash Flow: Indirect Method
CHAPTER FOUR CASH RULES
58
|
net income, the idea is that they need to be added back to get
cash flow.
But under what circumstances does the traditional “cash
flow equals net income plus depreciation” rule of thumb actu-
ally work? The answer is that it is absolutely accurate under
only one set of circumstances. It works
only under conditions of absolute struc-
tural stability, when every balance sheet
and income-statement line item remains
perfectly proportionally the same. (or if
whatever changes do take place should
happen to offset one another exactly).
This implies a world of either great stabil-
ity or incredible coincidence. Neither is a
typical business experience.
In the 1950s, when many of today’s
retiring senior executives were being edu-
cated, the American business scene was
much more stable. Over the years, howev-
er, the pace of business has accelerated
and become subject to many more
changes, both internal and external.
Options have multiplied, the range of
competitors has expanded, the rate of new-product introduc-
tion has exploded, and the role of foreign firms in the array of
suppliers, customers and competitors has gone beyond any-
thing the manager of the ’50s might have imagined. We have
seen and will continue to see new kinds of business combina-
tions and techniques as adaptation to changing technology and
conditions continues. Integration vertically, horizontally and
otherwise will ebb and flow. Conglomeration in various forms
and guises will recur. New cross-border and cross-technology
combinations will develop. Distribution-channel patterns and
industry definitions are shifting in response to deregulation,
technology and consolidation. Rules of thumb based on assump-
tions of stability, therefore, have become downright dangerous
in most cases. With this as background, let’s now examine the
case for the use of the UCA Cash-Flow Statement over the FASB
direct or indirect methods that we have also considered.
The traditional
“cash flow equals
net income plus
depreciation” rule of
thumb actually works
under only one set
of circumstances—
conditions of absolute
structural stability,
when every balance
sheet and income-
statement line item
remains perfectly pro-
portionally the same.
59
|
Why the UCA Cash-Flow Format Is Preferred
The UCA format was developed in the 1970s by Wells Fargo
Bank and promulgated through the banking industry by
Robert Morris Associates (now the Risk Management
Association), which operates to exchange both information and
insights regarding commercial-lending activity. The problem
that bankers were addressing was basically one of movement
from stability to nonstability. Better tools were needed to ana-
lyze the creditworthiness of borrowers in a more complex
world in which the old rules of thumb were no longer reliable.
One of the signal examples of the need for new accounting
tools was the W.T. Grant debacle. Long an American retail
institution, this huge company had undergone a series of
changes in performance, strategy and environmental pressures
that created an enormous gap between traditional rule-of-
thumb cash flow and true cash flow. The big, prestigious
money-center corporate lenders who had a piece of the W.T.
Grant debt package were focused on the rule-of-thumb cash-
flow number and were badly thrown when the company
declared bankruptcy. (Like many things in life, though, bank-
ruptcy can be more or less severe depending on circumstances.
Later in this chapter, we will take a look at the two basic types
of bankruptcy both as a warning and as another perspective on
the centrality of cash-flow management.)
The UCA cash-flow format was designed primarily with
the lender in mind. A major advantage for the lender is that it
focuses on net-cash income to determine whether the compa-
ny is liquid on an operating basis. A current ratio or a quick
ratio tries to answer that question from a static balance-sheet
point of view by relating current assets to current liabilities. But
bankers also need to know the answer from an operating per-
spective. That is to say, did the enterprise cover all cash oper-
ating costs and outflows and pay interest on its debt from inter-
nally generated fuel? If the net-cash income line on the UCA
cash-flow statement is positive, the answer is yes. The same is
true of the net cash from operations lines on the other two
cash-flow statement formats.
A lender is even more interested in there being a clear
enough and large enough expectation of a “yes” at the net-cash
Statements of Cash Flow & Analysis of Ratios
CHAPTER FOUR CASH RULES
income line over the coming periods to ensure debt repayment
as scheduled. If net-cash income isn’t positive in the historical
analysis, there may be little reason to think it will be in the
future. Most first-rate lenders today expect to see reasonable
business projections that show positive
net-cash income adequate to service
proposed debt. Another key focus of the
UCA format, but one not satisfactorily
covered in either of the other formats, is
the line called cash after debt amortization.
This shows whether the company was
able to repay debt as scheduled from
internally generated sources.
The UCA format is helpful to virtu-
ally anyone looking at the firm, not just
lenders. That’s because it is a cash-
adjusted income statement, making it
both familiar in its flow sequence and
logical in its exposition of how the com-
pany normally operates. When you are approaching lenders,
it is always helpful to have information in the form that most
directly addresses their concerns. And positive cash projec-
tions at the cash-after-debt-amortization line on the UCA cash-
flow statement give a positive answer to their critical concern
about whether the company prospectively can generate
enough cash to pay actual or projected debt as scheduled. This
assumes, of course, that the cash-driver assumptions behind
the projections are believable.
Long-Term Viability & Cash Flow
R
evenue growth is a positive sign of your organization’s
ability to meet a societal need. Growth, therefore, rep-
resents some prima facie evidence that your organiza-
tion is doing something worthwhile. But there is a check on
this process. The check is sustainability, the power to keep on
going. Cash flow is the way that this check becomes active. No
cash, no go. If your customers, prospects, supporters,
60
|
The UCA format is
helpful to virtually
anyone looking at the
firm, not just lenders.
That’s because it is a
cash-adjusted income
statement, making it
both familiar in its
flow sequence and
logical in its exposition
of how the company
normally operates.
61
|
patrons, taxpayers or whoever provides your revenue don’t
provide enough of it, in cash, to cover your costs quickly
enough, the organization must radically change. Your com-
pany must retrench, merge, sell off assets or otherwise stop
being what it was and either curtail its
operations or rethink its viability.
There is an old saying that if you
don’t know where you are going, any
road will get you there. A great many
businesses operate by that concept. The
majority, fortunately, do not. But even in
those businesses with a fairly clear plan of
where and how they are moving, the cash
dimensions of that forward motion are
often still pretty fuzzy. It is a rare business in which all the key
people know where their firm is headed, why it is taking that
particular direction, and what the cash implications of that
movement actually look like. If top management is the only
place where that information and sensitivity reside, there will
be a lack of focus and energy as many key people below that
level wander along other roads.
At the very least, management owes it to the business own-
ers and to every key management and supervisory employee to
define a set of cash-driver objectives. These should be well
communicated, achievable and logically explained in terms of
the individual’s job description and sphere of influence. When
this occurs, the organization is optimally positioned for growth-
–not just sales growth, which is not necessarily a good thing,
but real growth—an increasing rate of growth in the firm’s
value. Stated another way, key employees who understand the
cash-flow goals and implications of their choices will almost
always maximize the company’s total economic value. That
value is ultimately rooted in the ability to generate increasing
cash flows over the long term.
Positive cash flow is the measure of sustainability even in
the public sector and in nonprofit organizations. Excess cash
may come directly from operations, or be provided by people
or organizations who value what an organization does enough
to keep it supplied with the fuel to keep things running. In
Statements of Cash Flow & Analysis of Ratios
Management owes
it to the business
owners and to every
key management and
supervisory employee
to define a set of
cash-driver objectives.
business, those people are the customers. In the public sector
they are primarily taxpayers or other political constituencies.
In nonprofit organizations, they are usually a combination of
users and donors. Regardless of your work setting, cash flow
remains the bottom line
Other Measures of
a Company’s Well Being
W
ith all of this emphasis on cash flow, you may well
wonder about other tests, measures and signs of an
organization’s well-being. Should you disregard
more traditional methods of analysis and consider only cash
flow? Certainly not. Profitability is still important. How effi-
ciently you utilize your assets needs to be addressed. Questions
of leverage regarding how well you use your funds still need
to be answered. And clearly, of course, you must be intensely
concerned about liquidity in order to quantify the ability to
meet short-term financial obligations. These four traditional
categories for general financial evaluation—which can be con-
veniently remembered using the acronym PELL for
Profitability, Efficiency, Leverage and Liquidity—all also have
cash-flow implications.
Profitability
The simplest way to think about profitability for cash-flow pur-
poses is to focus on three elements: gross margin, operating-
expense ratio and rule-of-thumb cash flow. Let’s take the last
item first. Because of the unusual simplifying assumptions as to
stability that rule-of-thumb cash flow requires to be an ade-
quate measure, I recommend its use only in one very restrict-
ed circumstance—with those rare companies in which the cash
drivers are virtually the same from year to year.
The two other profitability measures are ones already iden-
tified as cash drivers: gross margin as a percentage of sales, and
operating expense (SG&A) as a percentage of sales. Whatever
CHAPTER FOUR CASH RULES
62
|
63
|
Statements of Cash Flow & Analysis of Ratios
money remains from each sales dollar after paying cost of
goods sold and SG&A is called cushion. Cushion is what’s left
from the business to pay your three most important con-
stituencies: your banker, your government and your stock-
holders. If margins should erode for reasons beyond your con-
trol, cushion can perhaps be shored up by better control of
SG&A. Conversely, if SG&A is unavoidably increasing, you can
look to gross margin to make up the difference either via pric-
ing or via production and purchasing efficiencies. Maintaining
cushion is critical or you’ll risk your ability to meet the needs of
those three constituencies. Let’s look at the long term for
Woody’s Lumber on a common-sized basis going back to 1989
and tracking though to 2000.
SALES 100%
Less: cost of goods sold (52)%
Leaves: gross margin 48%
Less: operating expense (SG&A) (30)%
EQUALS: cushion: 18 %
Less: interest expense (your banker) (5)%
taxes (your government) (4)%
dividends (your stockholders) (4)%
NET INCOME (after taxes and dividends) 5%
Woody’s cushion—what was left from each sales dollar
after paying cost of goods sold and SG&A—immediately began
to shrink, year by year, from the 18% shown above. Over the
next five years, from 1990 to 1994, the cushion dropped to
10.5% at an average rate of 1.5 percentage points annually.
Interest and dividends stayed about the same, and taxes
dropped because of the net-income drop. There are lots of
possibilities that might explain what was happening, of course,
but the problem in this case was not primarily one of operating
management.
In Woody’s case those responsible for the day-to-day oper-
ation of the business were doing excellent work under deteri-
orating market conditions, in a soft economy and with signifi-
cant new competition. They tried reducing SG&A and increas-
ing gross margins with little success. The real problem was not
CHAPTER FOUR CASH RULES
operating management but senior management. (In your com-
pany, the two management categories may be the same group
of people, but that is not the issue. The issue is the quality of the
job being done in each category.)
Senior management’s tasks are
both less immediate and less opera-
tionally oriented than other business
tasks. Its job is to stay ahead of the
curve, to ensure a stream of fresh
opportunities to replace those that are
growing weary. If the company has
traditionally paid out significant divi-
dends, it is a likely sign that senior
management has not been particularly
concerned with investing in new direc-
tions. Perhaps the senior management
team is hoping to prop up the compa-
ny’s stock price with relatively high
dividends in lieu of doing the harder
work of finding high-return invest-
ment opportunities. Those opportuni-
ties must be sought in repositioning the company to meet the
challenge of new products, new markets, new processes and
new technological applications.
In Woody’s case, senior management failed to meet its
responsibilities from ’89 to ’94. As the economy rebounded,
things improved somewhat in late ’94 and into ’95, but the real
gain came as new senior management started remaking the
company in late ’95 and early ’96 with a combination of initia-
tives. These managers relocated most storage to a lower-rent
warehouse that was also considerably more labor-efficient. They
used the savings from that move to cover increases in delivery
costs and tripled their retail space in the original location by
remodeling what had previously been expensive storage. They
used the additional space for a greatly broadened range of high-
er-margin home-improvement products. Computer-imaging
design-center tools helped both sell and document a greatly
increased average sale size through a home-design consulting
emphasis that transformed much of the company’s basic sales
64
|
Senior management’s
job is to stay ahead of
the curve, to insure
a stream of fresh
opportunities to replace
those that are growing
weary. If the company
has traditionally paid out
significant dividends, it
is a likely sign that
senior management has
not been particularly
concerned with investing
in new directions.
65
|
process. By 2000, Woody’s had rebounded 20% beyond its late-
’80s cushion level. It could have done so considerably earlier,
however, had senior management understood the erosion of
cushion as a sign that the basics of the
business were changing and that strate-
gic rather than merely tactical responses
were required.
When it comes to evaluating
longer-term profit potential, two ratios
to be watched are the dividend-payout
ratio and the capital-expenditure ratio.
The dividend-payout ratio should be
declining as the company invests for
innovative growth. The capital-expen-
diture ratio should be rising, most espe-
cially for items related to development
of new opportunities.
Efficiency
Asset utilization has many aspects, and there are several mea-
sures that may logically be used to gauge efficiency. Most
important from an operating-cash-flow point of view are those
asset-efficiency measures relating to inventory and accounts
receivable. As explained earlier, these are most commonly mea-
sured in days. How many days worth of sales are in accounts
receivable, and how many days worth of cost of goods sold are
in inventory?
These are both relative, or proportional, measures.
Generally, as sales go up, the investment in inventory and
accounts receivable tends to go up proportionally, thereby
keeping the days measure the same. For example: If the aver-
age balance of outstanding accounts receivable is one-eighth of
annual sales, then days receivable are
1
/
8 x 365 days = 46 days.
Similarly for inventory: If average inventory value on hand is
one-sixth of annual cost of goods sold, then days inventory are
1
/
6 x 365 days = 61 days.
This measure in days is a relative measure, which makes it
ideal for period-to-period comparisons. It is far more useful
Statements of Cash Flow & Analysis of Ratios
When it comes to
evaluating longer-term
profit potential, two
ratios to be watched
are the dividend-payout
ratio and the capital-
expenditure ratio. The
dividend-payout ratio
should be declining
as the company invests
for innovative growth.
The capital-expenditure
ratio should be rising.
CHAPTER FOUR CASH RULES
than simply comparing absolute dollar values, which could
easily be affected by other variables, including such things as
growth, seasonality or other issues having no basic connection
to the policies and practices by which receivables or inventory
are managed. Other things being
equal, the goal is to manage asset days
(inventory or receivables) downward
and liability days (payables) upward for
maximizing cash flow. Although there
is no necessary connection between
these days measures, the underlying
issues can certainly be intertwined. If,
for example, one of your major suppli-
ers offers longer-than-usual terms for
especially large purchases, then your inventory days and
payables days are likely to both move upward proportionally.
If, on the other hand, the offer isn’t longer terms but signifi-
cantly lower prices on large buys, your inventory days will go
up, payables will move little and the impact will register most-
ly in improved gross margins, unless, of course, you pass along
the savings. And if you do pass along the savings, you may well
wind up with a spike in sales. Everything that happens with a
cash driver has to affect some other measure someplace.
There is an offset to these asset-efficiency measures on the
liability side of the balance sheet in the form of accounts payable.
Since accounts payable consist primarily of amounts owed to
suppliers, they can be considered as offsets to the investment in
inventory. Because of this, days payable should be included in
your evaluation of asset efficiency. Payables, though a liability,
are a sort of contra-inventory account. Although logically
grouped here as asset-efficiency measures, these three ratios are
somewhat better known as
activity ratios because they do, indeed,
say much about turnover or activity rates.
Cash itself is another item of asset efficiency. Unless there is
some particular reason for building cash balances, such as
anticipated acquisitions, cash balances should be no higher
than required to be sure that bills can be paid as they come due.
Cash balances earning bank interest pay little in income.
Investing that cash in the main operating and developmental
66
|
The most important
measures of asset
efficiency from an
operating cash-flow
point of view are those
relating to inventory and
accounts receivable.
67
|
areas of the business should always produce far higher returns.
Return on assets is another broad asset-efficiency mea-
sure. Its calculation is simply net income divided by assets, and
it indicates how efficiently the assets have been deployed for
the production of income. So, for exam-
ple, if net income after tax is $500,000
and total assets are $5,000,000, then
return on assets is 10%. If we turn this
measure upside down, it tells us how
many dollars of assets it takes to gener-
ate a dollar of profit. In this example, it
would be $10. Either way, efficiency of
asset use for producing income is the
measure in view.
The final measure of asset efficiency
is assets divided by sales. Here the focus
is the investment in assets required to
generate a dollar of sales. Because each
sale represents a profit opportunity, this
ratio reveals something about asset effi-
ciency from a marketing perspective. The goal, obviously, is to
get more sales from each dollar of assets employed, thus
increasing the return on investment.
In addition to using and managing assets more efficient-
ly, there is a specific financing dimension to asset efficiency: It
is not always necessary to own an asset to use it, and it is pos-
sible to lease an asset without having it appear on the balance
sheet. While leases that are effectively financing exercises
have to be capitalized—that is, put on the books as both an
asset in use and a liability to be paid—operating leases and
rental arrangements permit use of assets without balance-
sheet impacts. This can have a positive effect on return on
assets by reducing the asset base below what it would be if the
asset were owned outright or capitalized on the books as a
financing lease. The trade-off is that you may actually pay
more for the use of something owned by someone else than
you would if you owned it yourself. The lease-versus-buy
decision needs to be carefully analyzed.
There is still another, high-level dimension to the asset-
Statements of Cash Flow & Analysis of Ratios
Cash itself is another
item of asset efficiency.
Unless there is some
particular reason for
building cash balances,
such as anticipated
acquisitions, cash
balances should be
no higher than required
to be sure that bills
can be paid as they
come due.
CHAPTER FOUR CASH RULES
owning issue when it comes to efficiency of asset use. Rather
than either owning or renting, you may be better off contract-
ing out the entire function. Take the following example. A
fresh-fish wholesaler on the Great Lakes is located in the far
north and has always relied on its fleet of three trucks to deliv-
er to major metropolitan areas. But all
three trucks are now reaching an age
and mileage level at which it is time to
replace them. A local dealership has
offered an operating-lease arrangement
that will keep the new trucks off the
wholesaler’s books and require no up-
front cash outlay. The owners are natu-
rally very interested. The extra cash
freed up by such a lease will help them
with the working capital they need to
start a new export line of whitefish caviar.
In most small companies, especially closely held family busi-
nesses such as this one, the scarcest resource of all, even scarcer
than capital, is
management time. The fish wholesaler’s managers
know the fish business. They spend a lot of time cultivating and
maintaining relationships with their somewhat independent
Native American sources of supply and their big-city restaurant
and broker buyers. They carefully monitor product quality and
handling. New developments in packaging and product-line
extensions to include other fish and fish-related products are
becoming more important. These are the most essential operat-
ing and developmental elements of their business. If the com-
pany is to grow, more management attention must be focused
on these items.
After careful analysis—isolating the transportation issues
realistically and substantially from these other higher-level
management tasks—the company concluded that contracting
out the shipping entirely, rather than leasing or buying new
trucks, would be a good choice. Over an 18-month period, the
company phased itself out of the shipping business. In doing
so, it freed up nearly 20% of the two owners’ time to focus on
the company’s true area of primary value creation, which has
almost nothing to do with overseeing the scheduling, main-
68
|
In most small
companies, especially
closely-held family
businesses, the
scarcest resource of
all, even scarcer
than capital, is
management time.
69
|
taining, supervising and driving of trucks. Here the asset-effi-
ciency issue went far beyond how well trucks were used or
how well the truck-financing decisions were made. Ultimately,
the most important assets of this and other businesses are the
skills and knowledge of the people who best understand the
dynamics of the business and the direc-
tions for its future success. A clear focus
on critical core competencies may well
be the most asset-efficient direction any
company can develop.
Leverage
The primary issue with leverage has to do
not with how efficiently you use assets but
with how efficiently you use your net
worth, or equity, to multiply—or lever-
age—your investment. In other words, the profit your business
returns on equity or net worth should be higher than its return
on assets in proportion to your use of borrowed money to fund
your business.
Too much leverage, though, puts both your organization
and its creditors at risk. Too many liabilities can put your back
to the wall quickly if a few things start to go against you.
Bankers may call in their loans, suppliers won’t ship product,
and good employees may look elsewhere. The employee risk
is even greater if the company is not seen as able to meet its
payroll consistently, or if it is not perceived as staying compet-
itive technologically. Your highly mobile knowledge workers
want to be at least on the cutting edge, if not the bleeding
edge, of their fields. If your firm can’t offer that opportunity
technologically, you may well lose the best, the brightest and
the highest-initiative people on your staff. Too much leverage
exposes you to the risk of not having enough of a financial
shock-absorber to get over the potholes that every business
encounters. In the other direction, too little leverage can force
return on equity below industry norms to the point of making
you less competitive.
The cash-flow implications here are simple. The greater the
Statements of Cash Flow & Analysis of Ratios
The primary issue with
leverage has to do
not with how efficiently
you use assets, but
how efficiently you
use your net worth,
or equity, to multiply—
or leverage—your
investment.
CHAPTER FOUR CASH RULES
leverage, the greater the risk that other people’s fears and deci-
sions can pull the plug. The lower the leverage, the lower the
return available to owners of the business. The right leverage
point or range is largely defined by market forces. Those forces
include investor and creditor expectations that interact around
a variety of perceived trade-offs between risk and reward.
Liquidity
Of the four traditional PELL categories, only liquidity comes
close to what we mean by cash flow. Most commonly, liquidity
is evaluated by looking at the ratio of
short-term assets to short-term liabilities,
called the current ratio. If the short-term
assets—primarily accounts receivable and
inventory—exceed the short-term liabili-
ties by a wide enough margin, there
should be enough cash flowing in. Cash
actually flows in only after conversion from
inventory to sales, then on through receiv-
ables and back again to cash. At that point
it is used to pay suppliers, workers and other short-term oblig-
ations as they come due.
Unfortunately, the current-ratio approach to liquidity is
limited, even though it does give some insight into the likely
ability to meet obligations in the near term. To see that limita-
tion clearly, consider that assets and liabilities are listed on the
balance sheet in order of decreasing liquidity. Another way to
think about the relative liquidity of different categories of
assets and liabilities is to substitute the idea of velocity. The clos-
er a category is to the top of the balance sheet, the quicker the
turnover will be. Cash flows faster than receivables, which flow
faster (usually) than inventory, equipment and real estate.
Thus, the main limitation in assessing liquidity on a balance-
sheet basis is that it has a static, point-in-time orientation; it
completely fails to incorporate the operating perspective of the
income statement. The current ratio is rooted in the point-in-
time values of the balance sheet and therefore says nothing
about operational flows. For that we must go to the cash-flow
70
|
The current ratio
is rooted in the
point-in-time values
of the balance sheet
and therefore says
nothing about
operational flows.
71
|
statement in the form of the UCA’s cash-adjusted income
statement described beginning on page 50.
Ratio Analysis
Ratio analysis is probably most helpful when it is used in time
series across several accounting periods. It shows how man-
agement responds to a variety of conditions. It is not terribly
helpful to learn, for example, that the current net-profit mar-
gin is 4.6% or that the current ratio (short-term assets divided
by short-term liabilities) is 2.5. It is much more significant to
see how these measures move over
time—to see, for example, that leverage
as measured by the debt-to-net-worth
ratio moved gradually upward over a
period of years. Further analysis reveals
that this upward trend in leverage was
accompanied by increased inventory and
receivable days. As it turns out, these
were needed to accommodate a broader
product line and some shift in distribu-
tion channels. Movement and trends in
ratios tell us much more than just a sin-
gle number can because we can infer from such trends much
about management’s probable decision-making patterns.
Another aspect of ratio analysis is what it may tell us prelimi-
narily about likely cash-flow implications; the ratios suggest a cer-
tain type of cash-flow impact. The cash-flow statement then tests
and quantifies that suggestion more specifically. For example,
close inspection of Jones Dynamite Co.’s financials would show
gradual deterioration of the current ratio from 2.2 to 1.8 over a
three-year period and suggest declining liquidity—that is, a
declining ability to pay current expenses from operating sources
of cash. But when we look at the company’s cash-flow statement,
it shows a significantly positive and increasing net cash-income
value over the same three-year period.
The question, then, is which better measures liquidity—
the acceptable and improving operating-cash flow from the
cash-flow statement, or the significantly declining current ratio
Statements of Cash Flow & Analysis of Ratios
Movement and trends
in ratios tell us much
more than just a single
number can because
we can infer from
such trends much
about management’s
probable decision-
making patterns.
CHAPTER FOUR CASH RULES
rooted in the static data from the balance sheet? The static mea-
sure might be more useful if the company were in big trouble
and facing liquidation. In fact, though, most of the time we deal
not with issues of immediate liquidation but with questions of
ongoing operational cashflowability. Our focus is primarily the
going concern and how to keep it going as it continues to gen-
erate most of its own fuel from internal operating sources.
Recall that the inability to do just that is what drove the once
great W.T. Grant Co. into bankruptcy.
The Ultimate Cash-Flow Risk: Bankruptcy
W
hen a business’s cash flow continues to be too much
out and not enough in, the result can be the need
to file for formal bankruptcy. Chapter 11 bankrupt-
cy is the good news of bankruptcy law. It is intended to create
breathing space through temporary relief from creditors so
that a business can reorganize itself and perhaps recover from
its cash-flow failure—that is, begin to create enough positive
cash flow to again pay debts as they come due. Inefficient oper-
ations can be closed down, needed layoffs instituted, nonessen-
tial assets sold at fair market value and debts restructured.
Under a sound Chapter 11 plan with good management,
creditors are likely to be repaid at something near full value. In
contrast, a forced liquidation under Chapter 7 bankruptcies
will likely bring them only fire-sale values. But Chapter 11 is
not available to everyone. It requires the agreement of credi-
tors to an operating-cash-flow plan that is strong enough to
persuade an appointed panel of those creditors to wait for
things to get better. Management must convince the panel that
the prospect of being paid something like full value in cash in
the intermediate term is worth more than fractional repayment
values in the somewhat shorter term. In the absence of confi-
dence in a proposed cure, the plug is pulled and a Chapter 7
liquidation ensues. Under this plan, the frozen illiquid assets
that had not produced adequate cash flow are involuntarily
melted down, usually at considerable loss. They are liquified
and dribbled out to creditors by a court-appointed trustee.
72
|
73
|
The Z Score: A Bankruptcy Early Warning System
The most important thing to learn about bankruptcy is how
to avoid it. Careful management of the seven cash drivers
that will be discussed in the following chapters will certainly
help a company avoid bankruptcy. In addition, there is an
early warning system for bankruptcy that is both easy to use
and free of charge. It is called the Z-Score, and it is a useful
number to track over time to see how your overall company
risk level is moving. Because its calculation involves several of
the ratios we have just reviewed, this is a particularly good
time to look at it more closely. First, however, a few words of
background.
The Z-Score was devised by Dr. Edward Altman at New
York University’s Stern School of Business. The database con-
sisted of manufacturing companies, and the score incorporates
a key ratio tied to the market value of equity. If your company is
not manufacturing firm, the score less relevant. However,
there is a school of thought that says risk is independent of the
industry and, therefore, can be measured simply by analysis of
profitability, efficiency, liquidity and leverage (PELL) ratios.
Altman’s Z-Score formula draws on all four of the ratio cate-
gories but also incorporates one particular ratio that uses mar-
ket value of equity so that you need to come up with some real-
istic estimate of your own market value if you are not a publicly
traded company.
Here’s the formula for determining your Z-Score
Z = 1.2 x 1 + 1.4 x 2 + 3.3 x 3 + .6 x 4 + .999 x 5
X1 = Working capital ÷ Total assets
X2 = Retained earnings ÷ Total assets
X3 = Earnings before interest and taxes (EBIT) ÷ Total assets
X4 = Market value of equity ÷ Liabilities
X5 = Sales ÷ Total assets
Interpret a Z-Score of 3 or better as good. Consider scores
between 1.8 and 2.9 as warning of potential problems. A score
below 1.8 indicates major trouble and a likely descent into
bankruptcy.
No matter where you find your company on this Z-Score
Statements of Cash Flow & Analysis of Ratios
CHAPTER FOUR CASH RULES
scale, an understanding of and attention to the seven cash dri-
vers is the most effective improvement approach available.
Getting Ready for a Closer Look
at the Cash Drivers
A
s we begin to look at the cash drivers one by one,
remember that although these are not the only things
that affect cash flow, they are the drivers. For most
organizations, most of the time, changed measures in the lev-
els of these drivers will account for nearly all of the variability
in cash flow. The sequence in which we will discuss the drivers
represents the most common pattern for relative importance.
Sales growth, the subject of the next chapter, is the biggest
single potential cash-flow driver overall. Gross margin and
operating expense (SG&A) are considered fundamental dri-
vers because they address the issues that a business’s top man-
agement is paid to focus its energies on—the firm’s produc-
tion, buying, marketing and general management dimen-
sions. Accounts receivable, inventory and accounts payable
are considered swing drivers because regardless of what is
happening at the level of the growth rate and fundamentals,
the way these three are managed can swing the company’s
cash position positively or negatively. If, for example, the fun-
damentals are eroding, tighter management of the swing dri-
vers can offset some of the negative impact of that erosion.
Capital expenditures, the seventh driver, is almost always dis-
cretionary.
Increases in a swing driver’s use of cash has both growth
and relative dimensions. A higher sales level alone will tend to
drive up dollars in the swing-driver accounts proportionally to
sales or cost of goods sold in dollar terms. In addition, though,
the choices by which management creates such a sales increase
could also have the effect of changing the proportion. For
example, say that top management decided to offer easier
credit terms as a competitive marketing tool to bring in new
customers. There would certainly be a proportional increase in
74
|
75
|
receivables dollars resulting from the higher level of sales—the
impact of growth. Receivables dollars would also increase
because of the more liberal payment terms. This latter part of
the increase would manifest itself by a jump in the relative mea-
sure of days receivable—the impact of the management decision.
You may wonder how seven items, the cash drivers, can
have such a controlling effect on a firm. Consider for a moment
what is involved. Sales growth, gross margin and operating
expense have embedded in them most of the key dimensions
of the operating part of the income statement. Receivables,
inventory, payables and capital expenditures pick up the main
operating controllables from the balance sheet. These drivers
capture the core of the firm’s financial statements and have
embedded within them all of the company’s key relationships
with employees, customers and suppliers.
Armed with some background on cash flow, a brief
overview of the cash drivers, a primer on basic accounting and
a look at some of the cash-flow implications of traditional ratios
analysis let’s consider each cash driver individually in depth.
Statements of Cash Flow & Analysis of Ratios
The Seven
Cash Drivers
PART TWO CASH RULES
IGNIFICANT CASH-FLOW GROWTH ALMOST ALWAYS STARTS
with sales growth. Maintaining or improving mar-
gins must be a high priority, and operating expense
control is also a critical discipline. Tight control over
the swing factors—receivables, inventory and
payables—can make a substantial difference in cash flow. And
certainly, strategically sound capital budgeting can affect both
cashflowability and profitability for years to come. But it all
starts with sales.
Increased sales have no upper limit, whereas margins,
expense control, swing factor and capital budgeting are all
limited to the particular sales-volume ballpark in which your
business operates. Clearly, expanding the size of the ballpark
is the most important single factor affecting cash flow and,
therefore, the sum of all expected future cash flows. If we dis-
count all those expected future cash flows back to today, we
arrive at the current value of the firm. In many industries,
there are rule-of-thumb valuation formulas, but such formu-
las are ultimately proxies for expectations as to discounted
cash flows. In some ways, therefore, this chapter is not just
S
Sales Growth:
The Dominant Driver
79
|
CHAPTER FIVE CASH RULES
CHAPTER FIVE CASH RULES
about sales growth but about growth in a larger sense; ulti-
mately, it is about growing the value of the firm. Having said
that, though, I want to focus on sales growth as the critical first
step in building the firm’s total value.
The total value of the enterprise is
ultimately the discounted present
value of all likely future cash flows—
and those future cash flows all have to
start with sales.
If you’re not familiar with the idea
of discounted cash flow, consider
applying a reverse compounded interest
rate. A reverse, or negative rate will
reduce principal when applied to a
positive value. For example, a $1,000,
zero-coupon bond that’s due to
mature next year at its face value has a lower value today. Its
present value is its future value a year out minus an amount
equal to the going interest rate on that type of financial instru-
ment. In the same way, the present value of a business is the
sum of all future cash flows discounted back to today. The neg-
ative interest rate we would apply to a company’s future cash-
flow projections is actually a risk-adjusted investment-return
figure. In Chapter 14 we’ll discuss company valuation in depth,
but the point for now is that in talking about sales growth, we
are also talking in a parallel way about value growth.
As we briefly discussed in the previous chapter, there are
two dimensions to the way sales growth affects cash flow—the
growth effect itself and the management effect. Sales growth
will naturally tend to have a somewhat proportional impact on
virtually every other significant income-statement and bal-
ance-sheet line item. This occurs as rising sales figures ripple
through the financial statements period by period. But man-
agement decisions about how to pursue and facilitate that
growth, such as allowing customers easier credit terms or
other changes to the marketing mix can have a substantial
impact on cash flow, too. This challenges management to
respond creatively to the operational issues involved in any
significant growth.
80
|
The present value of a
business is the sum
of all future cash flows
discounted back to today.
The negative interest
rate we would apply to a
company’s future cash-
flow projections is
actually a risk-adjusted
investment-return figure.