Business Ebook John Wiley Sons Inventory Accounting_7 pptx
Bạn đang xem bản rút gọn của tài liệu. Xem và tải ngay bản đầy đủ của tài liệu tại đây (278.92 KB, 22 trang )
141
10
Joint and By-Product
Costing
1
10-1 Introduction
There are many instances where a company will operate a single production process
that results in more than one product, none of which can be clearly identified
through the early stages of production. Examples of such merged production are in
the wood products industry, where a tree can be cut into a wide variety of end prod-
ucts, or meat packing, where an animal can be cut into many different finished
goods. Up to the point where individual products become clearly identifiable in the
production process, there is no clear-cut way to assign costs to products. This issue
is of considerable importance to the inventory accountant, who must have a
consistent method for assigning costs to these items. We will discuss several cost al-
location methods in this chapter that deal with this problem and also note the use-
fulness (or lack thereof) of these allocation methods.
The key point emphasized by this chapter is that the allocation of costs through
any method discussed in this chapter is essentially arbitrary in nature—it results in
some sort of cost being assigned to a joint product or by-product, but these costs are
only useful for financial or tax reporting purposes, not for management decisions.
10-2 The Nature of Joint Costs
To understand joint products and by-products, one must have a firm understanding
of the split-off point. This is the last point in a production process where it is impos-
sible to determine the nature of the final products. All costs that have been incurred
by the production process up until that point—both direct and overhead—must
somehow be allocated to the products that result from the split-off point. Any costs
incurred thereafter can be charged to specific products in the normal manner. Thus,
a product that comes out of such a process will be composed of allocated costs from
1
Adapted with permission from Chapter 15 of Bragg, Cost Accounting: A Comprehensive
Guide, John Wiley & Sons, 2001.
c10_4353.qxd 11/29/04 9:27 AM Page 141
before the split-off point and costs that can be directly traced to it, which occur
after the split-off point.
A related term is the by-product, which is one or more additional products that
arise from a production process, but whose potential sales value is much smaller
than that of the principal joint products that arise from the same process. As we will
see, the accounting for by-products can be somewhat different.
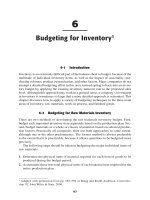
A complication to the joint cost concept is that there can be more than one split-
off point. As noted in Exhibit 10-1, we see the processing in a slaughterhouse, where
the viscera are removed early in the process, creating a by-product. This is the first
split-off point. Then the ribs are split away from the carcass, which is a second split-
off point. The ribs may in turn be packaged and sold off at once, or processed fur-
ther to produce additional products, such as prepackaged barbequed ribs. In this
instance, some costs incurred through the first split-off point may be assigned to
the by-product viscera (more on that later), while costs incurred between the first
and second split-off points will no longer be assigned to the viscera, but must in
turn be assigned to the remaining products that can be extracted from the carcass.
Finally, costs that must be incurred to convert ribs into final products will be as-
signed directly to those products. This is the basic cost flow for joint products and
by-products.
10-3 The Reasoning Behind Joint and By-product Costing
As we will see in the next section, the allocation of costs to products at the split-
off point is essentially arbitrary in nature. Although two standard methods are used,
neither one leads to information that is useful for management decision making.
Why, then, must the inventory accountant be concerned with the proper cost alloca-
tion methodology for joint products and by-products?
142 / Inventory Accounting
Exhibit 10-1 Multiple Split-Off Points for Joint Products and By-products
Full Carcass
Viscera
Remainder
of Carcass
Flavored Rib
Products
Split-off
Point
Split-Off
Point
Ribs
Additional
Processing
c10_4353.qxd 11/29/04 9:27 AM Page 142
Because there are accounting and legal reasons for doing so. Generally accepted
accounting principles (GAAP) require that costs be assigned to products for inven-
tory valuation purposes. Although the costs incurred by a production process up
to the split-off point cannot be clearly assigned to a single product, it is still neces-
sary to find some reasonable allocation method for doing so, in order to obey the
accounting rules. Otherwise, all costs incurred up to the split-off point could rea-
sonably be charged off directly to the cost of goods sold as an overhead cost, which
would result in enormous overhead costs and few direct costs (only those incurred
after the split-off point).
The logic used for allocating costs to joint products and by-products has less to
do with some scientifically derived allocation method and more with finding a quick
and easy way to allocate costs that is reasonably defensible (as we will see in the
next section). The reason for using simple methodologies is that the promulgators
of GAAP realize there is no real management use for allocated joint costs—they
cannot be used for determining break-even points, setting optimal prices, or figur-
ing out the exact profitability of individual products. Instead, they are used for any
of the following purposes, which are more administrative in nature:
Inventory valuation. It is possible to manipulate inventory levels (and therefore
the reported level of income) by shifting joint cost allocations toward those prod-
ucts that are stored in inventory. This practice is obviously discouraged, because
it results in changes to income that have no relationship to operating conditions.
Nonetheless, one should be on the lookout for the deliberate use of allocation
methods that will alter the valuation of inventory.
Income reporting. Many organizations split their income statements into sub-
levels that report on profits by product line or even individual product. If so,
joint costs may make up such a large proportion of total production costs that
these income statements will not include the majority of production costs, un-
less they are allocated to specific products or product lines.
Transfer pricing.A company can alter the prices at which it sells products
among its various divisions, so that high prices are charged to those divisions
located in high-tax areas, resulting in lower reported levels of income tax against
which those high tax rates can be applied. A canny inventory accounting staff
will choose the joint cost allocation technique that results in the highest joint
costs being assigned to products being sent to such locations (and the reverse
for low-tax regions).
Bonus calculations. Manager bonuses may depend on the level of reported prof-
its for specific products, which in turn are partly based on the level of joint costs
allocated to them. Thus, managers have a keen interest in the calculations used to
assign costs, especially if some of the joint costs can be dumped onto products
that are the responsibility of a different manager.
Cost-plus contract calculations. Many government contracts are based on the
reimbursement of a company’s costs, plus some predetermined margin. In this
situation, it is in a company’s best interests to ensure that the largest possible
Joint and By-Product Costing / 143
c10_4353.qxd 11/29/04 9:27 AM Page 143
proportion of joint costs are assigned to any jobs that will be reimbursed by the
customer, while the customer will be equally interested, but because of a desire
to reduce the allocation of joint costs.
Insurance reimbursement. If a company suffers damage to its production or
inventory areas, some finished goods or work-in-process inventory may have
been damaged or destroyed. If so, it is in the interests of the company to fully
allocate as many joint costs as possible to the damaged or destroyed stock, so that
it can receive the largest possible reimbursement from its insurance provider.
Next, we will look at the two most commonly used methods for allocating joint
costs to products, which are based on product revenues for one method and gross
margins for the other.
10-4 Cost Allocation Methodologies
Although several cost allocation methodologies have been proposed in the account-
ing literature, only two methods have gained widespread acceptance. The first is
based on the sales value of all joint products at the split-off point. To calculate it,
the inventory accountant compiles all costs accumulated in the production process
up to the split-off point, determines the eventual sales value of all products created
at the split-off point, and then assigns these costs to the products based on their rel-
ative values. If there are by-products associated with the joint production process,
they are considered to be too insignificant to be worthy of any cost assignment, al-
though revenues gained from their sale can be charged against the cost of goods
sold for the joint products. This is the simplest joint cost allocation method, and it
is particularly attractive, because the inventory accountant needs no knowledge of
any production processing steps that occur after the split-off point.
This different treatment of the costs and revenues associated with by-products
can lead to profitability anomalies at the product level. The trouble is that the deter-
mination of whether a product is a by-product or not can be subjective; in one com-
pany, if a joint product’s revenues are less than 10% of the total revenues earned,
then it is a by-product, whereas another company might use a 1% cutoff figure in-
stead. Because of this vagueness in accounting terminology, one company may as-
sign all of its costs to just those joint products with an inordinate share of total
revenues, and record the value of all other products as zero. If a large quantity of
these by-products were to be held in stock at a value of zero, the total inventory val-
uation would be lower than another company would calculate, simply because of
their definition of what constitutes a by-product.
A second problem with the treatment of by-products under this cost allocation
scenario is that by-products may only be sold off in batches, which may only occur
once every few months. This can cause sudden drops in the cost of joint products
in the months when sales occur, because these revenues will be subtracted from their
cost. Alternately, joint product costs will appear to be too high in those periods
when there are no by-product sales. Thus, one can alter product costs through the
timing of by-product sales.
144 / Inventory Accounting
c10_4353.qxd 11/29/04 9:27 AM Page 144
A third problem related to by-products is that the revenues realized from their
sale can vary considerably, based on market demand. If so, these altered revenues
will cause abrupt changes in the cost of those joint products against which these
revenues are netted. It certainly may require some explaining by the inventory ac-
countant to show why changes in the price of an unrelated product caused a change
in the cost of a joint product! This can be a difficult concept for a nonaccountant
to understand.
The best way to avoid the three issues just noted is to avoid the designation of
any product as a by-product. Instead, every joint product should be assigned some
proportion of total costs incurred up to the split-off point, based on their total po-
tential revenues (however small they may be), and no resulting revenues should be
used to offset other product costs. By avoiding the segregation of joint products
into different product categories, we can avoid a variety of costing anomalies.
The second allocation method is based on the estimated final gross margin of
each joint product produced. The calculation of gross margin is based on the revenue
that each product will earn at the end of the entire production process, less the cost
of all processing costs incurred from the split-off point to the point of sale. This is
a more complicated approach, because it requires the inventory accountant to ac-
cumulate additional costs through the end of the production process, which in turn
requires a reasonable knowledge of how the production process works and where
costs are incurred. Although it is a more difficult method to calculate, its use may
be mandatory in those instances where the final sale price of one or more joint
products cannot be determined at the split-off point (as is required for the first al-
location method), thereby rendering the other allocation method useless.
The main problem with allocating joint costs based on the estimated final gross
margin is that it can be difficult to calculate if there is a great deal of customized
work left between the split-off point and the point of sale. If so, it is impossible to
determine in advance the exact costs that will be incurred during the remaining
production process. In such a case, the only alternative is to make estimates of
expected costs that will be incurred, base the gross margin calculations on this in-
formation, and accept the fact that the resulting joint cost allocations may not be
provable, based on the actual costs incurred.
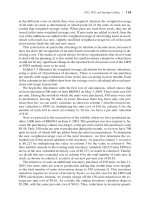
The two allocation methods described here are easier to understand with an ex-
ample, which is shown in Exhibit 10-2. In the exhibit, we see that $250 in joint costs
have been incurred up to the split-off point. The first allocation method, based on
the eventual sale price of the resulting joint products, is shown beneath the split-off
point. In it, the sale price of the by-product is ignored, leaving a revenue split of 59%
and 49% between products A and B, respectively. The joint costs of the process are
allocated between the two products based on this percentage.
The second allocation method, based on the eventual gross margins earned by
each of the products, is shown to the right of the split-off point. This calculation
includes the gross margin on sale of product C, which was categorized as a by-
product, and therefore ignored, in the preceding calculation. This calculation
results in a substantially different sharing of joint costs between the various prod-
ucts than we saw for the first allocation method, with the split now being 39%,
Joint and By-Product Costing / 145
c10_4353.qxd 11/29/04 9:27 AM Page 145
146
Exhibit 10-2
Example of Joint Cost Allocation Methodologies
Total Costs Incurred = $
250.00
Percent
Final of Total Cost
Name Type Revenue Revenues Allocation
Product A Joint $ 12.00 59% $ 148.15
Product B Joint 8.25 41% 101.85
Product C Byproduct — 0%
—
$ 20.25 100% $ 250.00
Costs Margin Percent
Final After After of Total Cost
Revenue Split-Off Split-Off Revenues Allocation
Product A $ 12.00 $ 8.50 $ 3.50 39%
$ 97.22
Product B 8.25 3.00 5.25 58% 145.83
Product C 0.25 — 0.25 3% 6.94
$ 20.50 $ 11.50 $ 9.00 100% $ 250.00
Joint Cost Allocation Based on
Estimated Sales Value at
the Split-off Point
Joint Cost Allocation Based on Gross
Margin After Split-Off Point
Split-off
Point
Final Sale
Point
c10_4353.qxd 11/29/04 9:27 AM Page 146
58%, and 3% between products A, B, and C, respectively. The wide swing in al-
located amounts between the two methods can be attributed to the different bases
of allocation: the first is based on revenue, whereas the second is based on gross
margins.
10-5 Pricing of Joint Products and By-products
The key operational issue for which joint cost allocations should be devoutly ig-
nored is in the pricing of joint products and by-products. The issue here is that the
allocation used to assign a cost to a particular product does not really have any
bearing on the actual cost incurred to create the product—either method for split-
ting costs between multiple products, as noted in the last section, cannot really be
proven to allocate the correct cost to any product. Instead, we must realize that all
costs incurred up to the split-off point are sunk costs that will be incurred, no matter
what combination of products are created and sold from the split-off point forward.
Because everything before the split-off point is considered to be a sunk cost,
pricing decisions are only concerned with those costs incurred after the split-off
point, because these costs can be directly traced to individual products. In other
words, incremental changes in prices should be based on the incremental increases
in costs that accrue to a product after the split-off point. This can result in costs being
assigned to products that are inordinately low, because there may be so few costs
incurred after the split-off point. This can be in response to competitive pressures
or because it only seems necessary to add a modest markup percentage to the incre-
mental costs incurred after the split-off point. If these prices are too low, then the
revenues resulting from the entire production process may not be sufficiently high
for the company to earn a profit.
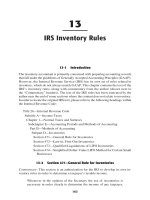
The best way to ensure that pricing is sufficient for a company to earn a profit
is to create a pricing model for each product line. This model, as shown in Exhibit
10-3, itemizes the types of products and their likely selling points, as well as the
variable costs that can be assigned to them subsequent to the split-off point. Thus
far, the exhibit results in a total gross margin that is earned from all joint and by-
product sales. Then we add up the grand total of all sunk costs that were incurred
before the split-off point and subtract this amount from the total gross margin. If
the resulting profit is too small, then the person setting prices will realize that indi-
vidual product prices must be altered in order to improve the profitability of the
entire cluster of products. Also, by bringing together all of the sales volumes and
price points related to a single production process, one can easily see where pricing
must be adjusted in order to obtain the desired level of profits. In the example, we
must somehow increase the total profit by $3.68 in order to avoid a loss. A quick
perusal of the exhibit shows us that two of the products—the viscera and pituitary
gland—do not generate a sufficient amount of throughput to cover this loss. Ac-
cordingly, the sales staff should concentrate the bulk of its attention on the repric-
ing of the other three listed products, in order to eliminate the operating loss.
This format can be easily adapted for use for entire reporting periods or pro-
duction runs, rather than for a single unit of production (as was the case in the last
Joint and By-Product Costing / 147
c10_4353.qxd 11/29/04 9:27 AM Page 147
exhibit). To do so, we simply multiply the number of units of joint products or by-
products per unit by the total number of units to be manufactured during the period,
and enter the totals in the far right column of the same format just used in Exhibit
10-3. The advantage of using this more comprehensive approach is that a production
scheduler can determine which products should be included in a production run
(assuming that more than one product is available) in order to generate the largest
possible throughput.
148 / Inventory Accounting
Exhibit 10-3 Pricing Model for Joint and By-product Pricing
Product Incremental Throughput/ Total
Name Price/ Unit Cost/ Unit Unit No. of Sales Units Throughput
Viscera $.40 $.10 $.30 1 $.30
Barbequed ribs 3.00 1.80 1.20 4 4.80
Flank steak 5.50 1.05 4.35 2 8.70
Quarter steak 4.25 1.25 3.00 4 12.00
Pituitary gland 1.00 .48 .52 1 .52
Total throughput $26.32
Total sunk costs $30.00
Net profit/ loss –$3.68
c10_4353.qxd 11/29/04 9:27 AM Page 148
149
11
Obsolete Inventory
11-1 Introduction
Obsolete inventory is any inventory for which there is no longer any use, either
through inclusion in viable manufactured goods or by direct sale to customers.
Generally accepted accounting principles (GAAP) state that obsolete inventory
must be written off as soon as it is identified. Given the substantial level of inter-
pretation that can be put on the “obsolete inventory” designation, it is evident that
this subject area can have a large adverse impact on profitability. In this chapter,
we review how to find obsolete inventory, how to dispose of it in the most profitable
manner, how much expense to recognize, and how to prevent it from occurring.
11-2 Locating Obsolete Inventory
There are several techniques for locating obsolete inventory, as discussed in this
section. However, be sure to gain the commitment of upper management to this
search first; otherwise, the scope of the resulting expense (which can be substantial)
may lead to multiple rounds of questions regarding how the company could have
found itself saddled with so much obsolete inventory, all of which must be written
off as soon as it is discovered. Conducting a search for obsolete inventory may meet
with a particular level of resistance if the management team is being awarded sig-
nificant profit-based bonuses. If so, consider addressing the prevention of incom-
ing obsolete inventory instead, which may reduce inventory levels over the long
term, although it will not address the existing obsolete inventory.
It is certainly encouraging to see a manager eliminate obsolete inventory, but a
common problem is to see some items disposed of that were actually needed, possi-
bly for short-term production requirements, but also for long-term service parts or
substitutes for other items. In these cases, the person eliminating inventory will
likely be castigated for causing problems that the logistics staff must fix. A good
solution is to form a Materials Review Board (MRB). The MRB is composed of rep-
resentatives from every department having any interaction with inventory issues—
c11_4353.qxd 11/29/04 9:28 AM Page 149
accounting, engineering, logistics, and production. For example, the engineering
staff may need to retain some items that they are planning to incorporate into a new
design, while the logistics staff may know that it is impossible to obtain a rare part,
and so prefer to hold onto the few items left in stock for service parts use.
It can be difficult to bring this disparate group together for obsolete inventory
reviews, so one normally has to put a senior member of management in charge to
force meetings to occur, while also scheduling a series of regular inventory review
meetings well in advance. Meeting minutes should be written and disseminated to
all group members, identifying which inventory items have been mutually declared
obsolete. If this approach still results in accusations that items have been improp-
erly disposed of, then the group can also resort to a sign-off form that must be
completed by each MRB member before any disposition can occur. However, ob-
taining a series of sign-offs can easily cause lengthy delays or the loss of the sign-
off form, and is therefore not recommended. A simpler approach is to use a negative
approval process whereby items will be dispositioned as of a certain date unless an
MRB member objects. The MRB is not recommended for low-inventory situations,
as can arise in a just-in-time (JIT) environment, because an MRB tends to act too
slowly for employees who are used to a fast-moving JIT system.
The simplest long-term way to find obsolete inventory without the assistance of
a computer system is to leave the physical inventory count tags on all inventory
items following completion of the annual physical count. The tags taped to any
items used during the subsequent year will be thrown away at the time of use, leav-
ing only the oldest unused items still tagged by the end of the year. One can then
tour the warehouse and discuss with the MRB each of these items to see if an obso-
lescence reserve should be created for them. However, tags can fall off or be ripped
off inventory items, especially if there is a high level of traffic in nearby bins. Extra
taping will reduce this issue, but it is likely that some tag loss will occur over time.
Even a rudimentary computerized inventory tracking system is likely to record
the last date on which a specific part number was removed from the warehouse for
production or sale. If so, it is an easy matter to use a report writer to extract and
sort this information, resulting in a report listing all inventory, starting with those
products with the oldest “last used” date. By sorting the report with the oldest last-
usage date listed first, one can readily arrive at a sort list of items requiring further
investigation for potential obsolescence. However, this approach does not yield
sufficient proof that an item will never be used again, because it may be an essen-
tial component of an item that has not been scheduled for production in some time,
or a service part for which demand is low.
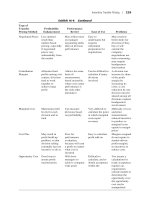
A more advanced version of the last used report is shown in Exhibit 11-1. It
compares total inventory withdrawals to the amount on hand, which by itself may
be sufficient information to conduct an obsolescence review. It also lists planned
usage, which calls for information from a material requirements planning system
and which informs one of any upcoming requirements that might keep the MRB
from otherwise disposing of an inventory item. An extended cost for each item is
also listed, in order to give report users some idea of the write-off that might occur
if an item is declared obsolete. In the exhibit, the subwoofer, speaker bracket, and
150 / Inventory Accounting
c11_4353.qxd 11/29/04 9:28 AM Page 150
wall bracket appear to be obsolete based on prior usage, but the planned use of
more wall brackets would keep that item from being disposed of.
If a computer system includes a bill of materials, there is a strong likelihood
that it also generates a “where used” report, listing all of the bills of material for
which an inventory item is used. If there is no “where used” listed on the report for
an item, it is likely that a part is no longer needed. This report is most effective if
bills of material are removed from the computer system or deactivated as soon as
products are withdrawn from the market; this approach more clearly reveals those
inventory items that are no longer needed.
An additional approach for determining whether a part is obsolete is reviewing
engineering change orders. These documents show those parts being replaced by
different ones, as well as when the changeover is scheduled to take place. One can
then search the inventory database to see how many of the parts being replaced are
still in stock, which can then be totaled, yielding another variation on the amount
of obsolete inventory on hand.
A final source of information is the preceding period’s obsolete inventory re-
port. Even the best MRB will sometimes fail to dispose of acknowledged obsolete
items. The accounting staff should keep track of these items and continue to no-
tify management of those items for which there is no disposition activity.
In order to make any of these review systems work, it is necessary to create
policies and procedures as well as ongoing scheduled review dates. By doing so,
there is a strong likelihood that obsolescence reviews will become a regular part
of a company’s activities. In particular, consider a Board-mandated policy to con-
duct at least quarterly obsolescence reviews, which gives management an oppor-
tunity to locate items before they become too old to be disposed of at a reasonable
price. Another Board policy should state that management will actively seek out and
dispose of work-in-process or finished goods with an unacceptable quality level.
By doing so, goods are kept from being stored in the warehouse in the first place,
so the MRB never has to deal with it at a later date.
Obsolete Inventory / 151
Exhibit 11-1 Inventory Obsolescence Review Report
Last
Item Quantity Year Planned Extended
Description No. Location on Hand Usage Usage Cost
Subwoofer case 0421 A-04-C 872 520 180 $9,053
Speaker case 1098 A-06-D 148 240 120 1,020
Subwoofer 3421 D-12-A 293 14 0 24,724
Circuit board 3600 B-01-A 500 5,090 1,580 2,500
Speaker, bass 4280 C-10-C 621 2,480 578 49,200
Speaker bracket 5391 C-10-C 14 0 0 92
Wall bracket 5080 B-03-B 400 0 120 2,800
Gold connection 6233 C-04-A 3,025 8,042 5,900 9,725
Tweeter 7552 C-05-B 725 6,740 2,040 5,630
c11_4353.qxd 11/29/04 9:28 AM Page 151
11-3 Disposing of Obsolete Inventory
As soon as obsolete inventory is identified, GAAP mandates that it be written off at
once. However, this only applies to the unrecoverable portion of the inventory, so
one should make a strong effort to earn some compensation from an inventory dis-
position. This section outlines several disposition possibilities, beginning with full-
price sales and moving down through options having progressively lower returns.
In some situations, one can recover nearly the entire cost of excess items by ask-
ing the service department to sell them to existing customers as replacement parts.
This approach is especially useful when the excess items are for specialized parts
that customers are unlikely to obtain elsewhere, because these sales can be pre-
sented to customers as valuable replacements that may not be available for much
longer. Conversely, this approach is least useful for commodity items or those sub-
ject to rapid obsolescence or having a short shelf life.
It is possible that some parts should be kept on hand for a few years, to be sold
or given away as warranty replacements. This will reduce the amount of obsoles-
cence expense and also keeps the company from having to procure or remanufac-
ture parts at a later date in order to meet service/repair obligations. The amount of
inventory to be held in this service/repair category can be roughly calculated based
on the company’s experience with similar products, or with the current product if
it has been sold for a sufficiently long period. Any additional inventory on hand
exceeding the total amount of anticipated service/repair parts can then be disposed
of. Of particular interest is the time period over which management anticipates stor-
ing parts in the service/repair category. There should be some period over which the
company has historically found that parts are required, such as five or ten years.
Once this predetermined period has ended, a flag in the product master file should
trigger a message indicating that the remaining parts can be eliminated. Before
doing so, management should review recent transactional experience to see if the
service/repair period should be extended or if it is now safe to eliminate the re-
maining stock.
Another possibility is to return the goods to the original supplier. Doing so will
likely result in a restocking fee of 15% to 20%, which is still a bargain for otherwise
useless goods. Rather than buying back parts for cash, many suppliers will only issue
a credit against future purchases. This option becomes less likely if the company has
owned the goods for a long time, because the supplier may no longer have a need for
them stock them at all. Of course, this approach fails if the supplier will only issue
a credit and the company has no need for other parts sold by the supplier.
It may be possible to sell goods online through an auction service. The best-
known site is eBay, although there are other sites designed exclusively for the
disposition of excess goods, such as www.salvagesale.com. These sites are more
proactive in maintaining contact with potential buyers within specific commodity
categories, and so can sometimes generate higher resale prices.
A poor way to sell off excess inventory to salvage contractors is to allow them
to pick over the items for sale, only selecting those items they are certain to make
152 / Inventory Accounting
c11_4353.qxd 11/29/04 9:28 AM Page 152
a profit on. By doing so, the bulk of the excess inventory will still be parked in the
warehouse when the contractors are gone. Instead, divide the inventory into
batches, each one containing some items of value, which a salvage contractor must
purchase in total in order to obtain that subset of items desired. Then have the con-
tractors bid on each batch. Although the total amount of funds realized may not be
much higher than would have been the case if the contractors had cherry-picked the
inventory, they will take on the burden of removing the inventory from the ware-
house, thereby allowing the company to avoid disposal expenses.
There are some instances where a company can donate excess inventory to a
charity. By doing so, it can claim a tax deduction for the book value of the donated
items. This will not generate any cash flow if the company has no reportable in-
come, but the deduction can contribute to a net operating loss carry-forward that
can be carried into a different tax reporting year. If this approach looks viable, re-
quest a copy of nonprofit status from the receiving entity, proving that it has been
granted nonprofit status under section 501(c)(3) of the Internal Revenue Service
tax code.
Finally, even if there is no hope of obtaining any form of compensation for ob-
solete goods, strongly consider throwing them in the dumpster. By doing so, there
will be more storage space in the warehouse, the space to be allocated to other uses.
Furthermore, the amount of inventory insurance coverage will be less, resulting in
a smaller annual insurance premium. Depending on the local tax jurisdiction, one
can also avoid paying a property tax on the inventory that has been disposed of. In
addition, the number of inventory items to track in the warehouse database can be
reduced, which can lead to a reduction in the number of cycle counting hours re-
quired per day to review the entire inventory on a recurring basis.
11-4 Expense Recognition for Obsolete Inventory
In brief, the proper expense recognition procedure for obsolete inventory is to de-
termine the most likely disposition value for the targeted items, subtract this value
from the book value of the obsolete inventory, and set aside the difference as a re-
serve. As the obsolete inventory is actually disposed of or estimates in the dispo-
sition values change, adjust the reserve account to reflect these alterations.
For example, a review of the Presto Computer Company’s inventory reveals
that it has $100,000 of laptop computer hard drives that it cannot sell. However, it
believes there is a market for the drives through a reseller in Africa, but only at a sale
price of $20,000. Accordingly, the Presto controller recognizes a reserve of $80,000
with the following journal entry:
Debit Credit
Cost of goods sold $80,000
Reserve for obsolete inventory $80,000
Obsolete Inventory / 153
c11_4353.qxd 11/29/04 9:28 AM Page 153
After finalizing arrangements with the African reseller, the actual sale price is only
$19,000, so the controller completes the transaction with the following entry, rec-
ognizing an additional $1,000 of expense:
Debit Credit
Reserve for obsolete inventory $80,000
Cost of goods sold $1,000
Inventory $81,000
Sounds like a simple, mechanical process, doesn’t it? It is not. The first problem
is that one can improperly alter a company’s reported financial results just by alter-
ing the timing of actual dispositions. For example, if a manager knows he can re-
ceive a higher-than-estimated price when selling old inventory, he can accelerate or
delay the sale in order to drop some gains into a reporting period where the extra re-
sults are needed. This is unlikely to be a significant problem if the reserve is small,
but it is a substantial risk if the reverse is the case. For example, the Presto Computer
Company has set aside an obsolescence reserve of $25,000 for laptop computer
fans. However, in January, the purchasing manager knows that the resale price for
fans has plummeted, so the real reserve should be closer to $35,000, which would
call for the immediate recognition of an additional $10,000 of expense. However,
because this would result in an overall loss in Presto’s financial results in January,
he waits until April, when Presto has a profitable month, and completes the sale at
that time, thereby delaying the additional obsolescence loss until the point of sale.
A second problem is the reluctance of management to suddenly drop a large
expense reserve into the financial statements, which may disturb outside investors
and creditors. Managers have a tendency instead to recognize small incremental
amounts, thereby making it look as though obsolescence is a minor problem.
There is no ready solution to this problem, because GAAP clearly mandates that
all obsolete inventory be written off at once. It is a rare accountant who does not
enter into a battle with management over this issue at some point during his or her
career.
A third problem is the shear size of an expense recognition if there has been a
long time period between obsolescence reviews. A review usually occurs at the end
of the fiscal year, when this type of inventory is supposed to be investigated and
written off, usually in conjunction with the auditor’s review or the physical inven-
tory count (or both). If this write-off has not occurred in previous years, the cumu-
lative amount can be startling, which can result in the departure of the materials
manager and/or the controller on the grounds that they should have known about
the problem. There are three ways to keep a large write-off from occurring. First,
conduct frequent obsolescence reviews to keep large write-offs from building up.
Second, create an obsolescence expense reserve as part of the annual budget, and
encourage the MRB to use it all. Under this approach, one can usually count on the
warehouse manager to throw out the maximum possible amount of stock on the first
154 / Inventory Accounting
c11_4353.qxd 11/29/04 9:28 AM Page 154
day when the new budget takes effect. Third, implement some of the approaches
described in the next section to prevent inventory from becoming obsolete.
A final expense recognition issue is that senior management simply may not be-
lieve the MRB when they arrive at an extremely high obsolescence reserve, and
management may reject the recommended expense recognition. Their presumed
knowledge of the business will not allow them to consider that a large part of the
inventory is no longer usable. If this is the case, consider bringing in consultants
to conduct an independent evaluation of the inventory. Senior managers may need
this second opinion before they will authorize a large obsolescence reserve.
11-5 Preventing Obsolete Inventory
Thus far, we have only reviewed a variety of ways to locate, dispose of, and account
for obsolete inventory. The real trick is to avoid all of those topics by ensuring that
there is no obsolete inventory to begin with. This section addresses several ways to
achieve this goal.
A major source of obsolete inventory is excessive purchasing volumes. The
purchasing department may be purchasing in large quantities in order to save itself
the trouble of issuing a multitude of purchase orders for smaller quantities, or be-
cause it can obtain lower prices by purchasing in large volumes. This problem can
be avoided through the use of just-in-time purchasing practices, purchasing only
those items authorized by a material requirements planning system, or by setting
high inventory turnover goals for the materials management department.
A well run purchasing department will use bills of material to determine the
parts needed to build a product and then order them in the quantities specified in the
bills. However, if a bill of material is incorrect, then the items purchased will either
be the wrong ones or the correct ones but in the wrong quantities. To avoid this
problem, the bill of materials should be audited regularly for accuracy. An addi-
tional way to repair bills of material is to investigate why some kitted items are re-
turned unused to the warehouse or additional items are requested by the production
staff. These added transactions usually indicate incorrect bills of material.
It is easy for a part to become obsolete if no one knows where it is. If it is buried
in an odd corner of the warehouse, there is not much chance that it will be used up.
To avoid this problem, there should be location codes in the inventory database for
every part, along with continual cycle counting to ensure that locations are correct.
A periodic audit of location codes will give management a clear view of the accu-
racy of this information.
When the marketing department investigates the possibility of withdrawing a
product from sale, it often does so without determining how much inventory of both
the finished product and its component parts remain on hand. At most, the market-
ing staff only concerns itself with clearing out excess finished goods, because this
can be readily identified. Those unique parts that are only used in the manufacture
of a withdrawn product will then be left to gather dust in the warehouse and will
eventually be sold off as scrap only after a substantial amount of time has passed.
Obsolete Inventory / 155
c11_4353.qxd 11/29/04 9:28 AM Page 155
To avoid this situation, the engineering, marketing, production, and accounting
managers should review all proposed product cancellations to determine how
much inventory will be left “hanging” on the proposed cancellation date. The
result may be a revised termination date designed to first clear out all remaining
stocks.
A related problem is poor engineering change control. If the engineering de-
partment does not verify that old parts are completely used up before installing a
new part in a product, then the remaining quantities of the old part will be rendered
obsolete. To avoid this scenario, have the accounting, production, and engineering
managers determine the best time to effect the change that will minimize the old
stock. Furthermore, if there is an automatic ordering flag in the computer system,
shut it off for any items being withdrawn from use through an engineering change
order. Otherwise, the system will reorder parts that have been deliberately drawn
down below their reorder points.
Some products have limited shelf lives and must be thrown out if they are not
used by a certain date. This certainly applies to all food products and can even be
an issue with such other items as gaskets and seals, which will dry out over time.
In a large warehouse with thousands of inventory items and only a small number of
these limited-life products, it can be difficult to specially track them and ensure that
they will be used before their expiration dates.
A mix of changes must be implemented to ensure proper shelf life control. First,
the computer system must have a record of the ending shelf life date for each item
in the warehouse. This calls for a special field in the inventory record that is not
present in many standard inventory systems, so one must either obtain standard
software containing this feature or have the existing database altered to make this
feature available. The receiving staff must be warned by the computer system upon
the arrival of a limited-shelf-life item, so a flag must also be available in the item
master file for this purpose. With both of these software changes in hand, one can
use the computer system to warn of impending product obsolescence for specific
items. A simpler variation is to still have a flag in the item master file warn of the
arrival of limited-shelf-life items, but to then have the warehouse staff manually
track the obsolescence problem from that point on. This means clearly tagging each
item with its shelf life date, so anyone picking inventory can clearly see which items
must be picked first. Although this solution is much less expensive, it relies on both
the receiving staff and stock pickers to ensure that the oldest items are used first.
A third variation is to use a gravity flow rack. This is a racking system set at a
slight downward angle to the picker and containing rollers. Cartons of arriving items
are loaded into the back of the rack, where they queue up behind cartons containing
older items. Pickers then take the oldest items from the front of the rack. Because of
this load-in-back, pick-in-front configuration, inventory is always used in a first-in,
first-out manner, ensuring that the oldest items are always used first. This is an ex-
cellent way to control item shelf life, because there is no conscious need to pick one
item over another in order to use the oldest one first. Similar racking systems are
available for pallet-sized loads. However, this system does not absolutely ensure that
items will be used before their shelf life dates; if there are many items in front of an
156 / Inventory Accounting
c11_4353.qxd 11/29/04 9:28 AM Page 156
item in a gravity flow rack, or if demand is minimal, then the older item still will not
be used in time.
If one can identify any of these problems as being the cause of obsolescence,
quantify the cost of each problem and aggressively push for any changes that will
eliminate it.
Obsolete Inventory / 157
c11_4353.qxd 11/29/04 9:28 AM Page 157
c11_4353.qxd 11/29/04 9:28 AM Page 158
159
12
Inventory Transactions
12-1 Introduction
This chapter describes the most common inventory-related journal entries. The
first section contains entries for goods in transit, beginning with the receipt of raw
material and progressing through the various types of inventory to their eventual
sale to customers. The second section contains entries listing common adjustments
to inventory, including obsolescence, physical count adjustments, and abnormal
scrap. The final block of entries shows how to shift indirect costs of various kinds
into the overhead cost pool, and then how to allocate these costs back out to either
the cost of goods sold or inventory. For each journal entry, there is a sample de-
scription, as well as the most likely debit and credit for each account used within
the entry.
12-2 Goods in Transit
Record received goods. To increase inventory levels as a result of a supplier
delivery.
Debit Credit
Raw materials inventory xxx
Accounts payable xxx
Move inventory to work-in-process. To shift the cost of inventory to the work-in-
process category once production work begins on converting it from raw materials
to finished goods.
Debit Credit
Work-in-process inventory xxx
Raw materials inventory xxx
c12_4353.qxd 11/29/04 9:28 AM Page 159
Move inventory to finished goods. To shift the cost of completed inventory from
work-in-process inventory to finished goods inventory.
Debit Credit
Finished goods inventory xxx
Work-in-process inventory xxx
Sell inventory. To record the elimination of the inventory asset as a result of a prod-
uct sale, shifting the asset to an expense and also recording the creation of an ac-
counts receivable asset to reflect an unpaid balance from the customer on sale of
the product.
Debit Credit
Cost of goods sold xxx
Finished goods inventory xxx
Accounts receivable xxx
Revenue xxx
12-3 Inventory Adjustments
Adjust inventory for obsolete items: To charge an ongoing expense to the cost of
goods sold that increases the balance in a reserve against which obsolete inventory
can be charged (first entry). The second entry charges off specific inventory items
against the reserve.
Debit Credit
Cost of goods sold xxx
Obsolescence reserve xxx
Obsolescence reserve xxx
Raw materials inventory xxx
Work-in-process inventory xxx
Finished goods inventory xxx
Adjust inventory to lower of cost or market. To reduce the value of inventory to a
market price that is lower than the cost at which it is recorded in the company
records. The second journal entry shows an alternative approach where the credit
is made to an inventory valuation account instead, from which specific write-offs
can be completed at a later date.
160 / Inventory Accounting
c12_4353.qxd 11/29/04 9:28 AM Page 160
Debit Credit
Loss on inventory valuation xxx
Raw materials inventory xxx
Work-in-process inventory xxx
Finished goods inventory xxx
Loss on inventory valuation xxx
Reserve for reduction in inventory value xxx
Adjust inventory to physical count. To adjust inventory balances, either up or down,
as a result of changes in the inventory quantities that are noted during a physical
count. The following entries assume that there are increases in inventory balances.
If there are decreases in the inventory balances, then the debits and credits are
reversed.
Debit Credit
Raw materials inventory xxx
Work-in-process inventory xxx
Finished goods inventory xxx
Cost of goods sold xxx
Write off abnormal scrap/spoilage. To shift unexpected, one-time scrap or spoilage
costs directly to the cost of goods sold, effectively writing off this amount in the cur-
rent period.
Debit Credit
Cost of goods sold xxx
Work-in-process inventory xxx
12-4 Valuation of Inventories
Record normal scrap/spoilage. To shift the normal, expected amount of scrap or
spoilage cost to the overhead cost pool, from where it is allocated as a part of over-
head to inventory.
Debit Credit
Overhead cost pool xxx
Work-in-process inventory xxx
Inventory Transactions / 161
c12_4353.qxd 11/29/04 9:28 AM Page 161
Transfer costs to overhead cost pools. To transfer manufacturing expenses into one
or more overhead cost pools for later allocation to inventory and the cost of goods
sold.
Debit Credit
Overhead cost pool xxx
Maintenance expenses xxx
Manufacturing supplies xxx
Rent, manufacturing related xxx
Repairs, manufacturing related xxx
Salaries, maintenance department xxx
Salaries, materials handling department xxx
Salaries, production control department xxx
Salaries, purchasing department xxx
Salaries, quality control department xxx
Salaries, supervisory xxx
Scrap, normal xxx
Utilities xxx
Depreciation—various accounts xxx
Allocate overhead costs to inventory. To shift the amount of costs built up in the
overhead cost pool to the work-in-process and finished goods inventory categories,
as well as to the cost of goods sold for any inventory sold during the period.
Debit Credit
Cost of goods sold xxx
Work-in-process inventory xxx
Finished goods inventory xxx
Overhead cost pool xxx
Assign manufacturing costs to joint products. Based on the cost assignment method
used, to assign manufacturing cost pools to completed joint products.
Debit Credit
Finished goods inventory xxx
Overhead cost pool xxx
162 / Inventory Accounting
c12_4353.qxd 11/29/04 9:28 AM Page 162