báo cáo hóa học:" Evaluation of oral health-related quality of life among Sudanese schoolchildren using Child-OIDP inventory" pptx
Bạn đang xem bản rút gọn của tài liệu. Xem và tải ngay bản đầy đủ của tài liệu tại đây (313.67 KB, 12 trang )
RESEARC H Open Access
Evaluation of oral health-related quality of
life among Sudanese schoolchildren using
Child-OIDP inventory
Nazik M Nurelhuda
1,2*
, Mutaz F Ahmed
3
, Tordis A Trovik
4
, Anne N Åstrøm
1,2
Abstract
Background: Information on oral health-related quality of life, in addition to clinical measures, is essential for
healthcare policy makers to promote oral health resources and address oral health needs.
Objectives: This paper aimed at evaluating the psychometric properties of the Arabic version of Child-OIDP,
estimating the prevalence, severity and causes of oral impacts on daily performances in 12-year-old public and
private school attendees in Khartoum State and to identify socio-demographic and clinical correlates of oral
impacts as assessed by the Child-OIDP inventory.
Methods: The Child-OIDP questionnaire was translated into Arabic was administered to a representative sample of
1109 schoolchildren in Khartoum state. Clinical measures employed in this study included DMFT index, Gingival
index, Plaque index and Dean’s index. A food frequency questionnaire was used to study the sugar-sweetened
snack consumption.
Results: The instrument showed acceptable psychometric properties and is considered as a valid, reliable
(Cronbach’s alpha 0.73) and practical inventory for use in this population. An impact was reported by 54.6% of the
schoolchildren. The highest impact was reported on eating (35.5%) followed by cleaning (28.3%) and the lowest
impacts were on speaking (8.6%) and social contact (8.7%). Problems which contributed to all eight impacts were
toothache, sensitive teeth, exfoliating teeth, swollen gums and bad breath. Toothache was the most frequently
associated cause of almost all impacts in both private and public school attendees. After adjusting for confounders in
the 3 multiple variable regression models (whole sample, public and private school attendees), active caries
maintained a significant association with the whole sample (OR 2.0 95% CI 1.4-2.6) and public school attendees (OR
3.5 95% CI 2.1-5.6), and higher SES was associated with only public school attendees’ Child-OIDP (OR 1.9 95% 1.1-3.1).
Conclusion: This study showed that the Arabic version of the Child-OIDP was applicable for use among
schoolchildren in Khartoum. Despite the low prevalence of the dental caries pathology (24%), a significant
relationship, with an average moderate intensity was found with OHRQoL. Focus in this population should be on oral
health education, improving knowledge of the prospective treatment opportunities and provision of such services.
Introduction
Health is defined as the complete physical, mental and
social well-being and not merely the absence of disease
or infirmity. This health triangle is a key concept in
achieving acceptab le general and oral health-related
quality of life (OHRQoL) [1]. The majority of studies on
evaluation of oral health status was carried out using
clinical measures only, however, OHRQoL instruments
should be used in conjunction with them [2]. The per-
ceived OHRQoL may vary between cultures, therefore,
the psychometric properties of OHRQoL inventories
should be assessed whenever applied in new socio-
cultural contexts [3].
In literature a number of OHRQoL measures have
been developed to assess and describe the oral impacts
on people’s qual ity of life. Five of these inst ruments
* Correspondence:
1
Department of Clinical Dentistry, Faculty of Medicine and Dentistry -
University of Bergen, Bergen, Norway
Full list of author information is available at the end of the article
Nurelhuda et al. Health and Quality of Life Outcomes 2010, 8:152
/>© 2010 Nurelhuda et al; licensee BioMed Central Ltd. This is an Open Access article distributed under the terms of the Creative
Commons Attribution License (http ://creativecommons.org/licenses/by/ 2.0</url>), which permits unrestricted use, distri bution, and
reproduction in any medium, provided the original work is properly cited.
were desi gned to assess the OHRQoL in children speci -
fically. These include the following questionnaires: Child
Perception Questionnaire (CPQ
11-14
), the Michigan
OHRQoL scale, the Child Oral Health Impact Prof ile
(Child-OHIP), the Early Childhood Oral Health Impact
Scale (ECOHIS) and the Child Oral Impact on Daily
Performance (Child-OIDP). In line with the WHO’ s
International Classification of impairments, disabilities
and handicaps [4], the Child-OIDP focuses on measur-
ing the ultimate impacts of disabilities and handicaps
thus capturing more proximal and intermediate impacts
such as pain, discomfort, functional limitation and dissa-
tisfaction with appearance. This inventory, applied in the
present s tudy, has the ability to provide information on
condition specific imp acts whereby the respondent attri-
butes the imp acts to specific oral conditions or diseases;
thus contributing to the needs assessment and the plan-
ning of oral health care services [5]. The Child-OIDP
was initially developed (in English) in Thailand [6] a nd
has shown to be valid and reliable when applied to chil-
dren in the United Kingdom [7], France [8] , Tanzania
[9], Peru [10], Brazil [11], Spain [12] and Italy [13].
The present study is part of a school-based survey con-
ducted in Khartoum state, Sudan [14]. The results of this
survey revealed that the m ean DMFT of 12-year-old
schoolchildren was 0.4 and that almost one quarter (24%)
of these children had caries experience (DMFT > 0).
Despite the low prevalence and severity of caries, almost
three quarters (73.8%) of the schoolchildren were dissatis-
fied with their oral hea lth. The caries experience was
found to be associa ted with high socio economic statu s
[14] and high levels of Streptococcus sobrinus in saliva [15].
Information on the OHRQoL of this population
should add to the knowledge on dental caries by deter-
mining the magnitude of impact of poor dentition status
on children’ s everyday activities. Reported impacts may
put more emphasis on developing oral health promotion
and care programmes.
This paper aimed at evaluating the psychometric
properties of the Arabic version of Child-OIDP and to
estimate the prevalence, severity and causes of oral
impacts on daily performances in 12-year-old public and
private school attendees in Khartoum State. Secondly,
this study set out to identify socio-demographic- and
clinical correlates of oral impacts as assessed by the
Child-OIDP inventory.
Materials and methods
Sampling procedure
Khartoum state is divided into 7 main localities (Khar-
toum, Jabal Awliya, Omdurman, Ombada, Karary,
Bahry and Sharq al Nil). The sample size was calculated
using an estimated impact prevale nce of 50%, a design
effect of 2, and a precision of 0.06. The minimum
sample size to satisfy these requirements was estimated
to be 550 children in each school sector with dropouts
taken into account (total = 1100). A two stage, stratified
(according to gender and locality) cluster sampling
design with probability proportional to size and school
as the cluster was employed. The cluster size w as esti-
mated to 30 students per school. Thirty-seven schools
were randomly selected from a total of 1866 schools
listed in the area as follows: 8 public boys’ schools,
8 public girls’ schools, 5 public mixed gender schools,
8 private boys’ schools and 8 private girls’ schools. All
12-year-olds in the selected schools were el igible for the
study. The desired number of children was not always
found complete in the randomly selected schools. Extra
schools were thus chosen with the criteria of selection
being the geographical proximity; 58 schools were even-
tually visited. A total of 1117 healthy 12-year-old
schoolchildren were recruited with the following inclu-
sion criteria; healthy children (attending school on the
day of clinical exami nation and who were free from any
serious illness) and those who had not experienced mul-
tiple extractions (> 5 missing teeth). Subsequently, to
generalise to all 12-year-old schoolchildren in Khartoum
state, the whole sample was weighted according to
school sector (public/private = 7/1).
Ethical consideration
Procedures for obtaining consent and ensuring confi-
dentiality were proposed by the ethical research com-
mittees in The Sudan. Written permission to conduct
the study was thus obtained from the authorities a t the
Ministry of Health and Ministry of Education, locality
administration and individual school administration.
Verbal informed consent was obtained from the
participants.
Oral examination
A full mouth oral clinical examination, carried out by a
calibrated dentist, was undertaken from October 2007
to February 2008. Calibration exercises for the clinical
measures were carried out at the University of Bergen.
Caries was assessed under direct sunlight using the
decayed, missing and filled tooth index (DMFT) and in
accordance with the WHO caries diagnostic criteria for
epidemiological studies. The variable ‘ active caries’
reported later, included decayed teeth diagnosed accord-
ing to WHO criteria in both deciduous a nd permanent
dentition [16].
The gi ngival index (GI) [17] an d plaque index (PI) [18]
were used to assess oral hygiene status. GI was i nitially
coded as follows: 1- normal, 2- mild inflammation,
3- m oderate inflammation , 4- sever e inf lammation. PI
was initially coded as follows: 1- no plaque, 2- film of pla-
que, 3- moderate accumulation, 4- abundant
Nurelhuda et al. Health and Quality of Life Outcomes 2010, 8:152
/>Page 2 of 12
accumulation. GI and PI scores were each categorized
into groups: 0 (≤1) and 1 (> 1). The dichotomized va ri-
ables wer e then combined such that a score of 1 on both
variables was coded as (1) and the other alternative com-
binations were coded as (0). This meant that children
with signs of moderate inflammation (bleeding on prob-
ing), and moderate accumulation of plaque on tooth sur-
face, and more were defined as children with poor oral
hygiene . Dean’s index was us ed to record dental fluorosis
[19]. Cases with no signs of fluorosis were coded (0), and
all o ther signs of fluorosis (questionable, very mild, mild,
moderate and severe) were coded as (1). The following
were marked as traumatized; teeth with dark discoloura-
tion, pr esence of swelling or fistula ad jacent to an other-
wise healthy tooth, teeth missing due to trauma a nd a
tooth crown fractured when some of its surface was miss-
ing as a result of trauma [16]. Any child with dental
trauma was given a score of (1).
Questionnaire survey and measures
Structured questionnaires were administered by trained
field assistants. A pilot study conducted prior to the
main study tested the validity of the Adult-OIDP ques-
tionnaire. This instrument was designed for 12-year-olds
and above, however, the children in this study found the
questions complex. Based on these findings, a shift from
the adult to the c hild version of the OIDP was made.
Furthermore, the pilot revealed that children were
unable to respond appropriately to a self-administered
approach, therefore, a shift to a face-to-face interview
was made.
Child-OIDP
Oral health-related quality of life was measured using an
Arabic version of the eight item Child-OIDP question-
naire. The questionnaire, originally constructed in Eng-
lish, was translated into Arabic and back translated by
different translators and subsequently the two English
versions were compared. They were proclaimed accepta-
ble by the first author. The questionnaire was translated
to c lassical Arabic, but read out to eac h student indivi-
dually in a Sudanese dialect to ease the comprehension.
Initially, the participating children were first presented
with a list of 16 impairments; toothache, sensitiv e teeth,
tooth decay (hole in teeth), exfoliating primary teeth,
tooth space (due to a non-erupted permanent tooth),
fractured permanent tooth, colour of tooth, shape or
size of tooth, position of tooth, bleeding gum, swollen
gum, calculus, oral ulcers, bad breath, deformity of
mouth or face, erupting permanent tooth and missing
permanenttooth.Fromthatlist,theschoolchildren
selected the impairments they experienced in the past
3 months. Then, they were aske d about the frequency
and severity of each of the 8 Child-OIDP items, e.g.
‘ Has your oral health affected your eating habits,
speaking, mouth cleaning, rel axing, maintaining your
emotional state, smiling, schoolwork and contact with
people in the past three months?’ If the schoolchild
responded positively, he/she was asked about the fre-
quency and severity of each impact, e.g. “How often did
this happen? How severe was it?’ Asingleimpactfre-
quency scale for individuals affected on a regular basis
was used. The frequency and severity of impacts were
scored on a 3 point Likert scale (1-3) as follows: Fre-
quency scores (1) being once or twice a month, (2)
threeormoretimesamonth,oronceortwiceaweek
(3) three or more times a week. Severity scores; 1 = little
effect, 2 = moderate effect and 3 = severe effect. Lastly,
thechildrenwereaskedtomention the impairments
they thought caused the impact on each performance. A
maximum of 3 impairments per impact were recorded.
From the frequency scores (range between 1-3) of
each of the 8 items, the following variables were con-
structed as described by Gherunpong et al. [20] and
Mtaya et al. [9]:
Child-OIDP simple count score (Child-OIDP-SC) or
Extent (range between 0-8) refers to the number of per-
formances with impacts (PWI) affecting a child’squality
of life in the past 3 months. This score was grouped
into those with impact (frequency score 1 to 3) and
those without impact (score 0).
Child-OIDP ADD Score (range between 0-24) is the
sum of the reported frequencies (range between 0-3) of
the 8 items.
The Impact Score (range between 0-72) is the sum of
the 8 Performance Scores (PS) (range between 0-9). PS is
the product of the severity (range between 0-3) and fre-
quency (range between 0-3) scores. The Overall Impact
is the impact score divided by 72 and multiplied by 100.
Each performance score (range between 0-9) was clas-
sified into 6 levels of intensity following the alternative
scoring method described by Gherungpong et al [20];
non, very little, little, moderate, severe and very severe
impact.
Socio-demographics and behavioural factors
The survey included 9 variables on dichotomous indica-
tors of socioeconomic status [12]. Socio-demographics
were asses sed in terms of parental education and infor-
mation on household assets. A single variable SES was
later calculated using principal c omponent analysis as
described elsewhere [14]. SES was assessed by dividing
the principal component i nto quintiles such that each
household was classified as lowest, lower, low, middle
and higher SES. For the sake of providing a dichoto-
mised variable, the latter two quintiles were combined
to predict ‘middle’ SES and the earlier three for ‘low’
SES. The questionnaire also contained two global self-
rating questions on oral health perceptions; ’What do
you think is the state of your mouth and teeth?’ and ’Are
Nurelhuda et al. Health and Quality of Life Outcomes 2010, 8:152
/>Page 3 of 12
you satisfied with the appearance of your teeth?’ with
oral health status on 4 points Likert scal es ranging from
‘very good’ and ‘good’ (interpr eted as good) to ‘bad’ and
‘very bad’ (interpreted as bad) and ‘very satisfied’ and
‘satisfied’ (interpreted as satisfied) to ‘not satisfied’ and
‘not satisfied at all’ (interpreted as dissatisfied), r espec-
tively. Tooth brushing habits were reported with respect
to frequency (everyday once or more, once every 2
nd
day, once every third day, once a week, irregular or no
tooth-brushing at all) and instruments used for brushing
(tooth brush, miswak-natural toothbrush made from the
twigs of the Salvadora persica tree, finger), agents used
with brushi ng (tooth paste, water, other). Dental history
was recorded based on history of visit to the dental
clinic (have you visited a dental clinic before) and rea-
son for dentist visit (follow-up, pain, other). Sugar-
sweetened snack consumption was measured using a
food frequency questionnaire on the following seven food
items: sweet biscuits, chocolates, pops icles, soft drinks,
sticky dessert and sweets. The report was on 3 times a
week or more and less than three times. The sum score
of all the seven food i tems was calculated and further
dichotomised into 3 items and less, and more than three
items. Therefore a child was categorized a high consumer
of sugar-sw eetened snack s when they consumed more
than 3 items, 3 times a week or more.
Statistical analyses
Statistical analyses were conducted using SPSS 15.0
(SPSS Inc., 2006) and Stata version 10 (StataCorp LP,
2009). Frequencies, mean s and crude percentage agree-
ment were computed for descriptive purpose. Cohen’s
Kappa (n = 20) was applied for test-retest reliability and
Cronbach’s alpha was used for internal consistency relia-
bility. Corrected total and Inter-item correlation were
used to assess internal reliability. Multiple variable logis-
tic regression was applied to assess the relationship of
the Child-OIDP with socio-behavioural characteristics
and clinical oral indicators. Findings reported for all
children were weighted according to school sector (pub-
lic/private = 7/1) to enable generalization to the popula-
tion of 12-year-olds in Khartoum stat e. STATA version
10 was used to adjust for cluster sampling, marking the
strata as the locality, cluster as the school and the pri-
mary sampling unit and the unit of ana lysis being the
schoolchild.
Results
Characteristics of participants
Out of the recruited 1117 participants, 1109 responde d
to the questionnaires (response rate 99%). This sample
of 1109 respondents included 50.1% girls (n = 556) and
50.2% public sch ool attendees (n = 556) as opposed to
private school atte ndees. Students’ socio-demographic
characteristics and c linical parameter scores by school
sector are depicted in Table 1.
Psychometric properties of the Child-OIDP
Internal reliability refers to the extent to which a mea-
sure is consistent within itself [21]. For the OIDP per-
formance scores, the inter-item correlation coefficients
ranged between 0.11 (relationship between smiling and
doing school work) and 0.43 (relationship between
cleaning teeth and eating) (Table 2). All the coefficients
were positive. The standardized Cronbach’s alpha coeffi-
cient was 0.73 for the whole sample, and 0.78 and 0.6 7
for public and private school attendees, respectively.
The alpha value decreased each time an item was
deleted from the model. The corrected item-total corre-
lation values were 0.4 and above for all items.
Test-retest reliability refers to the extent of measure-
ment consistency between different points in time. The
questionnaire was reintroduced to 20 randomly selected
schoolchildren from a single boys’ school with a 10-day-
interim period. Weighted Cohen’ sKappawas0.70for
eating. The Kappa value was 1.00 for the following
Child-OIDP items; speaking, cleaning teeth, relaxing,
sleeping, smiling, social contact and emotional state.
All schoolchildren completed Child-OIDP frequency
inventory providing support for its face validity. As
shown in Table 3, criterion and concurrent validity for
the 8 item Child-OIDP inventory was demonstrated, in
both public and private school attendees, in that the
mean Child-OIDP-SC, Child-OIDP-ADD and overall
impact scores increased as children’ s self reported oral
health changed from good to bad and from satisfied to
dissatisfied. The results were all statistically significant.
Prevalence, extent and intensity of oral impacts
The weighted prevalence estimate of the Child-OIDP
amounted to 54.6%. The corresponding (not weighted)
estimates in private and public school attendees wer e
64% and 53.4%. A total of 18.1% reported one impact,
11.7% reported two impacts, 10.5% reported three
impacts, 6.4% reported four and the remaining 7.9%
reported more than four impacts. With respect to sec-
tor, the private versus the public school attendees’
report for 1,2,3,4 and more impacts was as follows:
23.6% vs 17.5%,16.3% vs 11.0%, 11.4% vs 10.5%, 6.2% vs
5.5% and 6.4% vs 78.%, respectively.
In the weighted sample, the highest impact was
reported on eating (35.5%) followed by cleaning (28.3%)
and the lowest impacts were on speaking (8.6%) and
social contact (8.7%) (Table 4). Private school attendees
reported the highest and lowest impacts on eating (40%)
and speaking (4.3%), respectively. Public school atten-
dees reported highest impact on eating (34%) and the
lowest impact on both social contact and speaking
Nurelhuda et al. Health and Quality of Life Outcomes 2010, 8:152
/>Page 4 of 12
(9.2%). Reported impacts on smiling and emotional sta-
tus differed statistically significantly between public and
private school attendees (p < 0.05). There were no sig-
nificant differences between girls and boys in any per-
formance. The intensity of impact is illustrat ed in Table
5 for the total study group. Most p rivate (44.1%) and
public (46.4%) school attendees’ reports on impact were
of moderate intensity.
Causes of oral impacts
The impairments perceived to cause the impacts on
each of the 8 performances are shown for public and
Table 1 Frequency distribution (%) of participants’ socio-demographic characteristics dental treatment availability and
clinical indicators of private (n = 553) and public (n = 556) school attendees.
Socio-demographic characteristics Public schools
%(n)
Private schools % (n) P-Value #
Father’s education 19.9 (111) 4.2 (23) <.001
Low 52.2 (291) 28.6 (158)
Medium 26.9 (150) 66.7 (368)
High
Mother’s education 23.3 (130) 3.6 (20) <.001
Low 62.5 (348) 54.7 (302)
Medium 13.6 (76) 40.6 (224)
High
Socioeconomic status variable
Low 78.8 (434) 49.8 (273) <.001
Middle 21.2 (118) 50.2 (277)
History of dentist visit 1.1 (6) 3.3 (18) . <.001
Follow-up\checkup 32.3 (180) 60 (331)
Pain 66.6 (371) 36.8 (203)
Never visited
Dental treatment experience
Extraction only 18.3 (102) 32.6 (180) <.001
Others 5.6 (31) 11.4 (63)
Professional therapy for toothache sought 18 (100) 38.6 (213) <.001
Locality
Khartoum 9 (50) 30.4 (168) <.001
Other 91 (506) 69.6 (385)
Tooth brushing
Regular 89.9 (500) 97.3 (538) <.001
Irregular 10.1 (56) 2.7 (15)
Sugar-sweetened snack intake
High consumer 33.8 (188) 32 (177) <.001
Low consumer 66.2 (368) 68 (376)
Past caries experience
DMFT > 0 23.6 (131) 30.2 (167) <.001
DMFT = 0 76.4 (425) 69.8 (386)
Active caries (permanent and deciduous dentition) 30.6 (170) 34.7 (192) 0.141
Present 69.4 (386) 65.3 (361)
Not present
Fluorosis
Present 15.8 (88) 8 (44) <.001
Not present 84.2 (468) 92 (509)
Dental trauma
present 1.8 (10) 2.7 (15) 0.305
Not present 98.2 (546) 97.3 (538)
# P value for Chi-Square test to compare proportions of socio-demographic characteristics between the two school sectors.
Nurelhuda et al. Health and Quality of Life Outcomes 2010, 8:152
/>Page 5 of 12
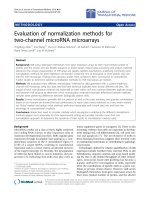
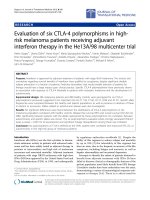
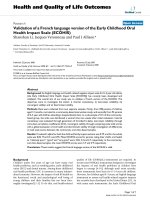
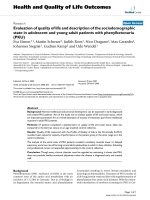
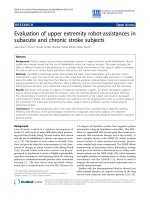
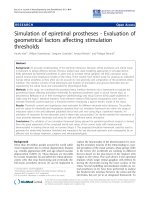
private school attendees in Figures 1 and 2. The most
commonly reported impairment was erupting teeth fol-
lowed by toothache. The i mpairments that contributed
to all the 8 impacts were toothache, sensitive teeth,
exfoliating teeth, swollen gums and bad breath. The
most commonly reported impact was on eating and the
most commonly associated impairment with this was
toothache followed by oral ulceration. Toothache w as
the most f requently associated cause of almost all
impacts in both private and public school attendees. In
private school attendees, the majority of impacts on
smiling were attributed to colour while for public school
attendees, bleeding was the main cause. Among all chil-
dren, colour was the most frequently reported cause of
impact on emotional status.
The Child-OIDP-SC was regressed on socio-demo-
graphics, behavioural and clinical oral health indicators
using bivariate and multiple v ariable logistic regression
analyses (Table 6).
All variables that showed statistically significant asso-
ciation with OIDP in unadjusted analysis; SES, satis-
faction with oral health, perception of oral health,
frequency of sweetened snack intake, mean GI, mean PI,
caries experience and active caries were inserted into
the multiple variable logistic regression analysis model.
The v ariables ge nder, tooth-brushin g frequency,
fluorosis and dental trauma did not show significant
association in unadjusted analyses. However, gender was
reinserted in the multiple variable logistic model for its
importance as a socio-demographic variable, in addition
to it maintaining a st atistical p-value of less than 0.2
[22]. The model b ased on the total sample explained
25% of the variance (Nagelkerke R
2
=0.254)whenall
the select ed variables were inserted simultaneously. The
model explained 35% of the variance for public school
attendees, and 18% for private school attendees.
After adjusting for confounders, satisfaction with and
perception of oral health maintained significance in all
three models; thus providing further support to the validity
of the instrument. Active caries maintained a significant
association with the whole sample (OR 2.0 95% CI 1.4-2.6)
and public school attendees (OR 3.5 95% CI 2.1-5.6).
SES was asso ciated with public school attendees
Child-OIDP only (OR 1.9 95% 1.1-3.1).
Table 2 Pearson’s correlation between single items of the Child-OIDP Performance scores
Performance scores Eating Cleaning teeth Speaking Smiling Relaxing Emotional stability School work Social
Eating 1
Cleaning teeth 0.43 1
Speaking 0.23 0.21 1
Smiling 0.20 0.17 0.22 1
Relaxing 0.36 0.26 0.21 0.22 1
Emotional stability 0.34 0.28 0.27 0.42 0.30 1
School work 0.20 0.18 0.18 0.11 0.28 0.16 1
Social 0.23 0.22 0.27 0.29 0.22 0.28 0.26 1
All coefficients statistically significant at p < 0.05.
Table 3 The Child-OIDP scores by perceived oral health and satisfaction with oral health
Self-rated oral health measures Child-OIDP-SC OIDP-ADD Overall impact Independent samples T test
Mean [29] Mean [29] Mean [29]
Perceived oral health
Public
Good 1.0(1.5) 1.5(2.6) 4.3(8.1)
Bad 3.1(2.1) 5.2(3.8) 16.7(14.4) <0.001
Private
Good 1.1(1.4) 1.8(2.5) 4.9(7.8)
Bad 2.6(1.8) 4.6(3.5) 14.8(13.0) <0.001
Satisfaction with oral health
Public
Satisfied 1.0(1.6) 1.6(2.8) 4.5(9.0)
Not satisfied 2.8(2.0) 4.6(3.5) 14.3(13.3) <0.001
Private
Satisfied 1.1(1.4) 1.8(2.6) 4.8(8.1)
Not satisfied 2.3(1.8) 4.0(3.3) 12.8(12.3) <0.001
Nurelhuda et al. Health and Quality of Life Outcomes 2010, 8:152
/>Page 6 of 12
Discussion
This report provides new and detailed evidence of the
Child-OIDP of public and private school attendees in
Khartoum state, Sudan. An Arabic version o f the CPQ
11-14
has been validated in 11 to 14-year-olds in Saudi
Arabia [23]. However, Brown et al. (21), acknowledged
the limitations of the Arabic CPQ in that it was lengthy
and included some questions that were not pertaining
to the Saudi and Sudanese children such as the difficul -
ties associated with playing musical instruments. Thus,
it was preferre d to translate the Child-OIDP to the Ara-
bic language. This study presents the first attempt to
evaluate the psychometric properties of an Arabic ver-
sion of the Child-OIDP and is the second report on
children’s OHRQoL from an African context [9]. The
psychometric properties of OHRQoL inventories depend
largely on t he linguistic and cultural attributes of the
population under study. A need for testing each instru-
ment when applied in a new socio-cultural context has
been acknowledged [24].
Public and private school attendees differed signifi-
cantly in their socio-behavioural and clinical characteris-
tics (Table 1). Moreover, private school attendees were
the minority in the population (12%) and their schools
tended to be geographically centrally located and better
equipped with respect to school materials when com-
pared to t heir public school co unterparts in the same
locality. For these reasons, analyses were stratified by
school sector.
When applied to 12-year-old Sudanese schoolchildren
attending private as well as public primary s chools, the
Child-OIDP showed acceptable psychometric properties
Table 4 OIDP prevalence, Performance score and Child-OIDP mean for the 8 items on the Child-OIDP scale (n = 1109)
Overall Eating Speaking Cleaning School Smiling Emotion Relax Contact
n = 1109 n = 415 n = 75 n = 312 n = 85 n = 214 n = 265 n = 192 n = 80
OIDP prevalence %(all) 54.6 35.6 8.6 28.3 8.9 16.0 20.3 17.7 8.7
Performance
score
Range
0-9 0-9 0-9 0-9 0-9 0-9 0-9 0-9 0-9
Mean [29] 1.5 (2) 1.3 (2) 0.3(1) 1.0 (2.0) 0.3(1.0) 0.7 (1.9) 0.7 (1.8) 0.6(1.6) 0.3 (1.2)
Overall Eating Speaking Cleaning School Smiling Emotion Relax Contact
n = 556 n = 194 n = 51 n = 158 n = 52 n = 89 n = 107 n = 99 n = 51
OIDP prevalence %
(Public school attendees)
53.4* 35.0 9.2 28.4 9.4 16.0* 19.2 * 17.8 9.2
Overall Eating Speaking Cleaning School Smiling Emotion Relax Contact
n = 552 n = 221 n = 24 n = 154 n = 33 n = 125 n = 158 n = 93 n = 29
OIDP prevalence % (Private school attendees) 64.0 40.0 4.3 27.8 6.0 22.6 28.6 16.8 5.2
* Chi square P < 0.05
Table 5 Percentage of Impact intensity for the 8 items on the Child-OIDP scale for private and public school attendees
(n = 1109)
Impact intensity (%) Eating
n = 415
Speaking
n=75
Cleaning
n = 312
School
n=85
Smiling*
n = 214
Emotion*
n = 265
Relax
n = 192
Contact*
n=80
Total
%
Very little
Private 5.1 0.7 5.6 1.3 2.0 5.1 3.1 1.4 24.3
Public 6.7 1.6 7.0 2.2 2.0 2.7 3.2 1.8 27.2
Little
Private 13.9 1.3 8.1 2.0 4.3 8.3 2.4 1.4 41.7
Public 9.5 2.2 7.6 1.3 4.3 4.5 3.6 1.8 34.8
Moderate
Private 9.8 1.4 8.5 2.2 5.8 7.4 8.1 0.9 44.1
Public 9.7 3.6 7.2 4.5 4.0 6.8 6.8 3.8 46.4
Severe
Private 7.4 0.5 4.0 0.4 4.7 4.9 2.2 0.5 24.6
Public 5.4 0.9 3.4 1.3 3.2 3.6 2.9 0.9 21.6
Very severe
Private 3.8 0.4 1.4 0.2 5.6 2.9 1.1 0.9 16.3
Public 3.6 0.9 3.1 0.2 2.5 1.6 1.1 0.9 13.9
* Difference between reports from different school sectors is statistically significant. Chi square P < 0.05
Nurelhuda et al. Health and Quality of Life Outcomes 2010, 8:152
/>Page 7 of 12
and is considered a valid, reliable and practical inventory
for use in this population. The standard alpha coefficient
was above the recommended threshold of 0.7 [21]. Cor-
responding figures from Thailand, Tanzania, Spain,
France and England regarding Cro nbach’ salphawere
0.82, 0.77, 0.68, 0.57 and 0.58, respectively. The correla-
tion coefficients were all positive and above or equal to
the recommended level of 0.2, with the exception of the
correlation between smiling and each of school work
(0.11) and cleaning (0.17) [25] . Test-retest reliability was
17,9
7,4
11,2
4,2
1,4
3,8
1,3
3,1
1,4
1,1
1,4
4,7
5,9
1,3
1,1
2
4,2
1,3
3,1
5,8
1,1
3,3
11,2
2,4
3,4
1,3
1,8
11,6
1,4
6,5
4,5
1,3
3,8
2,7
2,7
1,3
Eating Speaking Cleaning Relaxing Emotion Smiling School work Contact
Missing
Erupting
Deformity
Bad breath
Oral ulcers
Calculus
Swelling
Bleeding
Position
Shape
Colour
Fracture
Space
Exfoliating
Decay
Sensitive
Toothache
Figure 1 Percentage contribution of perceived impairments associated with performances in public school attendees. (contributions of
less than 1% were excluded).
18,3
4,3
10,1
12,4
10,3
1,6
6,7
3,6
2,5
1,1
1,3
3,2
2
1,4
1,3
4,7
5,9
1,3
1,1
3,6
2,7
3,4
4,9
1,1
2
2,7
1,1
1,1
8,8
2,3
4,1
1,3
2,5
2
3,1
2
2,2
Eating Speaking Cleaning Relaxing Emotion Smiling School work Contact
Missing
Erupting
Deformity
Bad breath
Oral ulcers
Calculus
Swelling
Bleeding
Position
Shape
Colour
Fracture
Space
Exfoliating
Decay
Sensitive
Toothache
Figure 2 Percentage contribution of perceived impairments associated with performances in private school attendees. (contributions of
less than 1% were excluded).
Nurelhuda et al. Health and Quality of Life Outcomes 2010, 8:152
/>Page 8 of 12
Table 6 Child-OIDP (0 = no impacts, 1 = at least one impact) regressed on socio-demographics, behavioral- and
clinical oral health indicators: odds ratio (OR) and 95% Confidence interval (CI), unadjusted and adjusted analyses
Unadjusted Adjusted
Nagelkerke R
2
= 0.350
Public school attendees
n = 514
Adjusted
Nagelkerke R
2
= 0.175
Private school attendees
n = 531
Adjusted
Nagelkerke R
2
= 0.254
Whole sample
n = 1045
Socio-demographic data
Gender
Boy 1 1 1 1
Girl 0.8(0.7-1.1) 0.9 (0.6-1.3) 0.9 (0.6-1.3) 0.8 (0.6-1.1)
School sector
Public 1 1
Private 1.6(1.2-2.0)* 1.2(0.9-1.7)
Locality
Other 1 1 1 1
Khartoum 1.3(1.0-1.8)* 1.5(0.7-3.0) 1.1(0.7-1.7) 1.2(0.8-1.7)
SES
Low 1 1 1 1
Middle 1.4(1.1-1.8)* 1.9(1.1-3.1)* 1.0(0.7-1.5) 1.3(0.9-1.7)
Behavioral variables
Tooth-brushing frequency
Irregular 1.0(0.6-1.7)
Daily
History of dentist visit 11 1 1
No 0.6(0.4-0.7)* 0.9(0.5-1.4) 0.9(0.6-1.3) 0.8(0.6-1.1)
Yes
Satisfaction with oral health
Not satisfied 1 1 1 1
Satisfied 0.2(0.1-0.2)* 0.2(0.1-0.5)* 0.6(0.3-0.9)* 0.4(0.3-0.6)*
Perception of oral health
Bad 1 1 1 1
Good 0.1(0.1-0.2)* 0.2(0.1-0.5)* 0.3(0.2-0.5)* 0.3(0.2-0.4)*
Sugar-sweetened snack intake
≤3 items/week 1 1 1 1
>3 items/week 1.6 (1.2-2.0)* 1.4 (0.9-2.1) 1.4 (0.9-2.2) 1.4 (0.9-1.8)
Clinical parameters
Mean GI index
Score ≤ 111 1 1
Score > 1 1.3(1.0-1.7)* 1.2 (0.7-1.9) 1.5 (0.9-2.5) 1.3 (0.9-1.8)
Mean PI index
Score ≤ 111 1 1
Score > 1 1.3(1.0-1.7)* 1.1(0.6-2.0) 1.3(0.8-2.1) 1.3(0.9-1.8)
Dean’s Index
Score = 0 1
Score > 0 1.1(0.7-1.5)
Caries experience
DMFT = 0 1 1 1 1
DMFT > 1 1.5(1.1-1.9)* 0.9(0.6-1.5) 1.4(0.9-2.2) 1.2(0.9-1.6)
Active caries
No 1 1 1 1
Yes 2.5(1.9-3.4)* 3.5(2.1-5.6)* 1.2(0.7-1.8) 2.0(1.4-2.6)*
Dental trauma
No 1
Yes 1.5(0.6-3.5)
* Chi square P < 0.05
Nurelhuda et al. Health and Quality of Life Outcomes 2010, 8:152
/>Page 9 of 12
confirmed as the weighted kappa indicated very good
reliability for all performances. The present results pro-
vided s upport for the concurrent validity o f this instru-
ment. The Child-OIDP was constructed upon a solid
theoretical basis and the content validity has been
further sufficiently evaluated in other populations
[6,8,10].
Active caries was associated with reported oral
impacts (Child-OIDP score > 0) in unadjusted and
adjusted logistic regression analysis in the total sample
and in public school attendees (P < 0.05) (Table 6).
Pain, discomfort, functional and aesthetic limitations are
known to usually accompany active caries, providing
explanation to our findings. This va riable was con-
structed to focus on decay, a component which is
diluted in a measure of past caries experience like the
DMFT, because of the inclusion of restored and missing
teeth components in it. Furthermore, DMFT measures
the experience in permanent teeth only while in this
study the variable ‘ active caries’ included lesions in
deciduous teeth as well. Other studie s have reported
associations between past caries experience, in the form
of DMFT, and OHRQoL [26,27]. These findings further
stress the necessity for provision of dental care in the
population investigated.
A higher SES status in this study reflected a higher level
of education, a higher social status in terms of parental
occupation and better living standards in terms of better
household conditions and properties. As opposed to the
situation pertaining to the total sample and private
school attendees, public school attendees with middle
level SES were almost twice as likely to report oral impact
on daily performance compared to their counterparts
with low SES independent of oral diseases (Table 6).
A study of Canadian children reported SES disparities in
OHRQoL, where children of a lower SES reported the
higher impact [28]. Thus, it may be deduced from our
study that the understanding of the public school atten-
dees’ need for good OHRQoL increases with an increase
in their SES. This might also reflect higher expectation
with respect to having a good dentition status a mong
affluent compared to non-affluent 12-yea r-olds in Khar-
toum. Their better knowledge and awareness of better
opportunities for oral health care may account for their
report on the high impact, and thus reflects their demand
for a better OHRQoL.
A Medline search was conducted with the following
terms C-OIDP, Child-OIDP and child oral impacts on
daily performance, to find all published studies that
have applied the Child-OIDP instrument. Table 7 illus-
trates a brief comparison. The prevalence of oral
impacts on daily performance in the Sudan (54.6%) was
almost twice as much compared to that reported in a
similar a ge group in Tanzania (28.6%). With the excep-
tion of the UK, all the remaining countries had higher
impact prevalence, emphasizing the socio-cultural
Table 7 A comparison between published Child-OIDP reports. Child-OIDP mean is the mean of the OIDP sumscore
Year Mean age Mean Child-OIDP score Impact
> 0 (%)
Performances with highest impact Most common reported causes
Thailand 2009 12 7.8(7.8) 85.2 Eating
Emotional stability
Sensitive tooth
Oral ulcer
Toothache
France 2005 10 6.3(8.2) 73.2 Eating
Speaking
Badly positioned tooth
Oral ulcer
Erupting tooth
Bleeding gums
UK 2006 10-11 NR 40.4 Eating
Cleaning
NR
Tanzania 2007 13 NR 28.6 Eating
Cleaning
Toothache
Ulcer in mouth
Position of teeth
Peru 2008 11-12 NR 82.0 Eating
Cleaning
Toothache
Sensitive teeth
Bleeding gums
Brazil 2008 11-14 9.2(10.1) 80.7 Eating
Emotional status
Sensitive teeth
Tooth colour
Italy 2009 11-16 1.9(3.7) 94.5 Eating
Cleaning
Sensitive teeth
Tooth ache
Tooth decay
Spain 2009 11-12 2.7(5.6) 36.5 Eating
Cleaning teeth
Sensitive teeth
Toothache
Sudan current
study
12 1.4(1.7) 54.6 Eating
Cleaning
Erupting teeth
Tooth ache
NR: Not reported
Nurelhuda et al. Health and Quality of Life Outcomes 2010, 8:152
/>Page 10 of 12
variation in the Child-OIDP. Despite the high preva-
lence of impact on daily performance compared to Tan-
zania, the intensity of the impact was rarely high among
Sudanese schoolchildren where most reports had a mag-
nitude of little or moderate intensity, and priv ate school
attendees reported a higher frequency of higher intens i-
ties (severe and very severe) compared to their
counterparts.
The difficulty with eating was the most important
aspect of Sudanese schoolchildren’s Child-OIDP. This is
in accordance with results reported in other studies
[7-9,11-13,29,30]. Moreover, in contrast to other reports,
Sudanese children reported erupting teeth (39.6%) as the
most frequent cause of oral impacts. However, this
impai rment may b e overlo oked since it is a natural pro-
cess that cannot be avoided at this age and will subside
eventually, and so the next most reported impairment
was toothache (38.5%). The high report on toothache,
bleeding gums and oral ulcers reflects upon their knowl-
edge of oral and functional problems and indirectly on
their information of treatment availability.
Children’s concern about their aesthetic appearance
becomes significant when they approach adolescence
[31]. Contrary to this, our study suggests that oral
appearance was not one of the main concerns of this
pop ulation because the two least reported impacts were
on the social performances, social contact and smiling
and the least reported impairments were deformity, frac-
ture, missing, space, shape, position and colour. The
cultural norms and expectations influence the percep-
tion of oral health and its effect on their quality of life.
The schoolchildren could be unfamiliar with opportu-
nities for improvement of appearance as a result of lack
of oral health education and shortage in accessible den-
tal health services.
A limitation of this study is in its cross-sectional
desi gn, making it difficult to draw any conclusion about
causes and effects. Further l ongitudinal studies are
needed to better understand and interpret OHRQoL
measures in children; although these are difficult to con-
duct in developing countries due to financial restraints
and lack of population records.
In conclusion, the Arabic Child-OIDP showed accep-
table p sychometric properties a nd is considered a valid,
reliable and practical inventory for use in this popula-
tion. Almost half of the po pulation reported an impact
on their quality of life, mostly on the eating perfor-
mance with the most associated impairments being
erupting teeth and toothache. Child-OIDP was not only
determined by oral disease in the whole population, but
also by the socio-behavioural variables SES in public
school attendees. Despite the low prevalence of the den-
tal caries pathology (24%), a significant relationship with
an average moderate intensity was found with Child-
OIDP. Oral appearance was not one of the main con-
cerns of this population.
A comprehensive assessment of oral health is useful to
oral healthcare policy makers for vital planning of oral
healthcare programmes in order to promote health
resources and address oral health needs and demands.
Focus in this population should be on oral health educa-
tion, improving knowledge of the prospective treatment
opportunities and provision of such services.
Acknowledgements
The study was funded by the University of Bergen (Quota program). We are
grateful to the school authorities, schoolchildren and field assistants for
allocating time to carry out the fieldwork. A special appreciation to Colgate
Company for providing the reward toothpaste offered to the participants.
*Readers are welcome to request the translated Child-OIDP questionnaire
from the authors.
Author details
1
Department of Clinical Dentistry, Faculty of Medicine and Dentistry -
University of Bergen, Bergen, Norway.
2
Centre for International Health,
Faculty of Medicine and Dentistry - University of Bergen, Bergen, Norway.
3
Liverpool University Dental Hospital, UK.
4
Department of Clinical Dentistry -
Preventive Dental Care, Faculty of Medicine and Dentistry, University of
Bergen, Bergen, Norway.
Authors’ contributions
NNM designed the study and carried out the data collection, data analysis
and writing of the article. AAN, TTA and AMF supervised and assisted in
writing/editing of the article. All authors have read and approved the final
manuscript.
Competing interests
The authors declare that they have no competing interests.
Received: 19 April 2010 Accepted: 23 December 2010
Published: 23 December 2010
References
1. WHO: Constitution of the World Health Organisation. 2006 [http://www.
who.int/governance/eb/who_constitution_en.pdf], Access Date 14.08.10.
2. Gherunpong S, Tsakos G, Sheiham A: A sociodental approach to assessing
dental needs of children: concept and models. Int J Paediatr Dent 2006,
16:81-88.
3. Tsakos G, Marcenes W, Sheiham A: Cross-cultural differences in oral
impacts on daily performance between Greek and British older adults.
Community Dent Health 2001, 18:209-213.
4. WHO: International Classification of Impairments, Disabilities, and
Handicaps: A Manual of Classification Relating to the Consequences of
Disease. World Health Organization, Publications Center, 49 Sheridan Ave.,
Albany, NY 12210; 1980.
5. Gherunpong S, Sheiham A, Tsakos G: A sociodental approach to assessing
children’s oral health needs: integrating an oral health-related quality of
life (OHRQoL) measure into oral health service planning. Bull World
Health Organ 2006, 84:36-42.
6. Gherunpong S, Tsakos G, Sheiham A: Developing and evaluating an oral
health-related quality of life index for children; the CHILD-OIDP.
Community Dent Health 2004, 21:161-169.
7. Yusuf H, Gherunpong S, Sheiham A, Tsakos G: Validation of an English
version of the Child-OIDP index, an oral health-related quality of life
measure for children. Health Qual Life Outcomes 2006, 4:38.
8. Tubert-Jeannin S, Pegon-Machat E, Gremeau-Richard C, Lecuyer MM,
Tsakos G: Validation of a French version of the Child-OIDP index. Eur J
Oral Sci 2005, 113:355-362.
9. Mtaya M, Astrom AN, Tsakos G: Applicability of an abbreviated version of
the Child-OIDP inventory among primary schoolchildren in Tanzania.
Health Qual Life Outcomes 2007, 5:40.
Nurelhuda et al. Health and Quality of Life Outcomes 2010, 8:152
/>Page 11 of 12
10. Bernabe E, Sheiham A, Tsakos G: A comprehensive evaluation of the
validity of Child-OIDP: further evidence from Peru. Community Dent Oral
Epidemiol 2008, 36:317-325.
11. Castro RA, Cortes MI, Leao AT, Portela MC, Souza IP, Tsakos G, Marcenes W,
Sheiham A: Child-OIDP index in Brazil: cross-cultural adaptation and
validation. Health Qual Life Outcomes 2008, 6:68.
12. Cortes Martinicorena FJ, Rosel Gallardo E, Artazcoz Oses J, Bravo M,
Tsakos G: Adaptation and validation for Spain of the Child-Oral Impact
on Daily Performance (C-OIDP) for use with adolescents. Med Oral Patol
Oral Cir Bucal 2010, 15(1):106-11.
13. Bianco A, Fortunato L, Nobile CG, Pavia M: Prevalence and determinants
of oral impacts on daily performance: results from a survey among
school children in Italy. Eur J Public Health 2010, 20(5):595-600.
14. Nurelhuda NM, Trovik TA, Ali RW, Ahmed MF: Oral health status of 12-
year-old school children in Khartoum state, the Sudan; a school-based
survey. BMC Oral Health 2009, 9:15.
15. Nurelhuda NM, Al-Haroni M, Trovik TA, Bakken V: Caries experience and
quantification of Streptococcus mutans and Streptococcus sobrinus in
saliva of Sudanese schoolchildren. Caries Research 2010, 44:402-407.
16. Organisation WH: Oral health surveys. Basic methods. Geneva 1997.
17. Loe H, Silness J: Periodontal Disease in Pregnancy. I. Prevalence and
Severity. Acta Odontol Scand 1963, 21:533-551.
18. Silness J, Loe H: Periodontal Disease in Pregnancy. II. Correlation
between Oral Hygiene and Periodontal Condition. Acta Odontol Scand
1964, 22:121-135.
19. Rozier RG: Epidemiologic indices for measuring the clinical
manifestations of dental fluorosis: overview and critique. Adv Dent Res
1994, 8:39-55.
20. Gherunpong S, Tsakos G, Sheiham A: The prevalence and severity of oral
impacts on daily performances in Thai primary school children. Health
Qual Life Outcomes 2004, 2:57.
21. Streiner DL: Starting at the beginning: an introduction to coefficient
alpha and internal consistency. J Pers Assess 2003, 80:99-103.
22. Maldonado G, Greenland S: Simulation study of confounder-selection
strategies. Am J Epidemiol 1993, 138:923-936.
23. Brown A, Al-Khayal Z: Validity and reliability of the Arabic translation of
the child oral-health-related quality of life questionnaire (CPQ11-14) in
Saudi Arabia. Int J Paediatr Dent 2006, 16:405-411.
24. Bowling A, Social Research on health: Sociological and Psychological
concepts and approaches. Research Methods in Health: Investigating Health
and Health Services Open University Press; 2002, 17-53.
25. Kline P: The handbook of psychological testing. Routledge (London) 2000.
26. Do LG, Spencer A: Oral health-related quality of life of children by dental
caries and fluorosis experience. J Public Health Dent 2007, 67:132-139.
27. Robinson PG, Nalweyiso N, Busingye J, Whitworth J: Subjective impacts of
dental caries and fluorosis in rural Ugandan children. Community Dent
Health 2005, 22:231-236.
28. Locker D: Disparities in oral health-related quality of life in a population
of Canadian children. Community Dent Oral Epidemiol 2007, 35:348-356.
29. Krisdapong S, Sheiham A, Tsakos G: Oral health-related quality of life of
12- and 15-year-old Thai children: findings from a national survey.
Community Dent Oral Epidemiol 2009, 37:509-517.
30. Bernabe E, Tsakos G, Sheiham A: Intensity and extent of oral impacts on
daily performances by type of self-perceived oral problems. Eur J Oral Sci
2007, 115:111-116.
31. Smolak L: Body image in children and adolescents: where do we go
from here? Body Image 2004, 1:15-28.
doi:10.1186/1477-7525-8-152
Cite this article as: Nurelhuda et al.: Evaluation of oral health-related
quality of life among Sudanese schoolchildren using Child-OIDP
inventory. Health and Quality of Life Outcomes 2010 8:152.
Submit your next manuscript to BioMed Central
and take full advantage of:
• Convenient online submission
• Thorough peer review
• No space constraints or color figure charges
• Immediate publication on acceptance
• Inclusion in PubMed, CAS, Scopus and Google Scholar
• Research which is freely available for redistribution
Submit your manuscript at
www.biomedcentral.com/submit
Nurelhuda et al. Health and Quality of Life Outcomes 2010, 8:152
/>Page 12 of 12