báo cáo hóa học:" Application of a disease-specific mapping function to estimate utility gains with effective treatment of schizophrenia" pot
Bạn đang xem bản rút gọn của tài liệu. Xem và tải ngay bản đầy đủ của tài liệu tại đây (315.53 KB, 8 trang )
BioMed Central
Page 1 of 8
(page number not for citation purposes)
Health and Quality of Life Outcomes
Open Access
Research
Application of a disease-specific mapping function to estimate
utility gains with effective treatment of schizophrenia
Leslie A Lenert*
1,2
, MarciaFTRupnow
3
and Christine Elnitsky
1,2,4
Address:
1
Veterans Administration San Diego Health Care System, San Diego, California, USA,
2
University of California, San Diego, California,
USA,
3
Janssen Medical Affairs, L.L.C., Titusville, NJ, USA and
4
Health Services Research and Development Service, Department of Veteran Affairs,
Washington, DC, USA
Email: Leslie A Lenert* - ; Marcia FT Rupnow - ; Christine Elnitsky -
* Corresponding author
Abstract
Background: Most tools for estimating utilities use clinical trial data from general health status
models, such as the 36-Item Short-Form Health Survey (SF-36). A disease-specific model may be
more appropriate. The objective of this study was to apply a disease-specific utility mapping
function for schizophrenia to data from a large, 1-year, open-label study of long-acting risperidone
and to compare its performance with an SF-36-based utility mapping function.
Methods: Patients with schizophrenia or schizoaffective disorder by DSM-IV criteria received 25,
50, or 75 mg long-acting risperidone every 2 weeks for 12 months. The Positive and Negative
Syndrome Scale (PANSS) and SF-36 were used to assess efficacy and health-related quality of life.
Movement disorder severity was measured using the Extrapyramidal Symptom Rating Scale (ESRS);
data concerning other common adverse effects (orthostatic hypotension, weight gain) were
collected. Transforms were applied to estimate utilities.
Results: A total of 474 patients completed the study. Long-acting risperidone treatment was
associated with a utility gain of 0.051 using the disease-specific function. The estimated gain using
an SF-36-based mapping function was smaller: 0.0285. Estimates of gains were only weakly
correlated (r = 0.2). Because of differences in scaling and variance, the requisite sample size for a
randomized trial to confirm observed effects is much smaller for the disease-specific mapping
function (156 versus 672 total subjects).
Conclusion: Application of a disease-specific mapping function was feasible. Differences in scaling
and precision suggest the clinically based mapping function has greater power than the SF-36-based
measure to detect differences in utility.
Background
Estimation of cost-effectiveness in clinical trial settings
requires measurement of changes in utility. This is partic-
ularly difficult in diseases that impact cognitive function-
ing, such as schizophrenia or Alzheimer's disease, because
these impairments may preclude direct elicitation of util-
ities in trial participants. Even in cognitively intact per-
sons, direct elicitation often is logistically difficult in
clinical trial settings and therefore rarely done. To over-
come these issues, researchers have developed health
index models to assign a utility to each individual. Health
index models, including the Health Utilities Index,
Published: 11 September 2005
Health and Quality of Life Outcomes 2005, 3:57 doi:10.1186/1477-7525-3-57
Received: 15 June 2005
Accepted: 11 September 2005
This article is available from: />© 2005 Lenert et al; licensee BioMed Central Ltd.
This is an Open Access article distributed under the terms of the Creative Commons Attribution License ( />),
which permits unrestricted use, distribution, and reproduction in any medium, provided the original work is properly cited.
Health and Quality of Life Outcomes 2005, 3:57 />Page 2 of 8
(page number not for citation purposes)
EuroQol (EQ-5D), and the Quality of Well-Being Scale
(QWB), present comprehensive models of quality of life
[1-4]. Measurement of attributes within these models
allows assignment of utility scores based on population
models of values summarized by the index; however, if
these measures were not performed during the study, the
direct application of a health index model is not possible.
Many trials include measurements of health status per-
formed with short-form measures such as the 36-Item
Short-Form Health Survey (SF-36) [5,6]. An alternative to
health index models is to use these data to estimate utility
values. Efforts in this vein began with work by Fryback
and colleagues on mapping between the SF-36 and the
QWB [7] and have been extended by many others [8,9]. A
second approach, described by Brazier and colleagues, has
been to develop a health index based on the content of a
short-form measure and to measure utilities for the mod-
els with larger numbers of states as defined by the short-
form measure [10,11]. A refinement of this method,
which involves using k-means clustering to find a small
number of states that represent patterns of disease effects
on health status, has been described by Lenert and col-
leagues [12]. The primary advantage of this approach is
that it allows direct comparison of implications of differ-
ences between patient and general population values, as is
recommended by the cost-effectiveness analysis guideline
panel [13]. In comparison studies, this approach
appeared to be more responsive than other mapping func-
tions for short-form measures in depression [14].
Use of a health index model or a short-form measure of
health status does not address the issue of disease-specific
effects on quality of life, however. To capture disease-spe-
cific effects, investigators typically measure disease activity
with validated scales specific to a disorder. Other times,
modeling of the symptoms of the disease itself may be
required. In schizophrenia, a commonly used disease
activity measurement scale is the Positive and Negative
Syndrome Scale (PANSS) [15]. This scale measures, via
interview, the total burden of symptoms and impact of
disease. Change in the PANSS may or may not be reflected
in short-form measures such as the SF-36, although they
often are responsive in schizophrenia and other mental
illnesses. In this paper, we describe the application of a
disease-specific utility mapping function based on the
PANSS, incorporating an additional assessment of the
impact of adverse effects of medication into the model.
The methods used to create the model have been
described elsewhere [16,17]. Briefly, a set of disease states
for schizophrenia were developed from the PANSS based
on data from a large, 1-year study that prospectively com-
pared oral risperidone with conventional antipsychotic
agents among patients with schizophrenia who were
treated under usual practice conditions [18]. Data were
analyzed by cluster analysis for five factor domains; clus-
ter analysis results were compared with an expert-devel-
oped conceptual framework of disease states. Using a
combination of the empirical data and the conceptual
framework, eight disease states with varying levels of pos-
itive, negative, and cognitive impairment were estab-
lished. Health states were described in a holistic fashion
that included interactions between effects of symptoms of
the disease and other aspects of quality of life. Utilities
were measured in the general public from a convenience
sample of a large Internet survey panel [19]. Participants
viewed digital videos of actors depicting the eight health
states and five common antipsychotic side effects (aka-
thisia, pseudo-parkinsonism, orthostatic hypotension,
dyskinesia, and clinically important weight gain) and
rated the states using a visual analog scale (VAS) followed
by a standard gamble (SG). The mean utility rating for
each state and the reduction in utility with each adverse
effect were estimated by re-weighting responses so that
calculated mean values matched US population demo-
graphic profiles in age, ethnicity, and gender [17].
We report application of this mapping function to a 50-
week, multicenter, international, open-label study of
long-acting risperidone in patients with schizophrenia
and schizoaffective disorder. Detailed safety and efficacy
results of this study have been published and presented
elsewhere [20,21]. Changes in utility associated with
long-term use of long-acting risperidone were estimated
using the mapping function in patients who completed 50
weeks of therapy. We then compared results to a mapping
function for the SF-36.
Methods
To assess the responsiveness of the utility mapping func-
tion, we applied it to data from an open-label, interna-
tional (Europe and Canada), 50-week trial evaluating the
long-term safety and tolerability of long-acting risperi-
done in 725 patients with schizophrenia or schizoaffec-
tive disorder considered to be stable at study entry
[20,21]. The final protocol for, and any amendments to,
the original study were reviewed and approved by inde-
pendent Ethics Committees or by appropriately consti-
tuted institutional review boards (IRBs) according to
specifications outlined in the US Code of Federal Regula-
tions (CFR). This trial was conducted in accordance with
current International Conference on Harmonisation
(ICH)-Good Clinical Practice guidelines and the Declara-
tion of Helsinki and its subsequent revisions. Patients
were aged 18 to 85 years with a diagnosis of schizophrenia
or schizoaffective disorder according to DSM-IV criteria
[22] and were judged to be clinically stable (stable symp-
toms and antipsychotic dose for at least 1 month).
Health and Quality of Life Outcomes 2005, 3:57 />Page 3 of 8
(page number not for citation purposes)
Trial medication
During a 2-week run-in period, antipsychotics other than
risperidone were discontinued, and patients not currently
being treated with risperidone received flexible doses of 1
to 6 mg/daily of oral risperidone. Assessments performed
prior to this run-in period, however, were considered as
the baseline for this analysis. By protocol, pharmacoki-
netic considerations, and investigator judgment, patients
were assigned to flexible-dose treatment with 25, 50, or 75
mg long-acting risperidone given by intramuscular gluteal
injection every 2 weeks. The investigator could adjust the
dose of long-acting risperidone when necessary. Medica-
tions other than long-acting risperidone that could be ini-
tiated or continued during the trial included
anticholinergic agents, antidepressants, mood stabilizers,
propranolol for akathisia, and benzodiazepines for agita-
tion and insomnia.
Assessments
PANSS total scores [15] and health-related quality-of-life
assessments, measured by the SF-36 [5,6], were collected
at weeks 1, 12, 24, 36, 50, and at endpoint. Adverse effects
of treatment were assessed at the same time points, using
the Extrapyramidal Symptom Rating Scale (ESRS) [23] to
determine the Clinical Global Impression (CGI) of sever-
ity of parkinsonism, dystonia, and dyskinesia, and
adverse-effect reporting to document weight gain and
hypotension. Values for systolic blood pressure, pulse,
and weight were obtained at baseline and endpoint.
Analysis plan
Disease states were assigned at each observation based on
the mean value of each patient's PANSS items using the
model developed by Mohr and colleagues [16]. For
patients completing at least 50 weeks of treatment, the
mean values of VAS and SG utility were calculated from
the PANSS, and VAS and SG utility were calculated from
the SF-36. VAS and SG utilities calculated from the PANSS
were adjusted for adverse effects using a multiplicative
model. An individual with a score of ≥4 on any of the
ESRS subscales for parkinsonism, dystonia, or dyskinesia
was ascribed as having that adverse effect. An individual
was ascribed as having orthostatic hypotension for the
entire duration of the study if upon exit from the trial, the
patient exhibited a ≥20-mm Hg drop in standing blood
pressure. Patients with a gain of ≥10 kg (≥22.4 lb) during
the study were assessed a utility tariff for weight gain.
These measurements were performed only at 24 weeks, 50
weeks, and endpoint. Missing data were estimated using a
last-value-carried-forward approach in patients complet-
ing the study.
Estimated utility values at each point in time were com-
pared using the Wilcoxon signed rank test. Overall gains
in utility over the course of the study were calculated by
subtracting baseline from endpoint values and compared
with those estimated from an SF-36-based mapping func-
tion developed by Nichol and colleagues [8]. These calcu-
lations were used to compare both the magnitude of the
estimated utility gains and the correlation of the gains
between the two mapping functions. To compare the
responsiveness of the measures, we took the standard
deviation of SF-36-based and clinically based utility meas-
ures at baseline and endpoint and the effect size seen in
this study for each measure and estimated the sample size
required for a clinical trial to confirm the effect seen in this
observational study.
Results
A total of 725 symptomatically stable patients with schiz-
ophrenia (n = 615) or schizoaffective disorder (n = 110),
received long-acting risperidone treatment. Four hundred
seventy-four patients (65.3%) completed the trial. Demo-
graphic characteristics of patients who completed or dis-
continued the study are displayed in Table 1. The only
significant difference in baseline characteristics between
those who completed the study and those who discontin-
ued was the mean age.
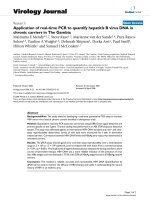
A graphic depiction of the eight health states used in the
PANSS-based mapping function is provided in Figure 1.
Each health state represents a set of symptoms ranging
from mild to very severe, with patients having mild dis-
ease (health state 1) displaying low symptoms, and
patients in the very severe disease state (health state 8) dis-
playing high symptoms, with the exception of cognitive
impairment, which could be either high or low. Two sep-
arate groups are considered to have moderate symptoms
(health states 2, 3), while 4 health states (states 4–7)
describe patients with severe symptoms [16]. The distribu-
tion of these health states at the beginning and endpoint
of the trial are shown in Figure 2. Patients who completed
treatment with long-acting risperidone experienced sub-
stantial symptomatic improvement over the 1-year study.
Importantly, the percentage of patients in health state 1
(representing full remission of symptoms) increased sig-
nificantly, from 25% to 42% over the course of the study
(P < 0.001, McNemar's test). The impact of this shift was
significant. Considering symptoms of schizophrenia
alone, mean SG-weighted utilities increased significantly,
from 0.729 at baseline to 0.775 at endpoint (P < 0.001,
Wilcoxon signed rank test), with a net gain of 0.046. VAS-
weighted ratings yielded similar results, with a gain in util-
ity equaling 0.058 from baseline (0.538) to endpoint
(0.596, P < 0.001, Wilcoxon signed rank test).
The incidence of common antipsychotic-associated
adverse effects over the course of the study (parkinsonism,
akathisia, dyskinesia, orthostatic hypotension, and weight
gain) was assessed. Movement disorder side effects
Health and Quality of Life Outcomes 2005, 3:57 />Page 4 of 8
(page number not for citation purposes)
Table 1: Demographics and Baseline Disease Characteristics for Patients Who Completed or Discontinued the Study
Parameter Patients Who Completed the
Study (n = 474)
Patients Who Discontinued
(n = 251)
P value Between Groups*
Age, y (mean ± SE) 43.7 ± 0.7 39.3 ± 0.9 <0.0001
Sex 0.730
Female, n (%) 162 (34.2) 89 (35.5)
Male, n (%) 312 (65.8) 162 (64.5)
Race 0.502
Caucasian, n (%) 440 (92.8) 231 (92.0)
Black, n (%) 8 (1.7) 8 (3.2)
Asian, n (%) 6 (1.3) 5 (2.0)
Hispanic, n (%) 4 (0.8) 2 (0.8)
Other, n (%) 16 (3.4) 5 (2.0)
Diagnosis 0.650
Schizophrenia, n (%) 400 (84.4) 215 (85.7)
Schizoaffective disorder, n (%) 74 (15.6) 36 (14.3)
SE indicates standard error. *Chi-square test.
Symptom description for the eight health states used in the PANSS-based mapping functionFigure 1
Symptom description for the eight health states used in the PANSS-based mapping function. PANSS indicates
Positive and Negative Syndrome Scale; Neg, negative symptoms; Pos, positive symptoms; Cog, cognitive impairment; MOD,
moderate symptom impairment. Adapted from Mohr PE, Cheng CM, Claxton K, et al. [16]. Reproduced with permission.
MildMild
ModerateModerate
Negative
Predominant
Cognitive
Impairment
Predominant
SevereSevere
Positive
Predominant
Very SevereVery Severe
Neg
Pos
Cog
1
Neg
Pos
Cog
4
Neg
Pos
Cog
5
Neg
Pos
Cog
6
Neg
Pos
Cog
2
Neg
Pos
Cog
3
Low Moderate High
Level of Impairment
Neg
Pos
Cog
8
Neg
Pos
Cog
7
Health and Quality of Life Outcomes 2005, 3:57 />Page 5 of 8
(page number not for citation purposes)
decreased over time, reflected in lower frequencies of
moderate or severe parkinsonism (from 25.6% to 15.4%),
akathisia (from 9.4% to 4.2%), and dyskinesia (from
13.6% to 9.5%) at endpoint. The occurrence of orthostatic
hypotension overall was low; only 4 cases were reported
during the study. Weight gain was the only adverse effect,
with increased frequency over time. During the study, 51
patients gained ≥20 pounds, thus meeting the criteria for
the utility tariff.
Adverse effects, as may be expected, impacted utility gains.
Because adverse effects overall decreased with treatment
over the course of the study, further gains in utility were
realized (Table 2). Gains were 0.051 for SG-weighted
comparisons and 0.064 for VAS-weighted comparisons
after adjusting for adverse effects. Changes in utility from
baseline to endpoint were statistically significant for both
comparisons (P < 0.001, Wilcoxon signed rank test).
Utility changes were estimated by a second method,
which used the approach devised by Nichol and col-
leagues of mapping SF-36 domain scores to Health Utility
Index (HUI) Mark II scores [8]. By this method, we found
the average baseline utility to be 0.762. As with the dis-
ease-specific PANSS by adverse-effect method, utility
attributable to long-acting risperidone treatment
increased at endpoint but by a smaller degree, 0.0285
units (95% confidence interval: 0.039–0.017). The SF-36
mapping function was significantly but not strongly cor-
related with the PANSS by adverse-effect mapping func-
tion (r = 0.20 Pearson correlation coefficient; Figure 3).
To compare the responsiveness of both measures, we esti-
mated the sample size that would be required for a rand-
omized clinical trial to have 80% power to detect the
changes in utility found in this observational study, at an
alpha of 0.05. The standard deviation of the clinical
Distribution of health states at baseline and at endpoint of the 1-year studyFigure 2
Distribution of health states at baseline and at endpoint of the 1-year study. Numbers of patients evaluated were
471 at baseline and 474 at endpoint. This figure illustrates both the floor effects of the measurement model as well as its
descriptive validity: the percentage of patients in health state 2 shifted to a higher level of health in state 1 at the study end-
point. *P < 0.001 vs baseline, McNemar's test.
0
10
20
30
40
50
Percent of Participants
Health States
1 2 3 4 5 6 7 8
Baseline Endpoint
25.1
41.6*
30.4
32.1
11
7
10.4
5.1
7.4
5.9
9.8
4.9
3.8
2.7
2.1
0.8
Health and Quality of Life Outcomes 2005, 3:57 />Page 6 of 8
(page number not for citation purposes)
mapping function was 0.127 at baseline and 0.125 at end-
point. The change in observed utility was 0.051, or about
0.4 standard deviations (a moderate effect, according to
Cohen [24]). This translates to a requirement for about
156 total subjects to achieve the specified power. The
change in utility seen with SF-36 function was smaller
(0.0285), and the standard deviation was slightly larger
(0.136 at baseline and 0.132 at endpoint). This translates
to an effect size of 0.211, or about half the effect size of
that seen with the clinical mapping function. A clinical
trial designed to detect the observed change with the SF-
36 mapping function would need 672 total subjects, or
about four times the number that would be required if the
study used the clinical mapping function. By way of com-
parison, change score for relevant PANSS items was 6.9
with a standard deviation 9.92. This translates to an effect
size of .70. Only 19 subjects would be required to detect a
positive change in the overall score.
Discussion
Generation of utility weights for cost-effectiveness analy-
sis is often a difficult task. This analysis applied a mapping
function for the PANSS, with preference weights from a
diverse sample of the US population, to a clinical
observational study. Results demonstrate both the feasi-
bility and the responsiveness of the function as a tool in
cost effectiveness analysis. Estimates of gains in utility
based on the disease-specific mapping function ranged
from 0.046 to 0.064, depending on the scaling method
and whether adverse effects of medication were included
in the model. The effect was greater than that calculated
using an SF-36-based mapping function, and the disease-
based measure had greater precision and power to detect
differences observed with treatment; however, its power
was still not close to the change score for the PANSS items
used in the mapping function.
These data confirm that utility calculations from disease
specific and generic instruments may not be directly com-
parable. The relatively low correlation (r = 0.2) is proba-
bly due to the instruments covering different content
areas. It could be argued that the optimal mapping system
might incorporate both health status effects and disease
effects in a utility model. To address the issue of avoidance
of double counting of gains, one would need to apply
methods to address the correlation that does exist
between symptoms and their effects on health related
quality of life. This might be done at the model formula-
tion level through use of principal components analysis
and cluster analysis to define states using both PANSS and
SF-36 data. Methods described by Sugar and co-authors
[25] might be suitable for this task.
Nonetheless, the estimates provided by the clinical func-
tion are better suited to use in a cost-effectiveness analysis
than the ones derived from the SF-36 mapping function in
this domain. The PANSS records an interviewer's percep-
tions of disease effects on the patient. The SF-36 is a self
administered instrument. If an individual lacks the insight
to appreciate health related quality of life impacts (lack of
insight into disease effects is common in schizophrenia),
Table 2: Utility Gains Adjusted for Adverse Effects
VAS SEM SG SEM
Baseline 0.519 0.00725 0.712 0.00578
12 weeks 0.570* 0.00676 0.751
†
0.00560
24 weeks 0.583* 0.00668 0.762
†
0.00542
36 weeks 0.594* 0.00658 0.768
†
0.00551
50 weeks 0.591* 0.00668 0.766
†
0.00554
Endpoint 0.583* 0.00647 0.763
†
0.00552
VAS indicates visual analog scale; SEM, standard error of the mean;
SG, standard gamble.
*P < 0.001 versus baseline visual-analog-scale measurement
(Wilcoxon signed rank test).
†
P < 0.001 versus baseline standard-gamble measurement (Wilcoxon
signed rank test).
Correlation between gains in utility, estimated using PANSS mapping function adjusted for averse effects (PMF+) and the SF-36 mapping functionFigure 3
Correlation between gains in utility, estimated using
PANSS mapping function adjusted for averse effects
(PMF+) and the SF-36 mapping function.
Summary of Fit
RSquare 0.043629
RSquare Adj 0.04147
Root Mean Square Error 0.112998
Mean of Response 0.028649
Observations (or Sum Wgts) 445
Parameter Estimates
Term Estimate Std Error t Ratio Prob>|t|
Intercept 0.0159226 0.006059 2.63 0.0089
Change in PMF+ 0.2312822 0.051448 4.50 <.0001
Health and Quality of Life Outcomes 2005, 3:57 />Page 7 of 8
(page number not for citation purposes)
then mapping functions based on self-report data might
lack construct validity.
In mental illness disease effects and health related quality
of life are highly convolved and it would be difficult to
separate health related quality of life from disease
experience. The clinical function was based on health state
descriptions that included impacts of the disease on
health related quality of life [17]. These descriptions were
designed to be sufficiently comprehensive of health
related quality of life to warrant direct usage in a cost-util-
ity analysis. If descriptions had been limited to disease
effects, further adjustments to utility estimates might be
necessary prior to use in a cost-effectiveness analysis [26].
A few studies provide comparisons of utility gains with
treatment in schizophrenia. Rosenheck and colleagues
constructed a mapping function for schizophrenia with a
quality-adjusted-life-year (QALY) like weight, based on
subjectively defined "best" and "worst" possible health
states [27]. They estimated that treatment of refractory
patients with clozapine increased the quality-of-life meas-
ure by 0.049 units during a 1-year study. Pyne and cow-
orkers estimated the utility gain with clinical
improvement using the QWB scale and Brazier's mapping
function for the SF-36 [28]. They found that "clinically
significant" improvement in schizophrenia was associ-
ated with a 0.048 gain in utility using the QWB scale, and
a 0.043 gain using the VAS-scaled version of Brazier's SF-
36 mapping function.
This study had several limitations. First, the data were
from an open-label study, which began with a 2-week oral
risperidone run-in period. Estimates of gain in utility
depended on the degree of symptom control that was
achieved during this oral-dosing period; if symptoms were
poorly controlled during this period, benefits of long-act-
ing risperidone treatment for this population of clinically
stable patients could have been overestimated. Second,
this analysis included only patients who completed the
trial. However, baseline demographics and disease charac-
teristics of patients who completed the trial versus those
who discontinued were not significantly different, with
the exception of mean patient age (Table 1). While these
design limitations limit the generalizability of findings of
utility gains for treatment with long-acting risperidone,
they do not impact assessments of the mapping function.
Another important limitation of the clinical mapping
function is the limited set of adverse effects of antipsy-
chotic treatment accounted for in this model. While not
all adverse effects were included in the mapping function,
the features included have been described as the key ben-
efits or liabilities of atypical agents versus conventional
antipsychotics [29,30]. Thus, the most important and rel-
evant medication side effects for contemporary pharmac-
oeconomic analyses have been included; however, the
model may need to be expanded as new drugs are
developed.
The mapping function applied in this study has technical
advantages and disadvantages. The health states are based
on a combination of clinical data and expert judgment.
We believe that this is an optimal mix because it is a data-
driven approach that compensates for under-representa-
tion of certain types of patients in clinical trials [16]. A sec-
ond advantage is the software program used to elicit
utilities. The software used multimedia video clips to
describe the health effects of schizophrenia and adverse
effects. This most likely improves the face validity of meas-
urements because the health effects of schizophrenia can
be difficult to comprehend to those without direct experi-
ence. A second advantage of the software program is its
use of advanced methods for error correction in utility
elicitations that have been proven to yield more accurate
population estimates of utility values [31]. However, the
computerized approach also brings limitations. Compu-
ter surveys are difficult to administer to "representative"
samples. To limit data collection costs for the model, data
were measured in members of an Internet survey panel
[19]. Although participants were a diverse group in terms
of geography, age, and ethnicity, the sample may not be
representative of the US population because they were all
Internet users (and members of a research panel) and
because of drop-out due to technical issues with survey
software.
Conclusion
In summary, this paper describes the application of a new
disease-specific utility mapping function, based on the
PANSS and adverse events, to estimate gains in utility in a
clinical study. This function is easy to apply and appears
to have greater precision than a SF-36-based mapping
function. One of the greatest advantages of the disease-
specific mapping function is that it uses data generally
available in clinical trials for schizophrenia (PANSS), and
thus it could have wide applicability.
Authors' contributions
LAL designed the study, developed the analysis plan, con-
tributed to statistical analyses, and drafted the manu-
script. MR participated in the design of the study,
contributed to the analysis plan, and helped draft the
manuscript. CE performed statistical analyses and helped
draft the manuscript. All authors have read and approved
the final manuscript.
Acknowledgements
This study was supported by Janssen Medical Affairs, L.L.C. The authors are
thankful for the clinical advice provided by Robert Lasser, MD, and critical
review of the study results by Julie Locklear, PharmD.
Publish with BioMed Central and every
scientist can read your work free of charge
"BioMed Central will be the most significant development for
disseminating the results of biomedical research in our lifetime."
Sir Paul Nurse, Cancer Research UK
Your research papers will be:
available free of charge to the entire biomedical community
peer reviewed and published immediately upon acceptance
cited in PubMed and archived on PubMed Central
yours — you keep the copyright
Submit your manuscript here:
/>BioMedcentral
Health and Quality of Life Outcomes 2005, 3:57 />Page 8 of 8
(page number not for citation purposes)
References
1. Furlong WJ, Feeny DH, Torrance GW, Barr RD: The Health Utili-
ties Index (HUI) system for assessing health-related quality
of life in clinical studies. Ann Med 2001, 33:375-384.
2. Torrance GW, Feeny DH, Furlong WJ, Barr RD, Zhang Y, Wang Q:
Multiattribute utility function for a comprehensive health
status classification system. Health Utilities Index Mark 2.
Med Care 1996, 34:702-722.
3. Kind P, Dolan P, Gudex C, Williams A: Variations in population
health status: results from a United Kingdom national ques-
tionnaire survey. BMJ 1998, 316:736-741.
4. Kaplan RM, Ganiats TG, Sieber WJ, Anderson JP: The Quality of
Well-Being Scale: critical similarities and differences with
SF-36. Int J Qual Health Care 1998, 10:509-520.
5. Ware J Jr, Kosinski M, Keller SD: A 12-Item Short-Form Health
Survey: construction of scales and preliminary tests of relia-
bility and validity. Med Care 1996, 34:220-233.
6. Ware JE Jr, Sherbourne CD: The MOS 36-item short-form
health survey (SF-36). I. Conceptual framework and item
selection. Med Care 1992, 30:473-483.
7. Fryback DG, Lawrence WF, Martin PA, Klein R, Klein BE: Predicting
Quality of Well-being scores from the SF-36: results from
the Beaver Dam Health Outcomes Study. Med Decis Making
1997, 17:1-9.
8. Nichol MB, Sengupta N, Globe DR: Evaluating quality-adjusted
life years: estimation of the health utility index (HUI2) from
the SF-36. Med Decis Making 2001, 21:105-112.
9. Sengupta N, Nichol MB, Wu J, Globe D: Mapping the SF-12 to the
HUI3 and VAS in a managed care population. Med Care 2004,
42:927-937.
10. Brazier JE, Roberts J: The estimation of a preference-based
measure of health from the SF-12. Med Care 2004, 42:851-859.
11. Brazier J, Roberts J, Deverill M: The estimation of a preference-
based measure of health from the SF-36. J Health Econ 2002,
21:271-292.
12. Lenert LA, Sherbourne CD, Sugar C, Wells KB: Estimation of util-
ities for the effects of depression from the SF-12. Med Care
2000, 38:763-770.
13. Siegel JE, Torrance GW, Russell LB, Luce BR, Weinstein MC, Gold
MR: Guidelines for pharmacoeconomic studies. Recommen-
dations from the panel on cost effectiveness in health and
medicine. Panel on cost Effectiveness in Health and
Medicine. Pharmacoeconomics 1997, 11:159-168.
14. Donald Sherbourne C, Unutzer J, Schoenbaum M, Duan N, Lenert
LA, Sturm R, Wells KB: Can utility-weighted health-related
quality-of-life estimates capture health effects of quality
improvement for depression? Med Care 2001, 39:1246-1259.
15. Kay SR, Opler LA, Lindenmayer JP: The Positive and Negative
Syndrome Scale (PANSS): rationale and standardisation. Br
J Psychiatry 1989:59-67.
16. Mohr PE, Cheng CM, Claxton K, Conley RR, Feldman JJ, Hargreaves
WA, Lehman AF, Lenert LA, Mahmoud R, Marder SR, Neumann PJ:
The heterogeneity of schizophrenia in disease states. Schizo-
phr Res 2004, 71:83-95.
17. Lenert LA, Sturley AP, Rapaport MH, Chavez S, Mohr PE, Rupnow M:
Public preferences for health states with schizophrenia and
a mapping function to estimate utilities from positive and
negative symptom scale scores. Schizophr Res 2004, 71:155-165.
18. Mahmoud RA, Engelhart LM, Janagap CC, Oster G, Ollendorf D: Ris-
peridone versus conventional antipsychotics for schizophre-
nia and schizoaffective disorder: symptoms, quality of life
and resource use under customary clinical care. Clin Drug
Invest 2004, 24:275-286.
19. Lenert LA, Sturley AE: Use of the Internet to study the utility
values of the public. In Proceedings of the 2002 AMIA Annual Sympo-
sium: 9–13 November 2002; San Antonio Edited by: Kohane IS.
Bethesda: AMIA; 2002:440-444.
20. Fleischhacker WW, Eerdekens M, Karcher K, Remington G, Llorca
PM, Chrzanowski W, Martin S, Gefvert O: Treatment of schizo-
phrenia with long-acting injectable risperidone: a 12-month
open-label trial of the first long-acting second-generation
antipsychotic. J Clin Psychiatry 2003, 64:1250-1257.
21. Lasser R, Bossie CA, Gharabawi G, Eerdekens M, Nasrallah HA: Effi-
cacy and safety of long-acting risperidone in stable patients
with schizoaffective disorder. J Affect Disord 2004, 83:263-275.
22. American Psychiatric Association: Diagnostic and Statistical Manual of
Mental Disorders 4th edition. Washington, DC: American Psychiatric
Association; 1994.
23. Chouinard G, Ross-Chouinard A, Annable L, Jones BD: Extrapy-
ramidal symptom rating scale. Can J Neurolog Sci 1980, 7:233.
24. Cohen J: Statistical Power Analysis for the Behavioral Sciences 2nd edition.
Hillsdale, New Jersey: Lawrence Erlbaum Associates; 1988.
25. Sugar CA, James GM, Lenert LA, Rosenheck RA: Discrete state
analysis for interpretation of data from clinical trials. Med
Care 2004, 42:183-196.
26. Stolk EA, Busschbach JJ: Validity and feasibility of the use of con-
dition-specific outcome measures in economic evaluation.
Qual Life Res 2003, 12:363-371.
27. Rosenheck R, Cramer J, Xu W, Grabowski J, Douyon R, Thomas J,
Henderson W, Charney D: Multiple outcome assessment in a
study of the cost-effectiveness of clozapine in the treatment
of refractory schizophrenia. Department of Veterans Affairs
Cooperative Study Group on Clozapine in Refractory
Schizophrenia. Health Serv Res 1998, 33:1237-1261.
28. Pyne JM, Sullivan G, Kaplan R, Williams DK: Comparing the sensi-
tivity of generic effectiveness measures with symptom
improvement in persons with schizophrenia. Med Care 2003,
41:208-217.
29. Rosenheck R, Cramer J, Xu W, Thomas J, Henderson W, Frisman L,
Fye C, Charney D: A comparison of clozapine and haloperidol
in hospitalized patients with refractory schizophrenia.
Department of Veterans Affairs Cooperative Study Group
on Clozapine in Refractory Schizophrenia. N Engl J Med 1997,
337:809-815.
30. Rosenheck R, Perlick D, Bingham S, Liu-Mares W, Collins J, Warren
S, Leslie D, Allan E, Campbell EC, Caroff S, Corwin J, Davis L, Douyon
R, Dunn L, Evans D, Frecska E, Grabowski J, Graeber D, Herz L,
Kwon K, Lawson W, Mena F, Sheikh J, Smelson D, Smith-Gamble V,
Department of Veterans Affairs Cooperative Study Group on the
Cost-Effectiveness of Olanzapine: Effectiveness and cost of olan-
zapine and haloperidol in the treatment of schizophrenia: a
randomized controlled trial. JAMA 2003, 290:2693-2702.
31. Lenert LA, Sturley A, Rupnow M: Toward improved methods for
measurement of utility: automated repair of errors in
elicitations. Med Decis Making 2003, 23:67-75.