Superconductor Part 12 docx
Bạn đang xem bản rút gọn của tài liệu. Xem và tải ngay bản đầy đủ của tài liệu tại đây (2.34 MB, 25 trang )
Superconductor
266
From photographs in Fig. 2(1), many crazes were observed on the surface of the dry green
sheet (see in Fig. 2(1)(b)). After firing(see in Fig. 2(1)(c)), many large cracks were observed
on the surface and near peripheral region.
On the other hand, in Fig. 2(2), no crazes and no cracks were seen with the naked eye for the
dry green sheet(see in Fig. 2(2)(b)) and the sintered sample(see in Fig. 2(2)(c)).
These results indicate that crack generation can be considerably reduced by adding a small
amount of PVA to the slurry.
2.3 The effect of PVA on the product
Figure 3 shows the X-ray diffraction patterns of samples prepared from the slurry with (a) 0
wt% and (b) 1 wt% PVA. In these X-ray diffraction patterns, 18 diffraction peaks are
observed at 2θ= 22.81, 27.71, 27.91, 30.61, 32.51, 32.81, 38.51, 40.31, 46.51, 47.51, 51.41, 52.51,
54.91, 58.21, 58.71, 62.71, 68.11 and 68.71, corresponding to the (030), (120), (021), (040), (130),
(031), (050), (131), (200), (002), (151), (160), (070), (161), (132), (241), (260), and (081) planes of
orthorhombic YBa
2
Cu
3
O
7-x
, respectively[10]. These results indicate that adding a small
amount of PVA to the slurry has no marked influence on the final product in X-ray
resolution.
Fig. 3. X-ray diffraction patterns of the sheet samples prepared from the slurry with various
PVA concentrations: (a) 0 and (b) 1 wt%.
2.4 Effect of adding PVA on the superconducting properties
Figure 4 shows the temperature dependence of electrical resistance for the samples prepared
from the slurry with (a) 0 wt% and (b) 1 wt% PVA concentration. It can be seen that, for both
samples, the electrical resistance first decreases linearly with temperature and then begins to
decline sharply near 92 K and reaches zero near 89 K. In both samples, the T
con
(onset
Development of Large Scale YBa
2
Cu
3
O
7-x
Superconductor with Plastic Forming
267
transition temperature) was about 92 K and T
coff
(offset transition temperature)(T
c
) at which
the electric resistance becomes zero was about 89 K. There is no visible effect of PVA
addition on T
c
. The distribution of T
c
values in the large samples prepared from the slurry
with (a) 0 wt% and (b) 1 wt% PVA concentration shows in Fig. 5 (a) and (b), respectively.
These results indicated that the whole of both samples would be superconductors under 85
K. Average T
c
of samples prepared from the slurry with (a) 0 wt% and (b) 1 wt% PVA was
87.6±2 K and 88.6±2 K, respectively.
Fig. 4. Dependence of resistivity on temperature. The samples were prepared from the
slurry with various PVA concentrations: (a) 0 and (b) 1 wt%.
The difference of average T
c
for both samples was small within 1 K. The average T
c
did not
depend on the PVA concentration, which was in the range between 0 and 5 wt%, and the
average T
c
of all samples was 88.3±3 K.
89.5 K 86.2 K 86.3 K
88.3 K 88.5 K
88.3 K
85.4 K 88.5 K
(a)
88.4 K 89.4 K 87.5 K 88.4 K
88.0 K 89.5 K
87.0 K 87.5 K 89.5 K
89.0 K 90.0 K
(b)
Fig. 5. The distribution of Tc values in the samples prepared from the slurry with (a) 0 wt%
and (b) 1 wt% PVA concentration.
Figure 6 shows the dependence of current density on the magnetic flux density measured at
77K for the samples prepared from the slurry with the PVA concentrations of (a) 0 wt% and
Superconductor
268
(b) 1 wt%. The samples used were the same as those in Fig. 4. The current density of the
sample prepared from the slurry with 1 wt% PVA is larger than that of the sample without
PVA for the magnetic field range between -1.0 and +1.0 T. It can be seen that with the
addition of PVA, the critical current density (Jc) increased from 370 to 713 A/cm
2
. This Jc of
713 A/cm
2
was about 35% of the reported Jc (about 2000 A/cm
2
) of theYBa
2
Cu
3
O
7-x
polycrystalline sample produced by the Bridgman method. The distributions of Jc values,
which were observed at 77 K at 0.018T, on the large samples used in Fig. 6(a)0% and (b)1%
are shown in Fig. 7(a) and (b), respectively. From Fig. 7(a), Jc values of the sample prepared
without PVA were distributed in the range from 253 to 443 A/cm
2
, and that the average Jc
of this sample was 340±70 A/cm
2
(except maximum and minimum Jc). From Fig. 7(b), Jc
values of the sample prepared from the slurry containing 1% PVA were distributed in the
range from 587 to 890 A/cm
2
, and that the average Jc of this sample was 755±135 A/cm
2
(except maximum and minimum Jc).
Fig. 6. Dependence of current density on magnetic flux density. The samples were prepared
from the slurry with various PVA concentrations: (a) 0 and (b) 1 wt%. Measurement was
performed at 77 K.
Comparing with Fig. 7(a) and (b), it is found that the average Jc value of the sample
prepared from the slurry containing 1 wt% PVA was about two times larger than that of the
sample without PVA. This fact can be explained by the difference of the density. The
average density of the sample without PVA and with 1 wt% PVA was 4.6±0.3 g/cm
3
and
5.4±0.4 g/cm
3
, respectively. Since our samples consist of polycrystalline samples, the
number of the superconducting path in the sample increases with increase in the density of
the sample so that Jc value of the sample prepared with 1 wt% PVA became larger than that
of the sample without PVA. In our studies, over 1 wt% PVA, Jc values decreased with
increases in PVA concentration. The reason for this decrease of Jc was thought that when the
amount of PVA included in the sample increased, after firing, the amount of the residual
carbon and related impurities, which exist along the grain boundary, increased so that the
decrease of Jc was observed. In our studies, the optimum PVA concentration was 1 wt%.
Development of Large Scale YBa
2
Cu
3
O
7-x
Superconductor with Plastic Forming
269
Figure 8 is the photograph that Meissner effect is observed by the sample used in Fig. 7(b).
In this picture, sample was cooled at 77 K with liquid nitrogen. This figure indicates that our
sample made by the plastic forming method was a superconducting material.
270
370 334
366 443 357
345 253
(a)
730 740 880
887 713 751
890 670 790
630 587
(b)
Fig. 7. The distribution of Jc values in the samples prepared from the slurry with (a) 0 wt%
and (b) 1 wt% PVA concentration. Jc measurement was done at 0.018 T.
Fig. 8. The photograph of Meisser effect of the sample used in Fig. 7(b)
3. Improvement of the superconducting properties
The maximum average Jc observed in this study was about 755 A/cm
2
, which is much
smaller than the reported maximum Jc of the bulk YBa
2
Cu
3
O
7-x
sample (>10
4
A/cm
2
). The
main reasons why Jc is much smaller than the reported value are as follows:
1. The density of samples prepared from the slurry containing 1 wt% PVA (5.4±0.4 g/cm
3
)
is about 86 % of the theoretical density (d=6.36 g/cm
3
).
Superconductor
270
2. The sample is a polycrystal in which the degree of orientation to the c-axis is low.
3. Non-superconducting materials exist among grain boundaries.
4. The degree of oxygen deficiency is large.
5. The degree of crystallinity of used YBa
2
Cu
3
O
7-x
powder/particle was of no high quality.
We tried to improve the superconducting properties of our samples.
(1) Oxygen annealing
It has been well known that the oxygen defect strongly affects the crystal structure and the
superconducting properties of HTS. Therefore, we tried to improve the superconducting
properties of samples by the oxygen annealing.
Figure 9 shows the dependence of current density on magnetic flux density of (a) non-heat-
treated sample and (b) heat treated sample[11]. Heat treatment was done at 773 K, 10 h,
under oxygen gas flow condition. It is found that by the heat treatment in an oxygen
atmosphere, the current density increased about three or four times more than that of non-
heat-treated sample and especially Jc value at 0.018 T was about 1500 A/cm
2
and this value
was about 70% of the reported value for under doped YBa
2
Cu
3
O
7-x
prepared with Bridgman
method[12]. And this fact implies that the superconducting properties can be improved by
the heat treatment in the oxygen atmosphere.
Fig. 9. The dependence of current density on magnetic flux density of (a) non-heat-treated
sample and (b) heat treated sample. Heat treatment was done at 773 K, 10 h, under oxygen
gas atmosphere.
(2) Changing of YBa
2
Cu
3
O
7-x
powder/particles
In general, the degree of crystallinity of the YBa
2
Cu
3
O
7-x
powder/particles prepared with
conventional sintering method was of poorer quality than that prepared with other methods
such as MPMG method, Bridgman method, etc, so that near 0 T, superconducting properties
of YBa
2
Cu
3
O
7-x
samples made by conventional sintering method became of less quality
inhomogeneos than those prepared with other methods. Changing of YBa
2
Cu
3
O
7-x
powder/particles prepared with conventional sintering method to YBa
2
Cu
3
O
7-x
powder/
particles prepared with MPMG method, we tried to improve superconducting properties.
Figure 10 shows the dependence of current density on magnetic flux density of (a) the
sample prepared with YBa
2
Cu
3
O
7-x
powder/particles made by convenience sintering
Development of Large Scale YBa
2
Cu
3
O
7-x
Superconductor with Plastic Forming
271
method and (b) the sample prepared with powder/particles made by MPMG method [2]. Jc
value and Tc of YBa
2
Cu
3
O
7-x
powder/particles made by convenience sintering method was
about 700 A/cm
2
and 89 K, respectively. On the other hand, Jc value and Tc of YBa
2
Cu
3
O
7-x
powder/particles made by MPMG method was about 2000 A/cm
2
and 89 K, respectively.
From results in Fig. 9, Jc values of samples prepared with YBa
2
Cu
3
O
7-x
powder/particles
made by (a) convenience sintering method and (b) MPMG method were about 900 and
about 2900 A/cm
2
, respectively. It is also found that Jc value of the sample prepared with
powder/particles made by MPMG method is about three times larger than that of the
sample prepared with powder/particles made by convenience sintering method. And it is
found that using powder/particles made by MPMG method, the superconducting
properties near 0 T were improved. This fact indicates that if the YBa
2
Cu
3
O
7-x
powder/particle, which has larger Jc value, will be used, the Jc value of the sample made by
plastic forming will be larger than those of our reported samples.
Fig. 10. The dependence of current density on magnetic flux density. Sample (a) was
prepared with YBa
2
Cu
3
O7
-x
powder made by conventional sintering method. Sample (b)
was prepared with YBa
2
Cu
3
O7
-x
powder made by MPMQ method.
4. Conclusion
In this work, we have described that large YBa
2
Cu
3
O
7-x
superconductor samples can be
easily prepared with the plastic forming which is the preparation method for large scale
ceramics samples with simple, easy and reproductive processes. Used slurry was prepared
by mixing YBa
2
Cu
3
O
7-x
particles which were prepared with the sintering method, the
inorganic binder and polyvinyl alcohol (PVA). In this method, fine YBa
2
Cu
3
(OH)
x
colloid
particles ( average particle diameter : 380±70 nm) prepared with the sol-gel method was
used as inorganic binder and polyvinyl alcohol (PVA) was used as protective colloid and
also acted as flocculant (aggregation agent). Adding a small amount of PVA into the slurry,
the clack generation was reduced and so that large scale bulk YBa
2
Cu
3
O
7-x
superconductor
(about 100 mm x 100 mm x 2 mm) could be produced. The sample became superconducting
at 88.3±3 K and had the average Jc of 755±135 A/cm
2
.
To improve superconducting properties, we changed the YBa
2
Cu
3
O
7-x
powder/particles
prepared with conventional sintering method to YBa
2
Cu
3
O
7-x
powder/particles prepared
with MPMG method. So that the samples became superconducting at 91.5±0.5 K and had
average critical current density 2900±200 A/cm
2
(at 77 K under H=0.018 T). This result
indicates that superconducting properties, especially Jc value, of samples made with plastic
Superconductor
272
forming are determined by those of used YBa
2
Cu
3
O
7-x
powder/particles. Therefore,
superconducting properties of sample prepared with plastic forming will be improved by
both optimizations of YBa
2
Cu
3
O
7-x
powder/particles and YBa
2
Cu
3
(OH)
x
colloid particles.
5. Acknowledgments
We would like to thank Dr. Hirosi Terada and Dr. Shoji Sato for their valuable discussions
and suggestions. We are grateful to Asami Murai, Kengo Sawada, Hiroyuki Ishikawa,
Tatsunosuke Omi for their assistance with the sample production and characterization.
6. References
[1] R. J. Cava, B. Batlogg, R. B. van Dover, D. W. Murphy, S. Sunshine, T. Siegrist, J. P.
Remeika, E. A. Reitman, S. Zahurak, and G. P. Espinosa, ‘‘Bulk Superconductivity
at 91 K in Single-Phase Oxygen-Deficient Perovskite Ba2YCu3O9-δ’’, Phys. Rev.
Lett., 58, pp.1676–9 (1987).
[2] M. Murakami, T. Oyama, H. Fujimoto, T. Taguchi, S. Gotoh, Y. Shiohara, N. Koshizuka,
and S. Tanaka, ‘‘Large Levitation Force due to Flux Pining in YBaCuO
Superconductors Fabricated by Melt-Powder–Melt–Growth Process”, Jpn. J. Appl.
Phys., 29, L1991–4 (1990).
[3] M. Murakami, M. Morita, and N. Koyama, ‘‘Magnetization of a YBa2Cu3O7 Crystal
Prepared by the Quench and Melt Growth Process’’, Jpn. J. Appl. Phys., 28, L1125–7
(1989).
[4] A. A. Hussain and M. Sayer, ‘‘Fabrication, Characterization and Theoretical Analysis of
High-Tc Y–Ba–Cu–O Superconducting Films Prepared by a Chemical Sol–Gel
Method’’, J. Appl. Phys., 70, pp.1580–90 (1991).
[5] S. Yamamoto, A. Kawaguchi, S. Oda, K. Nakagawa, and T. Hattori, ‘‘Atomic Layer-by-
Layer Epitaxy of Oxide Superconductors by MOCVD’’, Appl. Surf. Sci., 112, pp.30–
7 (1997).
[6] C. Belouet, ‘‘Thin Film Growth by Pulsed Laser Assisted Deposition Technique’’, Appl.
Surf. Sci., 96/98, pp.630–42 (1996).
[7] K. Maiwa, K. Honda, K. Kamihira, K. Goto, and T. Fujii, ‘‘Effects of Impurity Contents of
the Starting Materials of YBa2Cu3Ox on Superconducting Characteristics’’, J. Jpn.
Soc. Powder Powder Metall, 41, pp.436–40 (1993).
[8] M. Takahashi, T. Miyauchi, K. Sawada, H. Ishikawa, S. Sato, M. Tahashi, K. Wakita, S.
Okido, M. Honda, A. Murai, M. Kamiya, and M. Matubara, “Preparation and
Characterization of a Large-Scale YBa
2
Cu
3
O
7-x
Superconductor Prepared by Plastic
Forming without a High-Pressure Molding: Effect of Polyvinyl Alcohol (PVA)
Addition on Superconducting Properties”, J Am. Ceram. Soc., 92, pp.578-584(2009)
[9] M. Senda and O. Ishii, ‘‘Critical Current Density of Screen Printed YBa2Cu3O7_x
Sintered Thick Film’,’ J. Appl. Phys., 69, pp.6586–9 (1991).
[10] JCPDS Card No. 38-1433
[11] M. Takahashi, Y. Tomioka, T. Miyauchi, S. Sato, A. Murai, T. Ido, K. Wakita, H. Terada,
S. Ohkido, and M. Matsubara, ‘‘Characterization of a Large-Scale Nondoped
YBa2Cu3O7_x Superconductor Prepared by Plastic Forming without High-Pressure
Molding’’, J. Am. Ceram. Soc., 90, pp.2032–7 (2007).
[12] E. Mendoza, T. Puig, X. Granados, X. Obrados, L. Porcar, D. Bourgault, and P. Tixador,
‘‘Extremely High Current-Limitation Capability of Underdoped YBa2Cu3O7_x
Superconductor’’, Appl. Phys. Lett., 83, pp.4809–11 (2003).
14
Some Chaotic Points in
Cuprate Superconductors
Özden Aslan Çataltepe
Anatürkler Educational Consultancy and Trading Company
Bağdat Cad. No: 258 3/6 Göztepe, İstanbul
Turkey
1. Introduction
The aim of this chapter is to determine the chaotic points of cuprate layered superconductors
by means of magnetization data and the concept of the Josephson penetration depth based on
Bean Critical State and Lawrance-Doniach Models, respectively. In this chapter, the high
temperature mercury based cuprate superconductors have been examined by magnetic
susceptibility (magnetization) versus temperature data, X-Ray Diffraction (XRD) patterns and
Scanning Electron Microscope (SEM) outputs. Thus by using these data, a new method has
been developed to calculate the Josephson penetration depth precisely, which has a key role in
calculating various electrodynamics parameters of the superconducting system. The related
magnetization versus temperature data have been obtained for the optimally oxygen doped
virgin (uncut) and cut samples with the rectangular shape. By means of the magnetization
versus temperature data of the superconducting sample, taken by Superconducting Quantum
Interference Device (SQUID), the Meissner critical transition temperature, T
c
, and the
paramagnetic Meissner temperature T
PME
, called as the critical quantum chaos points, have
been extracted. In superconductors, the second order phase transition occurs at Meissner
transition temperature, T
c
, that is considered as the first chaotic point in the system, since the
normal state of being is transformed into another state of being called as “superconducting
state” that has been driven by temperature. The XRD measurements have been performed in
order to calculate the lattice parameters of the system. The crystallographic lattice parameters
of superconducting samples, determined by the XRD patterns, have been used to estimate the
extent of the Josephson penetration depth. The SEM outputs have been used to determine the
grain size of the optimally oxygen doped polycrystalline superconducting samples. The
average grain size of the HgBa
2
Ca
2
Cu
3
O
8+x
(Hg-1223) samples, t, is a crucial parameter, since
the critical current density value, J
c
, is inversely proportional to “t”, whereas it is directly
proportional to the difference in magnetization. It has been concluded that the grain size of
the superconductors and the length of the c-axis of the unit cell of the system are highly
effective on both of the first and second chaotic points of the superconducting system.
2. The mercury based copper oxide layered superconductors
It is well known that, the superconducting materials have a phase transition from normal
state to superconducting state at the Meissner transition temperature, T
c
. The most common
Superconductor
274
property of the superconductivity is the diamagnetic response to the applied magnetic field. In
addition to diamagnetic response, some superconductors exhibit a simultaneous paramagnetic
behaviour under a weak applied magnetic field (Braunish et al., 1992; Braunish et al., 1993;
Onbaşlı et al., 1996; Nielsen et al., 2000). This paramagnetic behavior is called as Paramagnetic
Meissner Effect (PME) and it can be observed within a specific temperature interval with the
maximum paramagnetic signal at the paramagnetic Meissner temperature, T
PME
. At this
temperature, the direction of the orbital current changes its direction in the momentum
space. Since both temperatures represent the transition from one state of being to another, T
c
and T
PME
are considered as the critical quantum chaos points of the superconducting
specimens (Aslan et al., 2009; Onbaşlı et al., 2009). The superconducting system is considered
as the best material media displaying the chaotic behavior (Waintal et al., 1999; Bogomolny et
al., 1999; Evangelou, 2001). The determination of the critical chaotic points is very important in
order to decide about the operating temperatures for the high sensitive advanced
technological applications. In this context, the determination of the critical chaotic points of T
c
and T
PME
on both a.c. (alternative current) and d.c. (direct current) magnetic susceptibility
versus temperature data of the mercury based superconductors have been realized (Onbaşlı et
al., 1996; Aslan et al., 2009; Onbaşlı et al., 2009).
The mercury based copper oxide layered superconductor investigated , which is one of the
high temperature superconductors, has the highest critical parameters such as Meissner
transition temperature, T
c
, the critical current density, J
c
, etc. (Onbaşlı et al., 1996; Aslan et
al., 2009). Due to the highest critical parameters of the bulk superconducting Hg-1223
samples, the determination of some electrodynamics parameters such as Josephson
penetration depth, plasma frequency and the anisotropy factor has also a great importance
for both theoretical and various advanced technological applications. To calculate these
electrodynamics parameters, the average spacing of copper oxide bilayers, s, and the grain
size of the superconductor are required to be measured. The average spacing of copper
oxide bilayers, s, is seen in the primitive cell of the mercury cuprate superconductors given
in Fig. 1.
Fig. 1. The primitive cell of Hg-1223 superconductor at the normal atmospheric pressure
(Aslan, 2007).
The primitive cell of the mercury cuprates contains three superconducting copper oxide
planes separated by insulating layers and this structure is considered as an intrinsic
Josephson junction array (Fig. 1).
Some Chaotic Points in Cuprate Superconductors
275
As is known, the superconductivity occurs in the copper oxide planes which form intrinsic
structural layers. The origin of the superconductivity is based on the harmony which is
extended to all copper oxide layers along the c-axis via electromagnetic coupling at the
Josephson plasma frequency, ω
p
(Lawrance & Doniach, 1971). However, the Josephson
penetration depth,
λ
j
, being the most important electrodynamics parameters, is given in Eq. (1)
2
o
j
co
c
Js
λ
π
μ
Φ
= (1)
where
Φ
o
=2.0678×10
-15
(T.m
2
) represents the flux quantum, c is the velocity of light,
(
)
2
7
410
N
o
A
μπ
−
=× is the permeability of free space, J
c
is the critical current density and s is
the average spacing of copper oxide bilayers. According to the scientific literature, the
Josephson penetration depth,
λ
j
, is considered as a measure of the magnetic penetration
depth of the field induced by super current (Gough, 1998; Ketterson & Song, 1999; Tinkham,
2004; Fossheim & Sudbo, 2004). It has been previously determined that the Josephson
penetration depth,
λ
j
increases with temperature for the mercury cuprate superconducting
family (Özdemir et al., 2006; Güven Özdemir et al, 2007).
In the next section, both the required lengths and quantum chaotic points mentioned above
for the bulk superconducting Hg-1223 samples will be examined by means of XRD patterns,
SEM outputs and magnetic moment versus temperature data.
3. Determination of the chaotic points
3.1 The analysis of temperature dependence of magnetization
The concept of chaos can be defined as the transition from one state of being to another state
of being where the probability density of the system, which is sensitive to the initial
conditions, changes via temperature (Gleick, 1987; Panagopoulos & Xiang, 1998). In this
point of view, the superconducting system is one of the best examples to understand the
unexpected chaotic transitions via magnetic measurements. Superconducting systems,
which exhibit the second order phase transition, possess some critical chaotic points as
defined above. According to many researchers, the phenomenon of the critical quantum
chaos have been observed in the quasi periodic systems, the systems with two interacting
electrons and the fractal matrices (Evangelou & Pichard, 2000; Evangelou, 2001).
Furthermore, the superconductors investigated, in which phonon mediated attractive
electron-electron interaction leads to form quasi-particles, namely Cooper pairs (Aoki et al,
1996; Egami et al., 2002; Tsudo & Shimada, 2003), constitute a natural laboratory for
searching and observing quantum critical chaotic points (Onbaşlı et al., 2009).
In this section, the optimally oxygen doped superconducting samples have been
investigated by referring to T
c
and T
PME
temperatures extracted from the magnetic
susceptibility versus temperature data taken by Quantum Design SQUID susceptometer
model MPMS-5S. In all of the magnetization measurements, the magnetic field has been
applied to the superconducting bulk specimen along the c-axis.
The optimally doped virgin (uncut) samples have been obtained by pressing under 1 ton of
weight. Hg-1223 samples, which have been kept in air for several months after being
synthesized, were still mechanically very hard, dense and stiff (Onbaşlı et al., 1996; Onbaşlı
et al., 1998; Güven Özdemir et al., 2009). Afterwards, the virgin samples have been cut by
Superconductor
276
diamond saw in the rectangular shape of 4x2x1 mm. Hence the magnetic susceptibility of
the Hg based cuprate superconducting samples has been investigated under both a.c. and
d.c. magnetic fields (Onbaşlı et al., 1996; Onbaşlı, 2000).
The related a.c. data for the optimally doped virgin (uncut) and cut samples, which belong
to the same virgin batch, are given in Fig. 2. Both data have been taken under a.c. magnetic
field of 1 Gauss with 1 kHz frequency.
As seen in Fig. 2, the paramagnetic Meissner and the critical Meissner chaotic temperatures
of the uncut samples have been determined as 126K and 137K, respectively. However, for
the cut samples with rectangular shape, T
PME
and T
c
have been found as 122K and 140K,
respectively. As is known that the paramagnetic Meissner effect can also be observed on
very cleanly prepared polycrystalline samples under d.c. magnetic fields. Magnetic moment
versus temperature curve for the uncut sample has been taken under zero and 1 Gauss of
d.c. magnetic field. The paramagnetic Meissner effect has been observed under d.c. field
cooled data of the uncut (virgin) specimen (Fig. 3).
Fig. 2. Magnetic moment versus temperature curves of the virgin (uncut) Hg-1223 and cut
samples under a.c. magnetic field of 1 Gauss. The inset shows the real part of the magnetic
moment and indicates the Meissner critical temperatures for both of the virgin and cut
specimens.
3.2 The symmetries and symmetry breakings in Hg-1223 superconductors
The concepts of the symmetries and symmetry breakings are accepted as one of the most
unsolved problems of the 21st century. The symmetries have a crucial role in giving
information about the present forces in a system considered and that symmetries can be
broken in various ways such as variation of density, temperature, etc. (Nambu & Pascual,
1963; Smolin, 2006).
Some Chaotic Points in Cuprate Superconductors
277
The concept of symmetry breakings has been discussed by the phenomenon of the critical
quantum chaos in the mercury cuprates by means of the magnetic susceptibility versus
temperature graphics.
Fig. 3. Magnetic moment versus temperature curves of the optimally doped uncut (virgin)
Hg-1223 superconductors under zero and 1 Gauss d.c. magnetic field cooled. The inset
shows that only the field cooled specimen displays PME.
The global gauge symmetry is broken at Meissner transition temperature, T
c
, in high
temperature superconductors (Zhang, 2001; Li, 2003; Roman, 2004; Onbaşlı et al., 2009).
Accompanying the global gauge symmetry breaking, the symmetry of the order parameter
undergoes a transition from s-wave to d-wave at T
c
, as well. Furthermore, due to the fact
that the system exhibits spatial Bose-Einstein condensation (Güven Özdemir et al., 2007), the
superconducting system can be considered to display f-wave symmetry, as well. The
schematic representations of the s-wave, d-wave and f-wave symmetries are given in Fig. 4.
Moreover, Weinberg states that “A superconductor is simply a material in which
electromagnetic gauge invariance is spontaneously broken.” With this statement, Weinberg
means that the electromagnetic gauge field acquires a mass due to the Higgs mechanism in a
superconductor. In other words, the particle physicists often speak of gauge invariance
interchangeably with the Higgs mechanism (Weinberg, 1996; Greiter, 2005).
In addition to this symmetry breaking at T
c
, the time reversal symmetry breaking
phenomenon becomes observable on paramagnetic Meissner effect at T
PME
in mercury
cuprates. In the unconventional (high temperature) superconductors, the breaking of the
Superconductor
278
time reversal symmetry is related to the orbital magnetism. The origin of the PME has been
estimated by the reversion mechanism of the direction of the orbital current (Li, 2003;
Onbaşlı et al., 2009). According to Sigrist et al., the time reversal symmetry can be destroyed
by application of magnetic field and that addition of magnetic impurities (Sigrist et al.,
2006). In scientific literature, it has been predicted that the time reversal symmetry breaking
occurs below Meissner transition temperature, T
c
in superconductors (Horovitz & Golub,
2002).
Fig. 4. The schematic representation of s-wave, d-wave and f-wave.
The PME phenomenon has been suggested as a reliable method for determining broken
time reversal symmetric state in superconductors instead of very complicated experimental
methods such as the angle resolved photoelectron spectroscopy (ARPES) (Onbaşlı et al.,
2009). Using ARPES for detecting time reversal symmetry breaking phenomenon may bring
the possibility of having the order parameter to be collapsed. So that the magnetic method
introduced in this chapter will be a reliable tool to detect the symmetry breaking points of
the high T
c
superconductors (Onbaşlı et al, 2009).
In recent years, it has been suggested that the copper oxide layered superconductors are
considered as a perfect prototype for the electroweak theory and electroweak symmetry
breaking due to Higgs mechanism in superconductors (Quigg, 2008). The Higgs mechanism
in layered superconductors has been explained by Josephson plasma excitations. In weakly
Josephson coupled layered superconductors, the main Josephson plasma excitation modes
consist of the longitudinal and transversal modes. The transversal Josephson plasma
excitation is an electromagnetic wave, propagating perpendicular to the polarization vector
(a-Tachiki et al., 1996; b-Tachiki et al., 1996). On the other hand, the longitudinal mode
known as Nambu–Goldstone (Anderson–Bogalibov) mode is an elementary excitation mode
accompanying with the superconducting phase transition due to the symmetry breaking
(Anderson, 1958; Rickazyen, 1958; Nambu, 1960). However, the zero energy gap at k = 0,
does not obey to the Goldstone theorem. Therefore, an additional mechanism, which is
known as Higgs mechanism, has been suggested to obtain the finite energy gap. In this
point of view, the longitudinal plasma waves should be massive since Higgs bosons have
finite mass (Kadowaki et al., 1998). As is known that, all the electroweak force particles are
massless in the electroweak symmetry. On the other hand, the breaking of the electroweak
symmetry gives mass to the electroweak force particles W
±
and Z
0
(namely weak gauge
bosons) leaving the photon massless (Quigg, 2006). According to Veltman, if the space is
filled with a type of superconductor, it gives mass to W
±
and Z
0
bosons (Goldstone bosons).
This superconductor can be considered as consisting of Higgs bosons (Veltman, 1986). It has
been proposed that Higgs boson has zero spin and zero angular momentum. It has been
predicted that, the time reversal symmetry breaking at PME temperature, in which the
angular momentum is zero, can be considered as the emerging of Higgs boson in the
superconducting state (Onbaşlı et al., 2009).
Some Chaotic Points in Cuprate Superconductors
279
Anderson discovered the physical principle underlying the formation of mass mechanism in
the context of superconductivity. The boson, which appears as a result of the Goldstone
theorem, has zero unrenormalized mass, which is converted into a finite mass plasmon by
interaction with electromagnetic gauge field (Anderson, 1963). The effective mass of the
quasi particles, (m
*
), introduced in the following chapter, corresponds to the three
dimensional (spatial) net effective mass, which is neither attributed to Goldstone boson nor
plasmon. In the following chapter, the third quantum chaotic point will be introduced. The
third quantum chaotic point called as, quantum gravity point, T
QG
, where the net effective
mass of the quasi-particles (m
*
) in the superconducting system has the maximum value,
corresponds to the quantum gravity peak for the optimally oxygen doped mercury cuprate
superconductors, at which the plasma frequency shifts from microwave to infrared region at
the T
QG
temperature (Aslan Çataltepe et al., 2010).
3.3 Relevant distribution functions of the mercury based superconductors
At T
c
, the distribution functions of the system differs from one to another while the
transition from normal state to superconducting state occurs. Hence, the system includes
both Fermi Dirac (F-D) and Bose-Einstein (B-E) distribution functions depending on the
normal state and superconducting state, respectively. As the temperature is higher than the
Meissner transition temperature, T
c
, the system is in its normal state that obeys to F-D
distribution. So that the partition function yields to (e
A
+1). The shorter presentation of the
exponential term contained by both of the distribution functions is abbreviated by
A=(E-
μ
)/
κ
Β
T, where E is the energy of the system,
μ
is the chemical potential,
κ
Β
is the Boltzmann
constant and
T is the temperature. At normal state, where T>T
c
, the spin quantum number
(S) is ½ and angular momentum quantum number (L) is zero.
At the critical transition temperature, T=T
c
, the exponential term becomes equal to 1 (unity)
that yields to e
A
=1.The illustration of the distribution function at the vicinity of the critical
Meissner transition temperature is given in Fig. 5.
Fig. 5. The repsentative illustration of the distribution function at the vicinity of the critical
Meissner temperature T
c
. At the Meissner transition temperature, the partition function equals
to zero that results in the equality of the chemical potential to the total energy of the system.
Superconductor
280
At T
c
, the absolute value of the chemical potential,
μ
equals to the total energy of the system,
Ε
. Hence, the partition function approaches to zero, so that the distribution function
diverges to infinity.
Below T
c
, the distribution function obeys to B-E distribution where the angular momentum
and spin quantum numbers are L=2 and S=0, respectively.
In short, the exponential terms of the partition functions both have the same magnitude that
reaches the unity at T=T
c
. So that the ±1 interval has a crucial role for determining the
distribution functions and that of the order parameters of the superconducting system, as
well (Onbaşlı et al., 2006).
3.4 The quantum mechanical analysis of mercury cuprate superconductors
The quantum mechanical interpretation of PME is based on the development of a
conceptual relationship between the time reversal symmetry and the magnetic quantum
number of the system. It is known that, reversing the time (
t) not only replaces t by -t in
equations, but also it reverses momentums defined by the time derivatives of spatial
quantities such as angular momentum, L. Furthermore, magnetic quantum number, m,
refers to the projection of the angular momentum, L
z
. This component of angular
momentum in z direction is defined by the well known formula:
L
z
=m (2)
where
(=h⁄2π) is the reduced Planck constant. Since, there is a relationship between the
magnetic moment and the magnetic quantum number, inverting the direction of the time
flow will affect the sign of the z component of the angular momentum, the magnetic
quantum number, and magnetic moment of the system. For this reason, the magnetic
moment (susceptibility
1
) versus temperature data has been re-examined in the context of
magnetic quantum numbers as illustrated in Fig. 6. In this respect, alternative current
magnetic susceptibility versus temperature data of the optimally oxygen doped Hg-based
cuprate had been previously suggested to explain the time reversal symmetry breaking
phenomenon (Onbaşlı et al., 2009). In Fig. 6, magnetic susceptibility versus temperature
curve of Hg-1223 has been divided into three regions with respect to magnetic quantum
number, m. Since the system investigated is represented by the d-wave symmetry with the
orbital quantum number, ℓ, equals to 2, the m values will vary from minus two to plus two
(ℓ = 2, m = ±2, ±1, 0).
In the non-superconducting region III, the superconducting system has the room
temperature symmetry (s-wave symmetry). The temperature region, at which the d-wave
symmetry is valid, has been divided into two parts. In region II, magnetic quantum number,
m, equals to ±1. Since the imaginary component of the magnetic susceptibility is related to
the losses of the system, the imaginary component of magnetic susceptibility in region II
corresponds to the m =-1 domain. Hence the real component of magnetic susceptibility in
region II corresponds to m = +1 domain. Furthermore, m is equal to minus and plus two in
region I. By reducing the temperature, the magnetic quantum number of the system
experiences a change from ‘‘-” to ‘‘+” and vice versa. This means that the projection of the
1
Magnetic measurements have been performed under 1 Gauss of magnetic field.
Some Chaotic Points in Cuprate Superconductors
281
angular momentum in z direction, L
z
, passes through “zero” at T
PME
. From this point of
view, T
PME
is attributed to the breaking point of the time reversal symmetry.
Fig. 6.
Magnetic susceptibility (magnetic moment) versus temperature for the optimally
oxygen doped Hg-1223 sample at 1 Gauss of a.c. magnetic field. The d-wave and room
temperature symmetry regions together with the related magnetic quantum numbers (m)
are indicated for three distinguished regions (Onbaşlı et al., 2009).
Related to the quantum mechanical analysis, the concept of the parity should be taken into
account. For T>T
PME
temperatures, the superconducting system has the odd parity. In the
other words, the wave function of the system is anti-symmetric, so there is 2-dimensional
degree of freedom. For the temperatures lower than T
PME
, the superconducting system has
the even parity and the symmetric wave function with 1-dimensional degree of freedom.
Moreover, it has been determined that, the quantum gravity point, T
QG
, which emphasized
in the following chapter, appears at region I at which the superconducting system has one
dimensional degree of freedom with the even parity.
4. X-Ray Diffraction (XRD) pattern analysis and the lattice parameters of the
mercury cuprates
In this work, the crystal structure of the mercury based copper oxide layered high
temperature superconductors is determined by the XRD measurements. The first motivation
of performing the XRD measurements is to determine the “s” parameter, which has a crucial
importance in calculating the Josephson penetration depth electrodynamics parameter. The
second motivation is to investigate the effects of the crystal structure of the superconducting
sample on the critical quantum chaos points. As is known, the crystal structure is directly
affect the critical quantum chaos point temperatures, such as T
c
and T
PME
(Aslan et al., 2009).
Superconductor
282
The XRD patterns have been extracted from a Cu/40kV /40kA Rigaku Model XRD device.
The XRD patterns of the optimally doped and under oxygen doped samples have been
shown in Fig. 7 and Fig. 8, respectively.
According to Fig. 7 and Fig. 8, the lattice parameters of both the optimally and under doped
Hg-1223 superconductors have been calculated and the results are given in Table 1 and
Table 2, respectively (Aslan, 2007; Aslan et al., 2009).
a-axis b-axis c-axis
3.8684 A
3.8684 A
15.7182 A
Table 1. The lattice parameters of the optimally doped sample calculated from the XRD data
given in Fig. 7 (T
c
=140 K).
a-axis b-axis c-axis
3.8328 A
3.8328 A
15.7452 A
Table 2. The lattice parameters of the under doped sample calculated from the XRD data
given in Fig. 8 (T
c
=135 K).
Fig. 7. XRD Pattern and (hkl) planes (Miller indices) of the optimally doped sample in 50
minutes counting.
* indicates Hg-1212 and ▼ indicates Hg-1223 phases, respectively.
The X-ray data taken on the optimally and under-doped samples have been clearly shown a
mixed phase of HgBa
2
CaCu
2
O
6+x
(Hg-1212) and HgBa
2
Ca
2
Cu
3
O
8+x
(Hg-1223). According to the
data taken on both samples, the crystal symmetries have been found to be tetragonal structure
with a space group of P4/mmm. This result is also consistent with the previous scientific
literature on the crytal symmetry of mercury cuprate family superconductors. As is known,
Some Chaotic Points in Cuprate Superconductors
283
that the crystal structure of cuprates can generally be divided into two categories; tetragonal
and orthorhombic lattices. Some cuprates such as La
2-x
Sr
x
CuO
4
, Tl
2
Ba
2
CaCu
2
O
8
,
HgBa
2
CaCu
2
O
6
(Hg-1212), and HgBa
2
Ca
2
Cu
3
O
8+x
(Hg-1223) and some others have the
tetragonal crystal structure (Wagner et al., 1995; Gough, 1998; Tsuei & Kirtley, 2000; Li, 2003).
Fig. 8. XRD Pattern and (hkl) planes (Miller indices) of the under doped sample in 7 hours
counting. * indicates Hg-1212 and ▼ indicates Hg-1223 phases, respectively.
The average spacing between the copper oxide layers of the mercury based sample, “s” has
been determined from the translation vector along the c-direction of the unit cell
2
.
The average spacing between copper oxide layers of the optimally and the under oxygen
doped samples have been calculated as 7.8591
A
and 7.8726
A
, respectively. Both of the
average spacing values will be used to determine the Josephson penetration depth of the
superconductors in further works.
Moreover, it has been determined that the superconducting plane (ab-plane) of the
optimally doped sample is larger than that of the under-doped sample. However, the lattice
parameter along the c-axis of the optimally doped sample is 0.027
A
shorter than the other
one. Recalling the fact that the reduction in c-axis parameter increases the quantum
tunnelling probability between the superconducting CuO
2
ab-planes, so that the T
c
of the
optimally doped sample is higher than that of the under-doped sample. According to our
experimental studies, it has been determined that the deficiency of oxygen doping reduces
the T
c
by few Kelvin degree for bulk mercury based sample (Onbaşlı et al., 1996). Also, it has
been observed that the critical quantum chaos points of the optimally doped sample are
higher than that of non-doped samples.
2
The schematic representation of the unit cell of Hg-1223 superconductors was given in Fig. 1.
Superconductor
284
Furthermore, as is known, the existence of the intrinsic Josephson effect in superconductors
indicates the formation of natural super lattices of Josephson junctions in the crystal
structure. According to Ustinov, the spatial period of the super lattices is only 15
A
so that
Josephson junctions are densely packed in the intrinsic structure (Ustinov, 1998). From this
point of view, the mercury based copper oxide layered superconductors also include a
natural super lattice with the translation vector magnitude of 15.71
A
and 15.74 A
for the
optimally and under doped samples, respectively.
5. The Scanning Electron Microscope (SEM) analysis and the average grain
size of the superconducting samples
In this work, the average grain size “t” of the mercury based copper oxide layered high
temperature superconductors is determined by the SEM measurements. The motivation of
performing the SEM measurements is to determine the “t” parameter, which has a crucial
importance in calculating the critical current densities, J
c
and the interrelated parameter of
Josephson penetration depth,
λ
j
.
The critical current density of the mercury cuprates is calculated by the Bean Critical State
Model (Bean, 1962; Bean, 1964) below the lower critical magnetic field
3
,
4
30
c
M
J
t
π
Δ
=
(3)
where
∆M is the magnetization difference between the increasing and decreasing field
branches of the M-H curves and t is the average grain size of the specimen (Onbaşlı et al.,
1998). The dynamic hysteresis measurements of the optimally oxygen doped Hg-1223
samples for various temperatures have been performed by the Quantum Design SQUID
susceptometer, model MPMS-5S (Fig. 9). The magnetic field of 1 Gauss has been applied
parallel to the c-axis and the critical currents flowed in the ab-plane of sample.
Fig. 9. Magnetization versus applied magnetic field (M–H) for the optimally oxygen doped
Hg-1223 samples at 4.2, 27 and 77 K.
3
Since the calculations have been made below the lower critical magnetic field, H
c1
, the whole magnetic
flux has been totally expelled from the sample.
Some Chaotic Points in Cuprate Superconductors
285
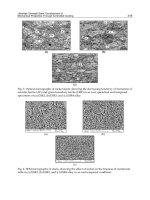
The SEM measurements have been performed by JSM-5910 LV and ESD X350 model SEM
devices. The related SEM images are given in Fig. 10 and Fig. 11.
Fig. 10. The optimally oxygen doped Hg-1223 sample with rectangular shape. The SEM
output has been taken at 20 kV and JSM-5910 LV (T
c
=140 K, t=1.098 μm)
Fig. 11. The optimally oxygen doped uncut (virgin) Hg-1223 sample. The SEM output has
been taken at 20 kV, ESD X350. (T
c
=136 K, t=1.5 μm) (Onbaşlı et al, 1998).
The average grain sizes of the Hg-1223 samples have been found by using the intercept
method and the results are given in Table 3.
According to the SEM outputs, the grain size of the superconductors affects the Meissner
transition temperature which is the one of the critical quantum chaos points. In
experimental studies, it has been found that the smaller the grain size the higher the
Meissner transition temperature (Table 3) (Aslan et al., 2009; Özdemir et al., 2006; Onbaşlı et
Superconductor
286
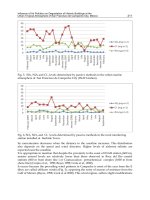
al., 1998). Also, the effect of the shape of the superconductors has been investigated by the
magnetic moment versus temperature data by which the critical quantum chaos points have
been determined (Table 3) (Aslan et al., 2009).
The grain size,
t (μm)
The Meissner transition
temperature,
T
c
(K)
The paramagnetic
Meissner temperature,
T
PME
(K)
Cut sample 1.098 140 122
Virgin sample 1.5 137 126
Table 3. The grain size and the Meissner transition temperatures of cut and virgin samples
By using Eq. (3) and the grain sizes determined by SEM, the critical current densities for the
optimally doped Hg-1223 superconductors have been calculated to vary 10
12
A/m
2
to 10
10
A/m
2
. Ultimately, according to our new method, the Josephson penetration depth have
been calculated by Eq. (1) via the “s” parameter determined in the previous section and the
critical current density. The Josephson penetration depth values have been obtained to be in
the order of micrometers.
6. Conclusion
In this chapter, the investigation of the variation of the tunneling probability in high
temperature superconductors depending on the oxygen content and that of the geometry of
the sample has been realized. Moreover, a new magnetic method to calculate the Josephson
penetration depth reliably has been introduced. It is also shown that this work displays a
correlation between SEM, XRD data and quantum chaos points of the superconducting
sample establishing a bridge between the momentum and Cartesian spaces.
The determination of chaotic points has a crucial importance for technological applications
of the superconductors. Hence, the prediction of the quantum chaotic points of a
superconducting system enables the technologists to figure out the reliable working
temperature interval for construction of superconducting devices such as bolometers, MRS
and all the magnetically sensitive detectors.
Moreover, the appropriately oxygen doped and cut mercury cuprate samples have the
highest Meissner transition temperature of 140K ever obtained among the other
superconductors prepared under the normal atmospheric pressure. Furthermore, the
stability has been confirmed by SQUID measurements performed on the mercury based
cuprate samples which have been kept in air for several months after being synthesized.
From this point of view, the high stability and durability of the superconducting system
with the highest Meissner transition temperature make the mercury cuprate family
superconductors as a convenient candidate for the advanced and sensitive technological
applications
7. References
Anderson, PW. (1958). Coherent excited states in the theory of superconductivity: Gauge
invariance and the Meissner effect.
Physical Review, Vol. 110, Issue. 4 827–835, ISSN:
1094-1622 (online), ISSN:1050-2947(print).
Some Chaotic Points in Cuprate Superconductors
287
Anderson, P.W. (1963). Plasmons, gauge invariance, and mass, Physical Reviews, Vol. 130,
Issue 1 439-442, ISSN:1050-2947(print).
Aoki, R.; Murakami, H.; Kita, T.; Shirai. M.; Nishio, Y.; Svistunov, VM.; Dyachenko, A.I. &
Afanassyev, D.N. (1996). Phonon Contribution on the high T
c
cooper pairing
investigated by tunneling spectroscopy.
Physica B, Vol. 219, Issue 1-4 172-174, ISSN:
0921-4526.
Aslan, Ö. (2007). Investigation of the symmetries and the breakages in relativistic and non-
relativistic regions in high temperature superconductors. PhD Thesis Marmara
University Institute of Pure and Applied Sciences.
Aslan, Ö.; Güven Özdemir, Z.; Keskin, S.S. & Onbaşlı, Ü. (2009). The chaotic points and xrd
analysis of Hg-based superconductors”.
Journal of Physics: Conference Series, Vol 153,
Number. 1/ 012002 1-9, ISSN:1742-6596 (online), ISSN:1742-6588 (print),
Aslan Çataltepe Ö.; Güven Özdemir, Z.; Arık, M. & Onbaşlı Ü. (2010). Strong-electroweak
unification and quantum gravity achieved in chaotic regime. submitted to Chaos
Solitons & Fractals ISSN:0960-0779 (online)
Bean, C.P. (1962). Magnetization of hard superconductors.
Physical Review Letters, Vol.8,
Issue 6 250-253, ISSN:1079-7114 (online), ISSN:0031-9007 (print).
Bean, C.P. (1964). Magnetization of high field superconductors.
Review of Modern Physics,
Vol. 36 Issue 1 31-39, ISSN:1539-0756 (online), ISSN:0034-6861 (print).
Bogomolny, E.; Gerland, U. & Schmit, C. (1999). Models of intermediate spectral statistics.
Physical Review E, Vol. 59, Issue 2, R1315-R1318, ISSN:1550-2376 (online), ISSN:1539-
3755 (print).
Braunish, W.; Knauf, N.; Kataev, V.; Neuhausen, S.; Grutz, A.; Kock, A.; Roden, B.;
Khomskii, D. & Wohlleben, D. (1992). Paramagnetic Meissner effect in Bi high-
temperature superconductors.
Physical Review Letters, Vol. 68, Issue 12 1908-1911,
ISSN:1079-7114 (online), ISSN:0031-9007 (print).
Braunish, W.; Knauf, N.; Bauer, G.; Kock, A.; Becker, A.; Freitag, B.; Grutz, A.; Kataev, V.;
Neuhausen, S.; Roden, B.; Khomskii, D. & Wohlleben, D. (1993). Paramagnetic
Meissner effect in high-temperature superconductors.
Physical Review B, Vol. 48,
Issue 6 4030-4042, ISSN:1550-235X (online), ISSN:1098-0121 (print),
Egami, T.; Chung, J.H.; McQueeney, R.J.; Yethiraj, M.; Mook, H.A.; Frost, C.; Petrov, Y.;
Dogan, F.; Inamura, Y.; Arai, M.; Tajima, S. & Endoh, Y. (2002). Electron–phonon
interactions in HTSC cuprates.
Physica B Vol. 316-317, 62-68, ISSN: 0921-4526.
Evangelou, S.N. & Pichard J.L. (2000). Critical quantum chaos and the one dimensional
harper model,
Physical Review Letters, Vol. 84, Number 8 1643-1646, ISSN: 1079-7114
(online), ISSN: 0031-9007 (print)
Evangelou, S.N. (2001). Critical quantum chaos,
Physica B, Vol. 296, 62-65, ISSN: 0921-4526.
Fossheim, K. & Sudbo, A. (2004).
Superconductivity: Physics and Applications, John Wiley &
Sons Ltd, ISBN-10: 0-470-84452-3, Great Britain.
Horovitz, B. & Golub, V. (2002). Spontaneous magnetization and Hall effect in
superconductors with broken time-reversal symmetry.
Europhys Lett. Vol. 57,
Number 6 892–897, ISSN:1286-4854 (online), ISSN:0295-5075 (print).
Gleick, J. (1987).
Chaos: Making a New Science, Viking, ISBN: 0140092501, New York.
Gough, C.E. (1998). C-axis conductivity and the role of d-wave superconductivity and
fluctuations on anisotropic high temperature superconductors. In:
The Gap
Symmetry and Fluctuations in High- Tc Superconductors
Nato ASI Series, Series B:
Superconductor
288
Physics vol 371, J. Bok, G. Deutscher, D. Pavuna & S.A. Wolf (Eds.), 465-485, Plenum
Press, ISBN:978-0-306-45934-4, New York.
Greiter, M. (2005). Is electromagnetic gauge invariance spontenously violated in
superconductors? Annals of Physics Vol. 319, Issue 1 217-249, ISSN:0003-4916.
Güven Özdemir, Z.; Aslan, Ö. & Onbaşlı, Ü. (2007). Calculation of microwave plasma
oscillation in high temperature superconductors. In:
The Seventh International
Conference on Vibration Problems ICOVP 2005 Springer Proceedings in Physics
, E. İnan
& E. Kırış (Eds.), 377-382, Springer, ISBN: 978-1-4020-5400-6, Dordrecht, The
Netherlands.
Güven Özdemir, Z.; Aslan, Ö.& Onbaşlı, Ü. (2009). Terahertz oscillations in mercury
cuprates superconductors,
Pramana-Journal of Physics, Vol. 73, No. 4 755- 763. ISSN:
03044289.
Kadowaki, K.; Kakeya, I. & Kindo, K.(1998). Observation of the Nambu–Goldstone mode in
the high-temperature superconductor Bi
2
Sr
2
CaCu
2
O
8+d
. Europhys Lett., Vol. 42, 203–
208, ISSN: 1286-4854 (online), ISSN: 0295-5075 (print).
Ketterson, J. B. & Song S. N. (1999)
Superconductivity, Cambridge University Press, ISBN:0-
521-56295-3 , United Kingdom.
Lawrence, W.E. & Doniach S. (1971). Theory of Layer Structure Superconductors. In:
Proceedings of the 12
th
International Conference on Low Temperature Physics, E. Kanda
(Ed.), 361-362, Academic Press of Japan, Kyoto.
Li, M.S. (2003). Paramagnetic Meissner effect and related dynamical phenomena.
Physics
Reports
, Vol. 376,Iissue 3 133-223, ISSN: 0370-1573.
Nambu Y. (1960). Quasi-particles and gauge invariance in the theory of superconductivity.
Phys Rev., Vol. 117 Issue 3 648–663, ISSN:1536-6065 (online).
Nambu, Y. & Pascual, N. (1963). Self-Consistent Models Of Strong Interaction With Chiral
Symmetry,
Nuovo Cimento Vol. 30, 354-365.
Nielsen, A. P.; Cawthorne, A.B.; Barbara, P.; Wellstood, F.C.; Lobb, C.J.; Newrock, R.S. &
Forrester, M.G. (2000). Paramagnetic Meissner effect in multiply-connected
superconductors,
Physical Review B, Vol. 62, No.21 14380-14383, ISSN: 1550-235X
(online).
Onbaşlı, Ü. ; Wang, Y.T.; Naziripour, A.; Tello, R.; Kiehl, W. & Hermann, A.M. (1996).
Transport properties of high Tc mercury cuprates.
Physica Status Solidi B Vol. 194,
371-382, ISSN: 0370-1972.
Onbaşlı, Ü.; Öztürk, S.; & Hasçiçek, Y. (1998). Magnetic measurement of critical currents on
mercury cuprates.
Applied Superconductivity Conference California, September 1998,
USA.
Onbaşlı, Ü. (2000). Oxygen post-annealing at the crirtical parameters of mercury cuprates,
Physica C, Vol. 332, 333-336, ISSN 0921-4534.
Onbaşlı, Ü.; Aslan, Ö. & Güven Özdemir, Z. (2006). The super logic in the concept of
probability density. In:
Logic, Mathematics and Probability IV National Symposium on
Probability 5-8 September 2006, Foça İzmir
, 77-87, İstanbul Kültür Üniversitesi
Yayınları, Yayın No: 3, ISBN: 978-975-6957-74-5, İstanbul, Turkey.
Onbaşlı , Ü. ; Güven Özdemir, Z. & Aslan, Ö.(2009). Symmetry breakings and topological
solitons in mercury based d-wave superconductors.
Chaos, Solitons & Fractals Vol.
42, No. 4, (30 November 2009) 1980-1989, ISSN:0960-0779 (online).
Some Chaotic Points in Cuprate Superconductors
289
Özdemir, Z.G.; Aslan Ö. & Onbaşlı Ü. (2006). Determination of c-axis electrodynamics
parameters of mercury cuprates.
Journal of Physics and Chemistry of Solids, Vol. 67
No. 1-3 (January-March 2006) 453-456 ISSN:0022-3697.
Panagopoulos, C. & Xiang, T. (1998). Relationship between the superconducting energy gap
and the critical temperature in high-Tc superconductors.
Physical Review Letters,
Vol. 81, 2336–2339, ISSN: 1079-7114 (online), ISSN: 0031-9007 (print).
Quigg, C. (2008). The coming revolutions in particle physics.
Scientific American February
2008,46-53, ISSN:0036-8733.
Quigg, C. (2006). Particles and the standard model. In:
The New Physics For The Twenty-First
Century
, F. Gordon (Ed.), 86-118, Cambridge University Press, ISBN-10:0-521-
81600-9, New York.
Rickazyen, G. (1958). Meissner effect and gauge invariance.
Physical Review Vol. 111 Issue 3
817–821, ISSN: 1094-1622 (online), ISSN:1050-2947(print).
Roman, P. (2004). Why symmetry?, In:
Symmetries in Science XI, B. J. Gruber, G. Marmo & N.
Yoshinaga (Eds.), 1-12, Kluwer Academic Publisher, ISBN:1-4020-2633-1 (HB),
Netherlands.
Sigrist, M.; Agterberg, D.F.; Frigeri, P.A.; Hayashi, N.; Kaur, R.P.; Koga, A.; Milat, I. &
Wakabayashi, K. (2006). Unconventional superconductivity in non-
centrosymmetric materials In:
Effective Models for Low Dimensional Strogly Correlated
Systems AIP Conf Proc
Vol. 816, G.G. Batrouni & D. Poilblanc (Eds.), 124-135,
American Institute of Physics, ISBN: 0-7354-0309-0, New York.
Smolin, L. (2006).
The trouble with physics, the rise of string theory, the fall of a science and what
come next
, Houghton Mifflin Company, ISBN-10:0-618-55105-0, Boston/New York.
Tachiki, M.; Koyama, T. & Takahashi, S. (1996)-(a). Some exotic phenomena related to
vortices in high-Tc and heavy fermion superconductors.
Physica C Vol. 263,
Number 1 May 1996 1–11, ISSN: 0921-4534.
Tachiki, M.; Koyama, T. & Takahashi, S. (1996) –(b). Josephson plasma in high temperature
superconductors. In:
Coherence in Superconductors, G. Deutscher & A. Revcolevschi
(Eds.), 371-392, World Scientific Publishing Company Inc., ISBN-10:9810226500,
Singapore.
Tinkham, M. (2004).
Introduction to Superconductivity, (Second Edition) Dover Publications,
ISBN-10: 0486435032 New York.
Tsudo, N. & Shimada, D. (2003). Layer number dependence of superconducting critical
temperature of cuprates: consequence of a phonon contribution to the pairing.
Physica C Vol. 390, Issue 2 (15June 2003) 95-100, ISSN: 0921-4534.
Tsuei, C.C. & Kirtley, J.R. (2000). Pairing symmetry in cuprate superconductors.
Reviews of
Modern Physics
, Vol. 72, Issue 4 969-1016, ISSN: 1539-0756 online), ISSN: 0034
6861(print).
Ustinov, A.V. (1998). Solitons in Josephson junctions.
Physica D Vol. 123, Issue 1-4 (15
November 1998) 315-329, ISSN: 0167-2789 (print).
Veltman, M.J. (1986). The Higgs bosons.
Scientific American November 1986, 88-94,
ISSN:0036-8733.
Waintal, X.; Weinmann, D. & Pichard, J. L. (1999).
Two interacting particles in a disordered
chain II: Critical statistics and maximum mixing of the one body state.
The European
Physical Journal B
Vol. 7 Februaury I 451-456, ISSN: 1434-6036 (online), ISSN: 1434-
6028 (print).
Superconductor
290
Wagner, J.L.; Hunter, B.A.; Hinks, D.G. & Jorgensen, J.D. (1995). Structure and
superconductivity of HgBa2Ca2Cu3O8+δ.
Physical Review B Vol. 51, Issue 21 15407-
15414, ISSN: 1550-235X (online), ISSN: 1098-0121 (print).
Weinberg, S. (1996).
The Quantum Theory of Fields Volume II, Cambridge University Press,
ISBN:0-521-55002-5 (hardback), USA.
Zhang, W. (2001). Nontrivial gauge symmetry in high Tc superconductivity.
Physica C, Vol.
364-365, (November 2001) 147-150, ISSN: 0921-4534.