Satellite Communications Part 14 pot
Bạn đang xem bản rút gọn của tài liệu. Xem và tải ngay bản đầy đủ của tài liệu tại đây (2.14 MB, 30 trang )
Planar Antennas For Satellite Communications 381
∂E
x
∂t
=
1
∂H
z
∂y
−
∂H
y
∂z
−(J
source
x
+ σE
x
)
(42)
∂E
y
∂t
=
1
∂H
x
∂z
−
∂H
z
∂x
−(J
source
y
+ σE
y
)
(43)
∂E
z
∂t
=
1
∂H
y
∂x
−
∂H
x
∂y
−(J
source
z
+ σE
z
)
(44)
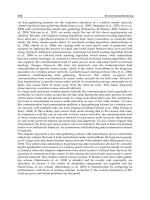
These equations are transformed in a discrete form using the Yee algorithm, which can be
solved by computational methods, as an example is presented only one of them:
E
x
|
n+1/2
i,j
+1/2,k+1/2
−E
x
|
n−1/2
i,j
+1/2,k+1/2
∆t
=
1
i,j+1/2,k−1/2
·
H
z
|
n
i,j
+1,k+1/2
−H
z
|
n
i,j,k
+1/2
∆y
−
H
y
|
n
i,j
+1/2,k+1
−H
y
|
n
i,j
+1/2,k
∆z
−J
source
x
|
i,j+1/2,k+1/2
−σ
i,j+1/2,k+1/2
E
x
|
i,j−1/2,k+1/2
(45)
Yee Algorithm discretizes both time and space, represented by parameters n, i, j, k with inter-
vals of ∆t and ∆ respectively. As seen in equation (45) the media characteristics are specially
considered as , µ and σ which position is defined using the
(i, j, k) subindex, then is possible
to analyze the effects of any material at any position on the computational space. A com-
putational code of any program language permits to know the EM behavior over the entire
computational space. The FDTD and also the FE differential-equation methods are partic-
ularly suitable for modeling full three-dimensional volumes that have complex geometrical
details. They are extremely efficient for smaller close-region problems involving inhomoge-
neous media (James et al., 1989).
4.3 Computational tools comparison
An excellent summary and comparison of actual available commercial software used on pla-
nar antenna analysis and design is presented in (Vasylchenko, 2009), they analyze 5 commer-
cial tools and one “in house”, comparing all of them in the analysis of planar antennas looking
to guarantee the optimal use of each of the software packages, to study in detail any discrep-
ancies between the solvers, and to assess the remaining simulation challenges. Even their
work is not the first one on the theme, mentioning references strengthening their vision that,
an extensive benchmark study over a large variety of solvers and for several structures has
not yet been documented.
As the operation of EM solvers is based on the numerical solution of Maxwell’s equations in
differential or integral form, one or other influences the efficiency and accuracy and users may
get the wrong impression that a given solver is automatically suited to solve any kind of prob-
lem with arbitrary precision. Comparison in the Vasylchenko work verifies the plausibility of
such expectations by presenting an extensive benchmark study that focuses on the capabili-
ties and limitations of the applied EM modeling theories that usually remain hidden from the
antenna designer. The integral solvers they analyze are the one they designed in K. U. Leu-
ven’s: MAGMAS 3D, the others are IE3D from Zeland Software, FEKO from EM Software &
Systems, and ADS Momentum from Agilent. On the other hand they analyze the two leading
differential EM tools, HFSS from Ansoft for the finite-element method, and CST Microwave
Studio for the FDTD method. After a careful analysis, comparing results with measurement
of 4 common planar antennas, their conclusion is as follows:
Classical patch antennas could be predicted by every simulation program with a deviation not
beyond 1.5 %. The simulation based on MoM was inherently faster and are more attractive
in price. On the other hand the FEM and FDTD are inherently able to analyze much more
general structures, but require the inversion of much larger, but sparse, matrices, requiring
higher memory resources. Although the calculation times were not that different at the time of
experiment, they presented a reference in which it seems that dedicated inversion techniques
for MoM solvers are nowadays fully in development, opening the possibility that better times
can be obtained for differential equations solvers.
Proper mesh generation and a correct feeding model are two crucial issues predetermining
the successful simulation in the software packages reviewed. In general, a very neat adaptive
mesh refinement, implemented in Ansoft’s HFSS and as an option in CST’s MWS, allows
better handling of a design with difficult electromagnetic coupling between its different parts.
Such characteristics pertain to applications in mobile gadgets, such as the GSM antennas.
Having no mesh refinement option, MoM-based programs require more careful consideration
of the initial meshing. MoM solvers can provide an improvement in simulation results and
time using so called edge-meshing features, while avoiding excessive meshing on the bulk of
the metal structure. However the study concludes that the meshing schemes in all solvers are
adequate.
Some designs, such as the GSM and UWB antennas, require finite substrate effects to be taken
into account, such as diffraction from substrate edges. MoM based solvers show better con-
vergence when a dielectric substrate is infinite, but the trend toward miniaturizing anten-
nas diminishes the advantage of using these solvers, then they conclude that at present, dif-
ferential equations programs are better suited for modeling small antennas. On the other
hand(Vasylchenko, 2009) suggest that the feeding models, as implemented today in the wide-
spread commercial 35 solvers, are probably unsatisfactory in the case of small structures with
complicated electromagnetic-coupling behavior, but HFSS and CST MWS solvers are better
suited to handle the problem.
As a final guideline, authors recommend the use of two different solvers, based on different
theoretical methods (integral and differential), to characterize a specific device if both results
are in good agreement, it is reasonable to expect that the results can be trusted, if the two re-
sults are in disagreement, a deeper investigation of the structure and its modeling is absolutely
necessary.
5. Planar antennas on space applications
When a designer decide to use planar or microstrip antennas on a space applications should
take in account three factors among those related with the inherent design of the radiator
(Lee, 1997); those factors are critical and need to be considered. One is that the antenna must
be able to support the high vibration produced during the launch from the Earth; acceleration
can be as high as 10 Gs or more, under this conditions soldering junctions and laminating
of multilayer antennas tend to breakdown, then they should be made strong enough to sur-
vive the vibration, a solution could be the use of noncontacting feeds as proximity, capacitive
or aperture coupling. The second factor is related with the extreme temperature difference
which can be as high as 100°C to -70°C, whether the antenna “sees” the sun or not, behind a
shaded area. Under this condition, the laminating adhesive material must survive physically
and electrically into this environment. Third factor is the space vacuum, as is known at low
Satellite Communications382
pressures, electrons are almost free to leave an electrode and move across to the opposite elec-
trode, a phenomenon known as multipacting. For a microstrip antenna, the two electrodes
are the patch and the ground plane, when the phenomenon is present reduces the capacity of
power handling of the antenna then it should be designed with the proper thickness. These
three factors limit the use of planar and especially microstrip antennas, nevertheless there are
many examples of spacecrafts which can be mentioned: Earth Limb Measurements Satellite,
Shuttle Imaging Radar, Geostar system and especially the Mars Pathfinder using a small X
band microstrip antenna providing circular polarization with a peak gain of 25 dB. Antenna
was constructed with a parallel feed power divider and electromagnetically coupled dipoles.
The divider and the dipoles were printed on multilayer honeycomb substrates which have
open vented cells for space applications.
5.1 Morelos: First Mexican Satellite System
Historically the first satellites using planar antennas could be the Mexican Morelos System,
constructed by Hughes Aircraft Company (Satmex, 2010);. They were launched on the space
Shuttle in June 17 and November 27, 1985 and they were the first in use the HS-376 platform as
a hybrid satellite operating in two frequency bands (C and Ku) simultaneously. The four Ku-
band channels used the planar arrays for reception only having a bandwidth of 108 MHz with
a minimum effective isotropic radiated power (EIRP) of 44 dBW throughout Mexico. Transmit
and receive beams in the C-band and the transmit beams in the Ku-band were created by a
1.8 m wide shared aperture grid antenna with two polarization-selective surfaces. The front
surface was sensitive to horizontally polarized beams and the rear was sensitive to vertically
polarized beams. Separate microwave feed networks are used for the two polarizations. Fig.
8(a) shows the spacecraft with the planar array and Fig. 8(b)the antenna and the reflector
in the construction bay. Morelos Satellites were a very successful communications system;
Morelos 1 exceeded his life from 9 years to 10, when it was substituted in 1996 for the first
satellite of 2
nd
generation of Mexican satellites, but Morelos 2 was in operation until to 2002,
almost doubling its life designed time.
5.2 The IRIDIUM Main Mission Antenna Concept
A commercial satellite system using planar antennas is the MOTOROLA’s IRIDIUM (Schuss
et al., 1990) shown in Fig. 8(c) used for personal satellite communications with a constella-
tion of 66 satellites placed in low earth orbit, positioned in six polar orbital planes with 11
satellites plus one spare per plane. The main mission antenna (MMA), consists of three fully
active phased-array panels providing the band link from the satellite to the ground user. Each
phased-array panel produces 16 fixed simultaneous beams for a total of 48 beams per satellite
linked to hand-held phones having low-gain antennas. The MMA radiates multiple carri-
ers into multiple beams with high efficiency and linearity as well as being lightweight and
able to function in the thermal and radiation environment of space. MMA was optimized
for the highest link margin accordingly with its size and the budgeted RF power per carrier.
The architecture of the MMA phased-array panel is shown in Fig. 8(d); each array consists
of over 100 lightweight patch radiators, each of which is driven by a Transmitter/Receiver
(T/R) module, which are in turn collectively excited by an optimized beamformer network.
The beamformer network forms the 16 optimized shaped beams for both transmit and receive
operation with the T/R modules maintaining a high G/T in receive operation and efficient
EIRP generation for transmit operation. The satellite can receive or transmit through each
beamport, providing the RF access to a particular fixed beam. In general, several or all beams
(a) The Morelos satellite (b) The Morelos at the construction
bay
(c) IRIDIUM space vehicle (©(1999)
IEEE)
(d) MMA panel construction (©(1999)
IEEE)
Fig. 8. The use of planar antennas in commercial satellites and space vehicles
can be utilized at once in either transmit or receive operation with the only limitation being
the MMA capacity constraints on transmit.
5.2.1 Patch Radiator
(a) Bottom view of patch radiator
(©(1999) IEEE)
(b) Top view of patch radiator (©(1999)
IEEE)
Fig. 9. Patch radiator developed for the MMA
Planar Antennas For Satellite Communications 383
pressures, electrons are almost free to leave an electrode and move across to the opposite elec-
trode, a phenomenon known as multipacting. For a microstrip antenna, the two electrodes
are the patch and the ground plane, when the phenomenon is present reduces the capacity of
power handling of the antenna then it should be designed with the proper thickness. These
three factors limit the use of planar and especially microstrip antennas, nevertheless there are
many examples of spacecrafts which can be mentioned: Earth Limb Measurements Satellite,
Shuttle Imaging Radar, Geostar system and especially the Mars Pathfinder using a small X
band microstrip antenna providing circular polarization with a peak gain of 25 dB. Antenna
was constructed with a parallel feed power divider and electromagnetically coupled dipoles.
The divider and the dipoles were printed on multilayer honeycomb substrates which have
open vented cells for space applications.
5.1 Morelos: First Mexican Satellite System
Historically the first satellites using planar antennas could be the Mexican Morelos System,
constructed by Hughes Aircraft Company (Satmex, 2010);. They were launched on the space
Shuttle in June 17 and November 27, 1985 and they were the first in use the HS-376 platform as
a hybrid satellite operating in two frequency bands (C and Ku) simultaneously. The four Ku-
band channels used the planar arrays for reception only having a bandwidth of 108 MHz with
a minimum effective isotropic radiated power (EIRP) of 44 dBW throughout Mexico. Transmit
and receive beams in the C-band and the transmit beams in the Ku-band were created by a
1.8 m wide shared aperture grid antenna with two polarization-selective surfaces. The front
surface was sensitive to horizontally polarized beams and the rear was sensitive to vertically
polarized beams. Separate microwave feed networks are used for the two polarizations. Fig.
8(a) shows the spacecraft with the planar array and Fig. 8(b)the antenna and the reflector
in the construction bay. Morelos Satellites were a very successful communications system;
Morelos 1 exceeded his life from 9 years to 10, when it was substituted in 1996 for the first
satellite of 2
nd
generation of Mexican satellites, but Morelos 2 was in operation until to 2002,
almost doubling its life designed time.
5.2 The IRIDIUM Main Mission Antenna Concept
A commercial satellite system using planar antennas is the MOTOROLA’s IRIDIUM (Schuss
et al., 1990) shown in Fig. 8(c) used for personal satellite communications with a constella-
tion of 66 satellites placed in low earth orbit, positioned in six polar orbital planes with 11
satellites plus one spare per plane. The main mission antenna (MMA), consists of three fully
active phased-array panels providing the band link from the satellite to the ground user. Each
phased-array panel produces 16 fixed simultaneous beams for a total of 48 beams per satellite
linked to hand-held phones having low-gain antennas. The MMA radiates multiple carri-
ers into multiple beams with high efficiency and linearity as well as being lightweight and
able to function in the thermal and radiation environment of space. MMA was optimized
for the highest link margin accordingly with its size and the budgeted RF power per carrier.
The architecture of the MMA phased-array panel is shown in Fig. 8(d); each array consists
of over 100 lightweight patch radiators, each of which is driven by a Transmitter/Receiver
(T/R) module, which are in turn collectively excited by an optimized beamformer network.
The beamformer network forms the 16 optimized shaped beams for both transmit and receive
operation with the T/R modules maintaining a high G/T in receive operation and efficient
EIRP generation for transmit operation. The satellite can receive or transmit through each
beamport, providing the RF access to a particular fixed beam. In general, several or all beams
(a) The Morelos satellite (b) The Morelos at the construction
bay
(c) IRIDIUM space vehicle (©(1999)
IEEE)
(d) MMA panel construction (©(1999)
IEEE)
Fig. 8. The use of planar antennas in commercial satellites and space vehicles
can be utilized at once in either transmit or receive operation with the only limitation being
the MMA capacity constraints on transmit.
5.2.1 Patch Radiator
(a) Bottom view of patch radiator
(©(1999) IEEE)
(b) Top view of patch radiator (©(1999)
IEEE)
Fig. 9. Patch radiator developed for the MMA
Satellite Communications384
Fig. 9(a) and Fig. 9(b), show the patch radiator developed for the MMA, which was manufac-
tured as a separate component and bonded onto the MMA panel during array assembly; its
radiator is built as one assembly and contains the matching and polarizing networks; a single
50 Ω input connector is provided on the underside of the patch for connection to the T/R
module. The radiator cavity is loaded with an artificial dielectric substrate whose weight is
approximately one tenth that of teflon, but which has a dielectric constant of approximately
two. This dielectric constraint is needed to obtain the desired scan and polarization perfor-
mance of the array. The artificial dielectric also permit efficient heat radiation out the front
face of the array during peak traffic loads.
5.3 Antennas for Modern Small Satellites
Many examples of planar antennas application are discussed in literature, but its major appli-
cation could be the modern small satellites (MSS) which are revolutionizing the space industry
(Gao et al., 2009). They can drastically reduce the mission cost, and can make access to space
more affordable.
These modern small satellites are useful for various applications, including telecommunica-
tions, space science, Earth observation, mitigation and management of disasters (floods, fire,
earthquake, etc.), in-orbit technology verification, military applications, education, and train-
ing. Typical antenna coverages ranges from low-gain hemispherical, to medium-gain anten-
nas. The basic radiator designs used are normally helices, monopoles, patches, and patch-
excited cups (PEC), depending on frequency and range, coverage requirements, and appli-
cation. As antenna examples of small satellites are mentioned various monopole antennas,
printed inverted-F-shaped antennas (PIFAs), microstrip-patch antennas, helices, and patch-
excited cup antennas, developed for telemetry, tracking, and command in the UHF, VHF, S,
C, and X bands. These antennas are simple, cheap, easy to fabricate, and have wide radiation-
pattern coverage; the satellite thus does not need accurate control of attitude.
Universities have played an important role in satellites development, since the beginning of
space era; professors were interested in the new research area, either as academic developers
or as a part of contracts with satellite industry, but small satellites seems to be a very appro-
priate area to be working in by universities, due the few economical resources needed. As
an example we can mention universities in Mexico, creating clusters to design small satel-
lites; institutions as CICESE (Centro de Investigación Científica y de Educación Superior de
Ensenada) in north of Mexico developing transponders and the Instituto Politécnico Nacional
working with satellite structures and integration into a clean room, design of monopoles and
planar antennas for satellite applications and also exploring the capabilities of new active de-
vices as candidates for LNA amplifiers (Enciso et al., 2005). An especial mention should be
make to the Universidad Nacional Autónoma de México (UNAM) which has been working
towards the design of a femto satellite.
Other illustrative example is the University of Surrey, which has been developing modern
small satellite technology since starting its UoSAT program in 1978. UoSAT-l, developed by
Surrey, was launched in 1981. This was followed by UoSAT-2 in 1984. UoSAT-l continued to
operate for eight years, while UoSAT-2 was still operational after 18 years in orbit. During
the past 30 years, the University of Surrey’s spinoff company, Surrey Satellite Technology Ltd.
(SSTL), together with Surrey Space Centre (SSC), have successfully designed, developed and
launched 32 modern small satellites for various countries around the world. (Gao et al., 2009)
have a complete description of various small satellites, which are described in the next lines
and figures. Fig. 10 shows a photograph of the S-band microstrip-patch antenna used at SSTL;
it employs a circular microstrip patch, fed by a 50Ω probe feed at the bottom. It can operate
within a tunable frequency range of 2.0-2.5 GHz. Left-hand or right-hand circular polarization
can be achieved by using a single feed combined with patch perturbation, or a 90°microstrip
hybrid combined with a circular patch. It achieves a maximum gain of about 6.5 dBi, has a
size of 82 x 82 x 20 mm, and a mass of less than 80 g. It can operate within -20°C to +50°C, is
radiation tolerant to 50 kRad, and qualified to 50 Gs rms random vibration on three axes.
Fig. 10. An S-band patch antenna SSTL. (©(2009) IEEE)
To respond the need for single-frequency low-profile and low-weight hemispherical or near-
hemispherical antennas, working at S, C, or X band, patch-excited cup antennas were devel-
oped at RUAG Aerospace Sweden. They consist of a short cylindrical cup, with a circular
cross section and an exciter. The cup is excited using a stacked circular dual-patch element,
or a single patch. The lower patch or the single patch is fed at one point, and the patch has
two opposite perturbations for generating circular polarization. The antennas have special
features to minimize their coupling to the surrounding spacecraft environment, as this is a
common problem for low-gain antennas of this type, and it has an effect on the installed
performance. The antenna’s diameter is 60 mm for the C band antenna, and 40 mm for the
X-band antenna. The mass is less than 90 g for the C-band antenna, and less than 20 g for
the X-band antenna. They are both almost all metal antennas (which is a preferred property),
with dielectric material only in the interface connector.
Fig. 11 shows the X-band patch-excited cup antennas that can be used for the telemetry, track-
ing, and command function. Fig. 12(a) shows the S-band patch-excited cup antenna, devel-
oped at Saab Space. It consists of three patches, mounted within a thin aluminum cup with a
rim height of about a quarter wavelength. Two lower patches form a resonant cavity, allowing
broadband or double tuning. The top patch acts as a reflector that affects the illumination of
the aperture, and is used to improve the aperture efficiency. To achieve circular polarization,
the lower patch is fed in phase quadrature at four points by a stripline network. It achieves a
maximum gain of about 12 dBi. A patch-excited cup antenna development performed at Saab
Space is the update of the antenna in Figure 6, to be used for other missions; it has a radiator
tower that is modified compared to the original design. It is now an all-metal design, and has
a new feed network configuration: an isolated four-point feed design, antenna is shown in
Fig. 12(b).
Surrey also pioneered the use of GPS and global navigation satellite systems (GNSS) in space.
A GPS receiver can provide accurate position, velocity, and time for LEO satellites. For this
application, the antenna needs to be compact, low profile, able to operate at GPS frequencies
in the L1 (1.575 GHz) and L2 (1.227 GHz) bands with stable performance, and produce low
backward radiation towards the small satellite body.
Planar Antennas For Satellite Communications 385
Fig. 9(a) and Fig. 9(b), show the patch radiator developed for the MMA, which was manufac-
tured as a separate component and bonded onto the MMA panel during array assembly; its
radiator is built as one assembly and contains the matching and polarizing networks; a single
50 Ω input connector is provided on the underside of the patch for connection to the T/R
module. The radiator cavity is loaded with an artificial dielectric substrate whose weight is
approximately one tenth that of teflon, but which has a dielectric constant of approximately
two. This dielectric constraint is needed to obtain the desired scan and polarization perfor-
mance of the array. The artificial dielectric also permit efficient heat radiation out the front
face of the array during peak traffic loads.
5.3 Antennas for Modern Small Satellites
Many examples of planar antennas application are discussed in literature, but its major appli-
cation could be the modern small satellites (MSS) which are revolutionizing the space industry
(Gao et al., 2009). They can drastically reduce the mission cost, and can make access to space
more affordable.
These modern small satellites are useful for various applications, including telecommunica-
tions, space science, Earth observation, mitigation and management of disasters (floods, fire,
earthquake, etc.), in-orbit technology verification, military applications, education, and train-
ing. Typical antenna coverages ranges from low-gain hemispherical, to medium-gain anten-
nas. The basic radiator designs used are normally helices, monopoles, patches, and patch-
excited cups (PEC), depending on frequency and range, coverage requirements, and appli-
cation. As antenna examples of small satellites are mentioned various monopole antennas,
printed inverted-F-shaped antennas (PIFAs), microstrip-patch antennas, helices, and patch-
excited cup antennas, developed for telemetry, tracking, and command in the UHF, VHF, S,
C, and X bands. These antennas are simple, cheap, easy to fabricate, and have wide radiation-
pattern coverage; the satellite thus does not need accurate control of attitude.
Universities have played an important role in satellites development, since the beginning of
space era; professors were interested in the new research area, either as academic developers
or as a part of contracts with satellite industry, but small satellites seems to be a very appro-
priate area to be working in by universities, due the few economical resources needed. As
an example we can mention universities in Mexico, creating clusters to design small satel-
lites; institutions as CICESE (Centro de Investigación Científica y de Educación Superior de
Ensenada) in north of Mexico developing transponders and the Instituto Politécnico Nacional
working with satellite structures and integration into a clean room, design of monopoles and
planar antennas for satellite applications and also exploring the capabilities of new active de-
vices as candidates for LNA amplifiers (Enciso et al., 2005). An especial mention should be
make to the Universidad Nacional Autónoma de México (UNAM) which has been working
towards the design of a femto satellite.
Other illustrative example is the University of Surrey, which has been developing modern
small satellite technology since starting its UoSAT program in 1978. UoSAT-l, developed by
Surrey, was launched in 1981. This was followed by UoSAT-2 in 1984. UoSAT-l continued to
operate for eight years, while UoSAT-2 was still operational after 18 years in orbit. During
the past 30 years, the University of Surrey’s spinoff company, Surrey Satellite Technology Ltd.
(SSTL), together with Surrey Space Centre (SSC), have successfully designed, developed and
launched 32 modern small satellites for various countries around the world. (Gao et al., 2009)
have a complete description of various small satellites, which are described in the next lines
and figures. Fig. 10 shows a photograph of the S-band microstrip-patch antenna used at SSTL;
it employs a circular microstrip patch, fed by a 50Ω probe feed at the bottom. It can operate
within a tunable frequency range of 2.0-2.5 GHz. Left-hand or right-hand circular polarization
can be achieved by using a single feed combined with patch perturbation, or a 90°microstrip
hybrid combined with a circular patch. It achieves a maximum gain of about 6.5 dBi, has a
size of 82 x 82 x 20 mm, and a mass of less than 80 g. It can operate within -20°C to +50°C, is
radiation tolerant to 50 kRad, and qualified to 50 Gs rms random vibration on three axes.
Fig. 10. An S-band patch antenna SSTL. (©(2009) IEEE)
To respond the need for single-frequency low-profile and low-weight hemispherical or near-
hemispherical antennas, working at S, C, or X band, patch-excited cup antennas were devel-
oped at RUAG Aerospace Sweden. They consist of a short cylindrical cup, with a circular
cross section and an exciter. The cup is excited using a stacked circular dual-patch element,
or a single patch. The lower patch or the single patch is fed at one point, and the patch has
two opposite perturbations for generating circular polarization. The antennas have special
features to minimize their coupling to the surrounding spacecraft environment, as this is a
common problem for low-gain antennas of this type, and it has an effect on the installed
performance. The antenna’s diameter is 60 mm for the C band antenna, and 40 mm for the
X-band antenna. The mass is less than 90 g for the C-band antenna, and less than 20 g for
the X-band antenna. They are both almost all metal antennas (which is a preferred property),
with dielectric material only in the interface connector.
Fig. 11 shows the X-band patch-excited cup antennas that can be used for the telemetry, track-
ing, and command function. Fig. 12(a) shows the S-band patch-excited cup antenna, devel-
oped at Saab Space. It consists of three patches, mounted within a thin aluminum cup with a
rim height of about a quarter wavelength. Two lower patches form a resonant cavity, allowing
broadband or double tuning. The top patch acts as a reflector that affects the illumination of
the aperture, and is used to improve the aperture efficiency. To achieve circular polarization,
the lower patch is fed in phase quadrature at four points by a stripline network. It achieves a
maximum gain of about 12 dBi. A patch-excited cup antenna development performed at Saab
Space is the update of the antenna in Figure 6, to be used for other missions; it has a radiator
tower that is modified compared to the original design. It is now an all-metal design, and has
a new feed network configuration: an isolated four-point feed design, antenna is shown in
Fig. 12(b).
Surrey also pioneered the use of GPS and global navigation satellite systems (GNSS) in space.
A GPS receiver can provide accurate position, velocity, and time for LEO satellites. For this
application, the antenna needs to be compact, low profile, able to operate at GPS frequencies
in the L1 (1.575 GHz) and L2 (1.227 GHz) bands with stable performance, and produce low
backward radiation towards the small satellite body.
Satellite Communications386
Fig. 11. An X-band patch-exited cup antenna (©(2009) IEEE).
A medium-gain antenna, shown in Fig. 13(a), was launched on the UK-DMC satellite of SSTL
for the purpose of collecting reflected GPS signals in orbit. This satellite has begun to collect
reflected signals under a variety of sea conditions, and over land and ice. The antenna is a
three-element, circularly polarized microstrip-patch array with a gain of 12 dBi. Antenna-
design challenges remain in terms of further reducing antenna size, improving the antenna’s
efficiency, multi-band (L1/L2/L5 band) operation, constant phase center, multipath mitiga-
tion, etc.
Fig. 13(b) shows the patch-excited cup antenna developed at RUAG Aerospace Sweden. It
consists of two patches placed in a circular cup. To obtain a stable antenna covering two GPS
frequency bands (Ll, L2), the bottom patch was capacitively fed by four probes and an isolated
feed network. The antenna achieved a coverage out to 80
0
in zenith angle, and low backward
radiation. The antenna’s diameter is 160 mm, and the mass is 345 g. This antenna shows how
shorted-annular-patch can achieve high-accuracy GPS/GNSS performance without compro-
mising the physical constrains.
6. Some proposals for future applications
Spacecraft development and research never ends and antenna improvements are not the ex-
ception, even thinking that some of them were designed for other applications, always is
possible to extrapolate to space applications, but antenna research and design for satellites
and spacecrafts is an area of permanent expansion. Starting with airborne applications, where
planar antennas have a permanent development, to meet the low profile and conformal chal-
lenges, is possible to extrapolate them to satellite systems. For airplanes as for satellite and
spacecrafts, an array antenna should have good isolation, high efficiency, and ease of integra-
tion, also a simple feeding-line network with lower loss and high isolation is generally desired.
Microstrip series-fed arrays have been shown to have a structure that enhances the antenna’s
efficiency. This is because the array feeding-line length is significantly reduced, compared to
(a) Cup antenna at RUAG (©(2009)
IEEE)
(b) Medium-dowlink antennas (©(2009)
IEEE)
Fig. 12. S-band patch-excited cup antenna.
(a) For the UK DMC satellite at SSTL
(©(2009) IEEE)
(b) Antennas at RUAG (©(2009) IEEE).
Fig. 13. GPS antennas.
the conventional corporate feeding-line network. A planar structure with a thin and flexible
substrate is a good choice, because it will not disturb the appearance of the aircraft, and can
be easily integrated with electronic devices for signal processing.
6.1 The Shih planar antenna
An example of a planar antenna first designed for aircrafts is the dual-frequency dual-polarized
array antenna presented by (Shih et al., 2009). It consists of a multilayer structure of two an-
tennas separated on different layers, adopted for dual-band operation, working in the S band
and X band frequencies. To reduce the array’s volume and weight, a series-fed network is
used. An ultra-thin substrate is chosen in order to make the array conformal, and the array
can be easily placed on an aircraft’s fuselage, or inside the aircraft.
Planar Antennas For Satellite Communications 387
Fig. 11. An X-band patch-exited cup antenna (©(2009) IEEE).
A medium-gain antenna, shown in Fig. 13(a), was launched on the UK-DMC satellite of SSTL
for the purpose of collecting reflected GPS signals in orbit. This satellite has begun to collect
reflected signals under a variety of sea conditions, and over land and ice. The antenna is a
three-element, circularly polarized microstrip-patch array with a gain of 12 dBi. Antenna-
design challenges remain in terms of further reducing antenna size, improving the antenna’s
efficiency, multi-band (L1/L2/L5 band) operation, constant phase center, multipath mitiga-
tion, etc.
Fig. 13(b) shows the patch-excited cup antenna developed at RUAG Aerospace Sweden. It
consists of two patches placed in a circular cup. To obtain a stable antenna covering two GPS
frequency bands (Ll, L2), the bottom patch was capacitively fed by four probes and an isolated
feed network. The antenna achieved a coverage out to 80
0
in zenith angle, and low backward
radiation. The antenna’s diameter is 160 mm, and the mass is 345 g. This antenna shows how
shorted-annular-patch can achieve high-accuracy GPS/GNSS performance without compro-
mising the physical constrains.
6. Some proposals for future applications
Spacecraft development and research never ends and antenna improvements are not the ex-
ception, even thinking that some of them were designed for other applications, always is
possible to extrapolate to space applications, but antenna research and design for satellites
and spacecrafts is an area of permanent expansion. Starting with airborne applications, where
planar antennas have a permanent development, to meet the low profile and conformal chal-
lenges, is possible to extrapolate them to satellite systems. For airplanes as for satellite and
spacecrafts, an array antenna should have good isolation, high efficiency, and ease of integra-
tion, also a simple feeding-line network with lower loss and high isolation is generally desired.
Microstrip series-fed arrays have been shown to have a structure that enhances the antenna’s
efficiency. This is because the array feeding-line length is significantly reduced, compared to
(a) Cup antenna at RUAG (©(2009)
IEEE)
(b) Medium-dowlink antennas (©(2009)
IEEE)
Fig. 12. S-band patch-excited cup antenna.
(a) For the UK DMC satellite at SSTL
(©(2009) IEEE)
(b) Antennas at RUAG (©(2009) IEEE).
Fig. 13. GPS antennas.
the conventional corporate feeding-line network. A planar structure with a thin and flexible
substrate is a good choice, because it will not disturb the appearance of the aircraft, and can
be easily integrated with electronic devices for signal processing.
6.1 The Shih planar antenna
An example of a planar antenna first designed for aircrafts is the dual-frequency dual-polarized
array antenna presented by (Shih et al., 2009). It consists of a multilayer structure of two an-
tennas separated on different layers, adopted for dual-band operation, working in the S band
and X band frequencies. To reduce the array’s volume and weight, a series-fed network is
used. An ultra-thin substrate is chosen in order to make the array conformal, and the array
can be easily placed on an aircraft’s fuselage, or inside the aircraft.
Satellite Communications388
6.1.1 S-band Array Design
The multilayer array structure for dual-band operation is shown in Fig. 14. The S-band an-
tenna elements sit on the top layer, and the X-band antennas are on the bottom layer. A foam
layer (h
2
) serves as the spacer, and is sandwiched between the two substrate layers. One of
the important design considerations for this multilayer dual-band array is that the S-band
antenna element should be nearly transparent to the X-band antenna elements. Otherwise,
the S-band element may degrade the performance of the X-band antenna. Two RTlDuroid
5880 substrates (
1
=
3
=2.2) and a foam layer (
2
= 1.06) form the multilayer structure. The
thicknesses of the substrates (h
1
and h
2
) are both only 0.13 mm. These ultra-thin and flexible
substrates make it possible for the array to be easily attached onto the aircraft’s fuselage, or
installed inside the aircraft. The foam layer has a thickness of h
2
=1.6 mm.
Fig. 14. The multilayer structure of dual-band dual polarized array antenna (©(2009) IEEE).
6.1.2 X-Band Antenna and Subarray
The X-band array uses the circular patch as its unit antenna element. The circular patches
are fed with microstrip lines at the circumferential edge, as shown in Fig. 15(a) for a single
circular patch, two microstrip feeding lines are used to feed the circular patch to generate two
orthogonally radiating TM
11
modes for dual polarized operation. Two feed points are located
at the edge of the patch, 90 ˛a away from each other, so that the coupling between these two
ports can be minimized. The port isolation also depends on the quality factor of the patch.
Increasing the substrate’s thickness decreases the isolation, therefore using thin substrates
could improve the quality of isolation.
Fig. 15(a) shows a 4 x 8 dual-polarized X-band array. The V port and the H port are the input
ports for the two orthogonal polarizations (vertical and horizontal). The array is composed
of two 4 x 4 subarrays. The corporate-fed power-divider lines split the input power at each
port to the subarrays. Within each subarray, the circular patches are configured into four 4 x 1
series-fed resonant type arrays, which make the total array compact and have less microstrip
line losses than would a purely corporate-fed type of array. An open circuit is placed after
the last patch of each 4 x 1 array. The spacing between adjacent circular-patch centers is about
one guided wavelength (λ
g
=21.5 mm at 10 GHz). This is equivalent to a 360
o
phase shift
between patches, such that the main beam points to the broadside. The power coupled to
each patch can also be controlled by adjusting the size of the individual patch to achieve a
tapered amplitude distribution for a lower-sidelobe design.
As shown in Figure Fig. 15(b), the S-band antenna elements are printed on the top substrate,
and are separated from the X-band elements by the foam layer. To reduce the blocking of
(a) X-band antenna (©(2009) IEEE) (b) S-band antenna (©(2009) IEEE)
Fig. 15. Microstrip Antenna Arrays
the radiation from the X-band elements at the bottom layer, the shape of the S band elements
has to be carefully selected. A ring configuration was a good candidate, since it uses less
metallization than an equivalent patch element. Here, a square-ring microstrip antenna is
used as the unit element of the S-band array. Because antenna elements at both frequency
bands share the same aperture, it is also preferred that the number of elements on the top
layer be as small as possible, to minimize the blocking effects.
Fig. 16. Geometry of dual antenna (©(2009) IEEE)
The stacked X-band and S-band array antennas are shown in Fig. 16. As can be seen in the
figure, the four sides of the square-ring element are laid out in such a way that they only cover
part of the feeding lines on the bottom layer, but none of the radiating elements. Unlike an or-
dinary microstrip-ring antenna that has a mean circumference equal to a guided wavelength,
the antenna proposed here has a mean circumference of about 2λ
g
(λ
g
= 82.44mm at 3 GHz).
Although the size of the proposed unit element is larger than an ordinary ring antenna, its
gain is about twice as high, because of its larger radiation-aperture area. The ring is loaded
by two gaps at two of its parallel sides, these make possible to achieve a 50 Ω input match at
the edge of the third side without using a small value of L
s2
/L
s1
. For an edge fed microstrip
ring, if a second feed line is added to the orthogonal edge, the coupling between the two
feeding ports will be high. The V-port and H-port feeds are therefore placed at two individ-
ual elements, so that the coupling between the two ports can be significantly reduced. Using
separate elements seems to increase the number of antenna elements within a given aperture.
Planar Antennas For Satellite Communications 389
6.1.1 S-band Array Design
The multilayer array structure for dual-band operation is shown in Fig. 14. The S-band an-
tenna elements sit on the top layer, and the X-band antennas are on the bottom layer. A foam
layer (h
2
) serves as the spacer, and is sandwiched between the two substrate layers. One of
the important design considerations for this multilayer dual-band array is that the S-band
antenna element should be nearly transparent to the X-band antenna elements. Otherwise,
the S-band element may degrade the performance of the X-band antenna. Two RTlDuroid
5880 substrates (
1
=
3
=2.2) and a foam layer (
2
= 1.06) form the multilayer structure. The
thicknesses of the substrates (h
1
and h
2
) are both only 0.13 mm. These ultra-thin and flexible
substrates make it possible for the array to be easily attached onto the aircraft’s fuselage, or
installed inside the aircraft. The foam layer has a thickness of h
2
=1.6 mm.
Fig. 14. The multilayer structure of dual-band dual polarized array antenna (©(2009) IEEE).
6.1.2 X-Band Antenna and Subarray
The X-band array uses the circular patch as its unit antenna element. The circular patches
are fed with microstrip lines at the circumferential edge, as shown in Fig. 15(a) for a single
circular patch, two microstrip feeding lines are used to feed the circular patch to generate two
orthogonally radiating TM
11
modes for dual polarized operation. Two feed points are located
at the edge of the patch, 90 ˛a away from each other, so that the coupling between these two
ports can be minimized. The port isolation also depends on the quality factor of the patch.
Increasing the substrate’s thickness decreases the isolation, therefore using thin substrates
could improve the quality of isolation.
Fig. 15(a) shows a 4 x 8 dual-polarized X-band array. The V port and the H port are the input
ports for the two orthogonal polarizations (vertical and horizontal). The array is composed
of two 4 x 4 subarrays. The corporate-fed power-divider lines split the input power at each
port to the subarrays. Within each subarray, the circular patches are configured into four 4 x 1
series-fed resonant type arrays, which make the total array compact and have less microstrip
line losses than would a purely corporate-fed type of array. An open circuit is placed after
the last patch of each 4 x 1 array. The spacing between adjacent circular-patch centers is about
one guided wavelength (λ
g
=21.5 mm at 10 GHz). This is equivalent to a 360
o
phase shift
between patches, such that the main beam points to the broadside. The power coupled to
each patch can also be controlled by adjusting the size of the individual patch to achieve a
tapered amplitude distribution for a lower-sidelobe design.
As shown in Figure Fig. 15(b), the S-band antenna elements are printed on the top substrate,
and are separated from the X-band elements by the foam layer. To reduce the blocking of
(a) X-band antenna (©(2009) IEEE) (b) S-band antenna (©(2009) IEEE)
Fig. 15. Microstrip Antenna Arrays
the radiation from the X-band elements at the bottom layer, the shape of the S band elements
has to be carefully selected. A ring configuration was a good candidate, since it uses less
metallization than an equivalent patch element. Here, a square-ring microstrip antenna is
used as the unit element of the S-band array. Because antenna elements at both frequency
bands share the same aperture, it is also preferred that the number of elements on the top
layer be as small as possible, to minimize the blocking effects.
Fig. 16. Geometry of dual antenna (©(2009) IEEE)
The stacked X-band and S-band array antennas are shown in Fig. 16. As can be seen in the
figure, the four sides of the square-ring element are laid out in such a way that they only cover
part of the feeding lines on the bottom layer, but none of the radiating elements. Unlike an or-
dinary microstrip-ring antenna that has a mean circumference equal to a guided wavelength,
the antenna proposed here has a mean circumference of about 2λ
g
(λ
g
= 82.44mm at 3 GHz).
Although the size of the proposed unit element is larger than an ordinary ring antenna, its
gain is about twice as high, because of its larger radiation-aperture area. The ring is loaded
by two gaps at two of its parallel sides, these make possible to achieve a 50 Ω input match at
the edge of the third side without using a small value of L
s2
/L
s1
. For an edge fed microstrip
ring, if a second feed line is added to the orthogonal edge, the coupling between the two
feeding ports will be high. The V-port and H-port feeds are therefore placed at two individ-
ual elements, so that the coupling between the two ports can be significantly reduced. Using
separate elements seems to increase the number of antenna elements within a given aperture.
Satellite Communications390
However, this harmful effect could be minimized by reducing the number of elements with
the use of larger-sized microstrip rings.
6.2 The Cross Antenna
The cross antenna is another possibility of use in spatial applications, it is a traveling wave
antenna with circular polarization formed by conductors over a ground plane, proposed by
(Roederer, 1990). Antenna can be constructed as a wire or printed antenna. Roederer’s paper
do not describe completely the antenna but it was reanalyzed by authors (Sosa-Pedroza et al.,
2006).
The cross antenna is a printed structure of medium gain and circular polarization, consisting
of a conductor or microstrip over a ground plane following the contour of a cross with four or
more arms and a diameter of about 1.5 wavelengths. The antenna is feeding on one end by a
coaxial line and finished on the other end by a load impedance, considering behavior of trav-
elling wave. Even the antenna was primarily designed for applications in L Band (1500 MHz)
mobile communications, the design and experimental characterization was made at 10 GHz
and for an eight arms antenna besides original four arms antenna, showing the possibility of
extrapolation for other applications as satellite communications. For the cross antenna, feed
connector and load position define the right or left circular polarization; it can be used as a
unique radiator or as a part of an array, a proposal is that could be used as primary antenna
for parabolic reflector with wide focal length and diameter relationship. The main advantage
of the cross antenna is its gain (12-15 dBi) compared with its size and weight, ideal for space
communications.
Fig. 17. The cross wire antenna
Arm length λ
e f f
Arm width 0.25λ
e f f
Cross diameter 2.5λ
e f f
Wire diameter 0.01λ
e f f
Table 2. Geometric characteristics of cross antenna
The power at the end of the antenna is controlled by the load impedance and is limited to
a small percentage, changing the height of the conductor over the ground plane (typically
λ
e f f
/20 to λ
e f f
/4) which also affects the axial rate. The bandwidth of the cross antenna is
around 5% depending on the number of arms. Fig. 17 shows photograph of a 8 arm radiator,
(a) Gain (b) Radiation Pattern
Fig. 18. Electrical characteristics of the Cross antenna
which was constructed both, as a microstrip antenna using a 3.6 mm thick RTDuroid with
2.3 of
e f f
=2.3 and as a wire antenna using copper wire, supported over the ground plane
by small Teflon fragments giving flexibility to move up the structure to analyze the effect of
height over the ground plane. Table 2 shows dimensions of the antenna. On the other hand
Fig. 18(a) and Fig. 18(b) show the gain and the radiation pattern respectively, for one of the
antennas.
6.3 Rhombic cross antenna
A variation over cross antenna is a four arm rhombic cross antenna (Lucas et al., 2008), it is
also a medium gain and circular polarization structure made of a conductor or strip line over a
ground plane, following a rhombic contour of four branches. One end is connected to the feed
line and the other is grounded by a load impedance. Antenna was analyzed using Method of
Moments and constructed for experimental analysis using both, a 12 AWG wire over a ground
plane and printed as a microstrip structure working in 4.2 GHz. The rhombic antenna shows
a better performance compared with the four arms Roederer’s antenna, with almost 15 dB
gain and 1.4 dB for axial ratio. The antenna can be used in mobile communication or as pri-
mary radiator of parabolic reflectors, when circular polarization is needed. The construction
repeatability is very easy as well the facility to obtain 15 dB gain in a very small antenna.
A 0.430λ
e f f
B 0.276λ
e f f
C 0.3911λ
e f f
D 1.4112λ
e f f
Table 3. Dimensions of rhombic antenna
The rhombic cross antenna geometry is shown in Fig. 19(a), and antenna dimensions as func-
tion of effective wavelength, are given in Table 3.
There were constructed several antennas, both wire (air dielectric) and strip line (fiber glass
dielectric), the last one is shown in Fig. 19(b); wire antenna uses Teflon supports over the
Planar Antennas For Satellite Communications 391
However, this harmful effect could be minimized by reducing the number of elements with
the use of larger-sized microstrip rings.
6.2 The Cross Antenna
The cross antenna is another possibility of use in spatial applications, it is a traveling wave
antenna with circular polarization formed by conductors over a ground plane, proposed by
(Roederer, 1990). Antenna can be constructed as a wire or printed antenna. Roederer’s paper
do not describe completely the antenna but it was reanalyzed by authors (Sosa-Pedroza et al.,
2006).
The cross antenna is a printed structure of medium gain and circular polarization, consisting
of a conductor or microstrip over a ground plane following the contour of a cross with four or
more arms and a diameter of about 1.5 wavelengths. The antenna is feeding on one end by a
coaxial line and finished on the other end by a load impedance, considering behavior of trav-
elling wave. Even the antenna was primarily designed for applications in L Band (1500 MHz)
mobile communications, the design and experimental characterization was made at 10 GHz
and for an eight arms antenna besides original four arms antenna, showing the possibility of
extrapolation for other applications as satellite communications. For the cross antenna, feed
connector and load position define the right or left circular polarization; it can be used as a
unique radiator or as a part of an array, a proposal is that could be used as primary antenna
for parabolic reflector with wide focal length and diameter relationship. The main advantage
of the cross antenna is its gain (12-15 dBi) compared with its size and weight, ideal for space
communications.
Fig. 17. The cross wire antenna
Arm length λ
e f f
Arm width 0.25λ
e f f
Cross diameter 2.5λ
e f f
Wire diameter 0.01λ
e f f
Table 2. Geometric characteristics of cross antenna
The power at the end of the antenna is controlled by the load impedance and is limited to
a small percentage, changing the height of the conductor over the ground plane (typically
λ
e f f
/20 to λ
e f f
/4) which also affects the axial rate. The bandwidth of the cross antenna is
around 5% depending on the number of arms. Fig. 17 shows photograph of a 8 arm radiator,
(a) Gain (b) Radiation Pattern
Fig. 18. Electrical characteristics of the Cross antenna
which was constructed both, as a microstrip antenna using a 3.6 mm thick RTDuroid with
2.3 of
e f f
=2.3 and as a wire antenna using copper wire, supported over the ground plane
by small Teflon fragments giving flexibility to move up the structure to analyze the effect of
height over the ground plane. Table 2 shows dimensions of the antenna. On the other hand
Fig. 18(a) and Fig. 18(b) show the gain and the radiation pattern respectively, for one of the
antennas.
6.3 Rhombic cross antenna
A variation over cross antenna is a four arm rhombic cross antenna (Lucas et al., 2008), it is
also a medium gain and circular polarization structure made of a conductor or strip line over a
ground plane, following a rhombic contour of four branches. One end is connected to the feed
line and the other is grounded by a load impedance. Antenna was analyzed using Method of
Moments and constructed for experimental analysis using both, a 12 AWG wire over a ground
plane and printed as a microstrip structure working in 4.2 GHz. The rhombic antenna shows
a better performance compared with the four arms Roederer’s antenna, with almost 15 dB
gain and 1.4 dB for axial ratio. The antenna can be used in mobile communication or as pri-
mary radiator of parabolic reflectors, when circular polarization is needed. The construction
repeatability is very easy as well the facility to obtain 15 dB gain in a very small antenna.
A 0.430λ
e f f
B 0.276λ
e f f
C 0.3911λ
e f f
D 1.4112λ
e f f
Table 3. Dimensions of rhombic antenna
The rhombic cross antenna geometry is shown in Fig. 19(a), and antenna dimensions as func-
tion of effective wavelength, are given in Table 3.
There were constructed several antennas, both wire (air dielectric) and strip line (fiber glass
dielectric), the last one is shown in Fig. 19(b); wire antenna uses Teflon supports over the
Satellite Communications392
(a) Scheme of rhombic antenna (b) Microstrip antenna
Fig. 19. Physical characteristics of Rhombic Antenna
(a) Rhombic antenna gain (b) Rhombic antenna field pat-
tern
Fig. 20. Physical characteristics of Rhombic Antenna
ground plane, giving flexibility to change the height over it. Results for gain and field pattern
are shown in Fig. 20(a) and Fig. 20(b) respectively, for a 50 Ω load impedance; the feed
impedance is Z
= 38.6 − j56.8Ω for 2.4 GHz:
Even the proposed antennas have not been used yet for spatial applications, their profiles can
match for it, in frequencies ranging from L band, S band, commercial C band or X band, either
as single structures or as arrays.
7. References
Agrawal, P. K., Bailey M. C. (1977) An Analysis Technique for Microstrip Antennas. IEEE Trans.
on Antennas and Propagation AP-25, pp.756-759
Balanis, C.(2005).Antenna Theory Analysis and Design, Wiley-Interscience ISBN 0-471-66782-X
Barrera-Figueroa, V.; Sosa-Pedroza, J.; Lopez-Bonilla, J. (2007). Numerical approach to King’s
analytical study for circular loop antenna, Journal of Discrete Mathematical Sciences &
Cryptography, Vol. 10, No. 1 February 2007, pp 82-92.
Barrera-Figueroa, V.; Sosa-Pedroza, J.; Lopez-Bomilla, J. (2009) Pocklington Equation via circuit
theory Apeiron, on line Journal, Vol 16, No. 1.
Chang, K.(1989). Handbook of Microwave and Optical Components. Vol. 1, John Wiley & Sons,
New York, USA
Derneryd, A.,G.(1975). Linear Polarized Microstrip Antennas. IEEE Trans. on Antennas and
Propagation, AP-24, pp. 845-850.
Deschamps, G. A. (1953) Microstrip microwave antennas. 3rd USAF Symposium on Antennas.
Enciso-Agilar, M.; Crozat, P.; Hackbarth, T; Herzog, H,; Aniel F.(2005). Microwave Noise Perfor-
mance and Modeling of SiGe-Based HFETs. IEEE Trans. on Electron. Dev., Vol. 52, No.
11, November 2005
Gao S.; Clark K.; Unwin M.; Zackrisson J.; Shiroma W.A.; Akagi J.M.; Maynard K.; Garner P.;
Boccia L.; Amendola G.; Massa G.; C. Underwood; Brenchley M.; Pointer M.; Sweet-
ing M.N. (2009). Antennas for Modern Small Satellites. IEEE Antennas and Propagation
Magazine (August 2009), Vol. 51 No.4, pp. 40-56. IEEE. ISSN 1045 9243/2009.
Greig D., D.; Engleman H., F. (1952) Microstrip a new transmission technique for the kilo-
megacycle range. Proceedings of IRE, No. 40.
Gupta,K.C.; Benalla, A. eds. Microstrip Antenna Design. Artech House, Norwood MA, USA
Harrington, R.F.,(1961). Time-Harmonic Electromagnetic Waves, McGraw-Hil, New York, USA
Harrington,F.,R., Matrix Methods for Field Problems, Proc. IEEE, Vol. 55, No. 2, Feb. 1967.
Roger F. Harrington, (1992). Field Computation by Method of Moments, IEEE Press Series on
Electromagnetic Waves, ISBN 0 7803 1014 4, Piscataway, NJ, USA.
Hirasawa, K.; Haneishi, M. (1994). Analysis, Design and Measurement of Small and Low Profile
Antennas, Artech House, ISBN 0-89006-486-5,USA
Howell, J., Q.(1975) Microstrip Antennas. IEEE IEEE Trans. on Antennas and Propagation, vol.
AP22 , pp. 74-78.
Itoh, T.; Menzel,W. (1989) A Full Wave Analysis Method for Open Microstrip Structures. IEEE
Trans. on Antennas and Propagation AP-29 , 63-68.
James, J.R., Hall, P. S. (1989). Handbook of Microstrip Antennas, Vol 1. Peregrinus Ltd, IEE Elec-
tromagnetic Waves Series, ISBN 0 86341 150 9 Peter, London United Kingdom.
James, J. R.; Hall, P., S.; and Wood, C. (1981). Microstrip antenna theory and design. IEE Peter
Peregrinus.
Kraus, J.,D.; Marhefka, R.,J. (2002) Antennas 3rd. Edition, ISBN 0 07 232103 2, New York NY
USA.
Lee H.,F.; Chen, W. (1997). Advances in Microstrip and Printed Antennas. John Wiley & Sons,
New York, USA
Long, S., A.; Shen, L.,C.; & Morel,P.,B. (1978). A Theory of the Circular Disk Printed Circuit An-
tenna. Proc IEE, Pt. H, Vol. 125, October 1978, pp. 925-928
Lucas-Bravo A., Sosa-Pedroza J., Barrera-Figueroa V. (2008). Experimental and numerical re-
sults of a rhombic cross antenna. 5o Congreso Internacional de Ingeniería Electromecánica
y de Sistemas, pp. 1178-1182. Mexico D.F., November 2008.
Thomas, A., Milligan.(2005). Modern Antenna Design. John Wiley & Sons. New Yersey, USA
Munson, R., E. (1974). “Conformal Microstrip Antennas and Microstrip Phased Arrays” IEEE
Trans. Antennas and Propagation, Vol. AP-22, January 1974, pp 74-78, ISSN 0018-926X
Pozar,D.,M. (1982) Input impedance and mutual coupling of rectangular microstrip antennas. IEEE
Trans Antennas Propagatation. AP-30, 1191-1196.
Pozar,D.M. (2005). Microwave Engineering, John Wiley & Sons, USA
Planar Antennas For Satellite Communications 393
(a) Scheme of rhombic antenna (b) Microstrip antenna
Fig. 19. Physical characteristics of Rhombic Antenna
(a) Rhombic antenna gain (b) Rhombic antenna field pat-
tern
Fig. 20. Physical characteristics of Rhombic Antenna
ground plane, giving flexibility to change the height over it. Results for gain and field pattern
are shown in Fig. 20(a) and Fig. 20(b) respectively, for a 50 Ω load impedance; the feed
impedance is Z
= 38.6 − j56.8Ω for 2.4 GHz:
Even the proposed antennas have not been used yet for spatial applications, their profiles can
match for it, in frequencies ranging from L band, S band, commercial C band or X band, either
as single structures or as arrays.
7. References
Agrawal, P. K., Bailey M. C. (1977) An Analysis Technique for Microstrip Antennas. IEEE Trans.
on Antennas and Propagation AP-25, pp.756-759
Balanis, C.(2005).Antenna Theory Analysis and Design, Wiley-Interscience ISBN 0-471-66782-X
Barrera-Figueroa, V.; Sosa-Pedroza, J.; Lopez-Bonilla, J. (2007). Numerical approach to King’s
analytical study for circular loop antenna, Journal of Discrete Mathematical Sciences &
Cryptography, Vol. 10, No. 1 February 2007, pp 82-92.
Barrera-Figueroa, V.; Sosa-Pedroza, J.; Lopez-Bomilla, J. (2009) Pocklington Equation via circuit
theory Apeiron, on line Journal, Vol 16, No. 1.
Chang, K.(1989). Handbook of Microwave and Optical Components. Vol. 1, John Wiley & Sons,
New York, USA
Derneryd, A.,G.(1975). Linear Polarized Microstrip Antennas. IEEE Trans. on Antennas and
Propagation, AP-24, pp. 845-850.
Deschamps, G. A. (1953) Microstrip microwave antennas. 3rd USAF Symposium on Antennas.
Enciso-Agilar, M.; Crozat, P.; Hackbarth, T; Herzog, H,; Aniel F.(2005). Microwave Noise Perfor-
mance and Modeling of SiGe-Based HFETs. IEEE Trans. on Electron. Dev., Vol. 52, No.
11, November 2005
Gao S.; Clark K.; Unwin M.; Zackrisson J.; Shiroma W.A.; Akagi J.M.; Maynard K.; Garner P.;
Boccia L.; Amendola G.; Massa G.; C. Underwood; Brenchley M.; Pointer M.; Sweet-
ing M.N. (2009). Antennas for Modern Small Satellites. IEEE Antennas and Propagation
Magazine (August 2009), Vol. 51 No.4, pp. 40-56. IEEE. ISSN 1045 9243/2009.
Greig D., D.; Engleman H., F. (1952) Microstrip a new transmission technique for the kilo-
megacycle range. Proceedings of IRE, No. 40.
Gupta,K.C.; Benalla, A. eds. Microstrip Antenna Design. Artech House, Norwood MA, USA
Harrington, R.F.,(1961). Time-Harmonic Electromagnetic Waves, McGraw-Hil, New York, USA
Harrington,F.,R., Matrix Methods for Field Problems, Proc. IEEE, Vol. 55, No. 2, Feb. 1967.
Roger F. Harrington, (1992). Field Computation by Method of Moments, IEEE Press Series on
Electromagnetic Waves, ISBN 0 7803 1014 4, Piscataway, NJ, USA.
Hirasawa, K.; Haneishi, M. (1994). Analysis, Design and Measurement of Small and Low Profile
Antennas, Artech House, ISBN 0-89006-486-5,USA
Howell, J., Q.(1975) Microstrip Antennas. IEEE IEEE Trans. on Antennas and Propagation, vol.
AP22 , pp. 74-78.
Itoh, T.; Menzel,W. (1989) A Full Wave Analysis Method for Open Microstrip Structures. IEEE
Trans. on Antennas and Propagation AP-29 , 63-68.
James, J.R., Hall, P. S. (1989). Handbook of Microstrip Antennas, Vol 1. Peregrinus Ltd, IEE Elec-
tromagnetic Waves Series, ISBN 0 86341 150 9 Peter, London United Kingdom.
James, J. R.; Hall, P., S.; and Wood, C. (1981). Microstrip antenna theory and design. IEE Peter
Peregrinus.
Kraus, J.,D.; Marhefka, R.,J. (2002) Antennas 3rd. Edition, ISBN 0 07 232103 2, New York NY
USA.
Lee H.,F.; Chen, W. (1997). Advances in Microstrip and Printed Antennas. John Wiley & Sons,
New York, USA
Long, S., A.; Shen, L.,C.; & Morel,P.,B. (1978). A Theory of the Circular Disk Printed Circuit An-
tenna. Proc IEE, Pt. H, Vol. 125, October 1978, pp. 925-928
Lucas-Bravo A., Sosa-Pedroza J., Barrera-Figueroa V. (2008). Experimental and numerical re-
sults of a rhombic cross antenna. 5o Congreso Internacional de Ingeniería Electromecánica
y de Sistemas, pp. 1178-1182. Mexico D.F., November 2008.
Thomas, A., Milligan.(2005). Modern Antenna Design. John Wiley & Sons. New Yersey, USA
Munson, R., E. (1974). “Conformal Microstrip Antennas and Microstrip Phased Arrays” IEEE
Trans. Antennas and Propagation, Vol. AP-22, January 1974, pp 74-78, ISSN 0018-926X
Pozar,D.,M. (1982) Input impedance and mutual coupling of rectangular microstrip antennas. IEEE
Trans Antennas Propagatation. AP-30, 1191-1196.
Pozar,D.M. (2005). Microwave Engineering, John Wiley & Sons, USA
Satellite Communications394
Reineix, A.; Jecko, B. (1989) Analysis of Microstrip Patch Antennas Using Finite-Diference Time
Domain Method. IEEE Trans. on Antennas and Propagation AP-37 pp. 1361-1369.
Richards,W.,F.; Lo,Y., T.; Harrison, D.,D. (1979) An improved theory for microstrip antennas .Elec-
tron. Letters, Vol 15 , 42-44.
Richards,W.,F.; Lo,Y., T.; Harrison, D.,D. (1981) An improved theory for microstrip antennas and
applications. IEEE Trans. on Antennas and Propagation AP-29 , 38-46.
Roederer A. (1990). The Cross Antenna: a New Low Profile Circularly Polarized Radiator. IEEE
Transactions on Antennas and Propagation, Vol. 38, no. 5, May 1990.
Schuss J. J., Upton J., Myers B., Sikina T., Rohwer A., Makridakas P., Francois R., Wardle L.,
and Smith R. (1999). The IRIDIUM Main Mission Antenna Concept. IEEE Transactions
on Antennas and Propagation, Vol. 47, No. 3, March 1999, pp. 416-424, IEEE, ISSN
0018 926X/99
Sheen, D.,M.; Ali, S.,M.;Abouzahra M.,D.; Kong J.,A. (1990). Application of Three-Dimensional
Finite-Difference Time-Domain Method to the Analysis of Planar Microstrip Circuits. IEEE
Trans. on Microwave Theo. and Tech. vol. 38, pp. 849-857
Shih-Hsun H., Yu-Jiun R., and Kai C. (2009). A dual-Polarized Planar-Array Antenna for S-Band
and X-Band Airbone Applications. IEEE Antennas and Propagation Magazine, Vol. 51,
No.4, August 2009, pp.70-78
Sosa-Pedroza J., Lucas-Bravo A., Lopez-Bonilla J. (2006). Numerical and Experimental Anal-
ysis for a Cross Antenna. International Caribbean Congress on Devices, Circuits and Sys-
tems pp 207-211, ISBN: 1 4244 0042 2, Playa del Carmen, Quintana Roo, Mexico, April
2006.
Sosa-Pedroza, J.; Enciso-Aguilar, M.; Benavides-Cruz, M. (2008). A 9 slots antenna designed
by Chebyshev technique and modeled by Finite Difference Time Domain, Proc. of
7th International Caribean Conference on Devices Circuits and Systems, Cancun Quintana
Roo, Mexico, April 2008, IEEE.
Sosa-Pedroza, J., Barrera-Figueroa,V., Lopez-Bonilla, J. Equidistant and non-equidistant sam-
pling for method of moments applied to Pocklington Equation. The 18th Annual IEEE
International Symposium on Personal, Indoor and Mobile Radio Communications, Cancun
Mexico, 2007.
Sosa-Pedroza J.; Enciso-Aguilar, M.; Benavides-Cruz, M.; Nieto-Rodríguez, M.; Galaz-Larios,
M. A parametric analysis of perfect matched layer model of Finite Difference Time
Domain Method, Proc. of PIERS 2009, Moscow, Russia.
Vasylchenko, A., Schols, Y., De Raedt , W., and Vandenbosch, G. A. E. Quality Assessment of
Computational Techniques and Software Tools for Planar-Antenna Analysis, IEEE Anten-
nas and Propagation Magazine, Vol. 51, No.1, February 2009
Volakis, J.,L.; Chatterjee, A.; and Kempel, L.,C. (1998). Finite element method for electromagnetics
IEEE Press, Chap. 7, 1998.
www.satmex.com. (2010)
Yee, K. S (1966). Numerical solution of initial boundary value problem involving Maxwell’s equations
in isotropic media. IEEE Trans. on Antennas and Propagation, vol. 14, pp. 302-307.
Power and Spectral Efcient Multiuser Broadband Wireless Communication System 395
Power and Spectral Efcient Multiuser Broadband Wireless
Communication System
Santi P. Maity
1
Power and Spectral Efficient Multiuser
Broadband Wireless Communication System
Santi P. Maity
Bengal Engineering & Science University, Shibpur
India
1. Introduction
Communication Satellite plays significant role in long distance broadband signal transmis-
sion in recent times. Development of an efficient high data rate communication system for
multiusers becomes important and challenging. To meet ever-increasing demand for broad-
band wireless communications, a key issue that should be coped with is the scarcity of power
and spectral bandwidth. In the conventional communication scenario, supporting ubiquitous
users with high quality data communication services requires huge bandwidth. However,
since the spectrum of nowadays is a very costly resource, further bandwidth expansion is
impracticable. Thus, the use of efficient multiple access is critical. Moreover, for a given
limited bandwidth and limited number of antennas, the only option that can increase data
rate is to increase transmit power as suggested by Shannon channel capacity theorem. There-
fore, development of power and bandwidth efficient coding, modulation, and multiple-access
techniques is essential for the future wireless communication systems implemented through
Satellite link.
Considering the above issues, this chapter discusses a new communication system for Satel-
lite system that can achieve high power and spectral efficiency in broadband wireless com-
munication. To achieve the goal, development of a new and complete communication system
with high user capacity and variable data rate become essential. The system includes multi-
carrier code division multiple access (MC-CDMA) with peak-to-average power ratio (PAPR)
reduction using channel coding, optimization in MC-CDMA, estimation of wireless channel
condition and MC-DMA with multi-user detection (MUD). The chapter proposal focuses on
different aspects for different part of a communication system, namely PAPR reduction in
transmitter, channel estimation for design of adaptive and optimized system, multiuser de-
tection at the receiver for increase in user capacity. The different issues are described under
four broad subheadings. Prior to that a brief literature review on the above issues are also
presented.
The organization of the chapter is as follows: Section 2 presents literature review, while pro-
posed system model is described in Section 3. Design of power and spectral efficient system is
described in Section 4. Performance evaluation of the system is presented in Section 5, while
conclusions and scope of future works are highlighted in Section 6.
18
Satellite Communications396
2. Literature Review
In this section, we present a brief literature review related to PAPR reduction, multiuser de-
tection in CDMA, channel estimation and optimization in CDMA/MC-CDMA system. The
objective of this review is to discuss the merits and the limitations of the existing works, scope
of the present work and finally to compare the performance of this work with respect to the
related existing works.
A growing number of techniques have been proposed in the recent literature to alleviate
power efficiency problem in multicarrier system through the development of PAPR reduc-
tion methods. The approaches include simplest filtering and clipping (Ochiai & Ima; 2000),
partial transmit sequence (PTS) (Lim et al; 2006), selective mapping (Yoo; 2006) to the sophis-
ticated trellis shaping approach (Ochia; 2004). Ochiai et al (Ochia; 2004) propose a new trellis
shaping design based on recursive minimization of the autocorrelation sidelobes for reducing
PAPR of the bandlimited orthogonal frequency division multiplexing (OFDM) signals. The
exponentially increasing complexity of the PTS scheme prevents its use for MC-CDMA. Kang
et al. (Kang et al; 2005) propose an efficient PTS scheme through phase factor optimization to
reduce the complexity. Natarajan et al (Natarajan; 2004) address signal compactness issues in
MC-CDMA employing CI codes using the measure of crest factors.
Literature on multiuser detection in CDMA is quite rich. The optimum multiuser detector
proposed in (Vedu; 1986) achieves significant performance improvement relative to single
user receiver but the computational complexity increases exponentially with the number of
users. This has motivated the use of low complexity linear (Lupas & Vedu; 1989) and decision
driven suboptimal multiuser detection techniques. To overcome the disadvantage intrinsic to
the total parallel interference cancelation (PIC), some modified versions like partial parallel
interference canceling (Divsalar et al; 1989) and linear parallel interference cancelation tech-
nique (Kim & Lee; 2001 ) have been proposed. Parallel interference weighted canceler has
been proposed in (Xiao & Liang; 1999) to mitigate the degrading effects of unreliable inter-
ference estimation. Two variants of PIC known as threshold PIC and block PIC have been
proposed in (Thippavajjula & Natarajan; 2004) for synchronous CI/MCCDMA uplink. Block
PIC is shown to provide performance gain relative to conventional PIC. Maity et al (Maity at
al; 2008a) further improves bit error rate (BER) performance of diversity assisted block PIC
using genetic algorithms.
A growing number of techniques have been proposed in the recent literature to estimate wire-
less channel parameters. Sgraja et al (Sgraja & Linder; 2003) propose an algorithm to estimate
the whole channel matrix using Wiener filtering. Such an estimator requires a Wiener filter, a
multiplication operation for each element of the channel matrix and matrix inversion, which
increases the complexity of the receiver for large number of sub-carriers. In some systems,
a known training sequence is sent by the transmitter and a training algorithm is performed
by the receiver on the observed channel output and the known input to estimate the chan-
nel (Chow et al; 1991), (Ziegler & Cioffi; 1992) The deterministic least squares (DLS) channel
identification algorithm in (Ziegler & Cioffi; 1992) is such a simple but widely used training
approach. However, it is not suited for time varying system. In (Wang & Ray; 1999), authors
propose an adaptive channel estimation algorithm using the cyclic prefix. This algorithm can
adaptively track the channel variation without additional training sequences.
In (Choi et al; 2001), time-domain channel estimation followed by symbol detection based on
zero forcing (ZF) and minimum mean square error (MMSE) criterion have been proposed.
Pilot based channel estimation is also widely used in many algorithms. The most common
pilot based channel estimation scheme is the least square (LS) method of channel estimation
(Coleri et al; 2002), (Schramm et al; 1998). Blind adaptive channel estimation, based on least
mean square (LMS) for OFDM communication, is proposed in (Doukopoulos & Moustakides;
2004). Kalman filter is also used for channel estimation in (Gupta & Mehra; 2007). Finite affine
projection (FAP) algorithm is used to estimate the channel response for OFDM system in (Gao
et al; 2007). Gao et al (Gao et al; 2007) propose an efficient channel estimation for multi-
ple input multiple output (MIMO) single-carrier block transmission with dual cyclic timeslot
structure. An optimal channel estimation is then investigated in the minimal mean square
error (MMSE) sense on the time slot basis.
This channel state information (CSI) is exploited to design optimized system and several
such algorithms for CDMA and MC-CDMA systems are reported in literature. The opti-
mized systems include adaptive algorithm to minimize the total transmitted power (Lok
& Wong; 2000), signal-to-interference ratio (SIR) balanced optimum power control in CDMA
(Wu; 1999), joint optimization of spreading codes and a utility based power control (Reynolds
& Wang; 2003), joint rate and power control (Kim; 1999), joint transmitter-receiver optimiza-
tion using multiuser detection and resource allocation for energy efficiency in wireless CDMA
networks (Buzzi & Poor; 2008), using transmitter power control, receiver array processing
and multiuser detection (Seo & Yang,2006) etc. The objective of the optimized methods, in
general, is to minimize transmit power and maximize per user’s data transmission rate.
3. Proposed System
MC-CDMA system was first proposed in (Yee; 1993) and is a combination of CDMA and
OFDM with the spreading codes applied in frequency domain. We use carrier interferometry
(CI) code as spreading code. Interferometry, a classical method in experimental physics, refers
to the study of interference patterns resulting from the superpositioning of waves. CI codes of
length N supports N users orthogonally and then, as system demand increases, codes can be
selected to accommodate upto addition N-1 users pseudo-orthogonaly. Additionally, there is
no restriction on the length N of the CI code (i.e. N
∈ I), making it more robust to the diverse
requirements of wireless environments. Since the present MC-CDMA system employs CI code
as spreading code, this multiple access scheme is called as CI/MC-CDMA system. In other
words, the CI/MC-CDMA is an MC-CDMA scheme employing complex carrier interferom-
etry spreading codes. Assuming that there are K users and N subcarriers in the MC-CDMA
system, the CI code for the k-th user
(1 ≤ k ≤ K) is given by (Natarajan et al; 2001):
[1, e
j∆
θ
k
, e
j(N−1)∆
θ
k
] where ∆θ
k
= 2π.k/N.
In this chapter, we have discussed the operation and performance of a newly developed
CI/MC-CDMA model which is a variation that is discussed in (Natarajan et al; 2001). The
system proposed here is capable of supporting high capacity with reduction in PAPR as well
as low BER values at the receiver. Therefore, we present a brief review of the model in (Natara-
jan et al; 2001) followed by our new model.
3.1 Transmitter Model
In CI/MC-CDMA transmitter (Natarajan et al; 2001), the incoming data a
k
[n] for the k-th user,
is transmitted over N narrow-band sub-carriers each multiplied with an element of the k-th
user spreading code. Binary phase shift keying (BPSK) modulation is assumed, i.e. a
k
[n] =
±
1, where a
k
[n] represents n-th bit of k-th user. The transmitted signal corresponding to n-th
bit of the incoming data is given by
Power and Spectral Efcient Multiuser Broadband Wireless Communication System 397
2. Literature Review
In this section, we present a brief literature review related to PAPR reduction, multiuser de-
tection in CDMA, channel estimation and optimization in CDMA/MC-CDMA system. The
objective of this review is to discuss the merits and the limitations of the existing works, scope
of the present work and finally to compare the performance of this work with respect to the
related existing works.
A growing number of techniques have been proposed in the recent literature to alleviate
power efficiency problem in multicarrier system through the development of PAPR reduc-
tion methods. The approaches include simplest filtering and clipping (Ochiai & Ima; 2000),
partial transmit sequence (PTS) (Lim et al; 2006), selective mapping (Yoo; 2006) to the sophis-
ticated trellis shaping approach (Ochia; 2004). Ochiai et al (Ochia; 2004) propose a new trellis
shaping design based on recursive minimization of the autocorrelation sidelobes for reducing
PAPR of the bandlimited orthogonal frequency division multiplexing (OFDM) signals. The
exponentially increasing complexity of the PTS scheme prevents its use for MC-CDMA. Kang
et al. (Kang et al; 2005) propose an efficient PTS scheme through phase factor optimization to
reduce the complexity. Natarajan et al (Natarajan; 2004) address signal compactness issues in
MC-CDMA employing CI codes using the measure of crest factors.
Literature on multiuser detection in CDMA is quite rich. The optimum multiuser detector
proposed in (Vedu; 1986) achieves significant performance improvement relative to single
user receiver but the computational complexity increases exponentially with the number of
users. This has motivated the use of low complexity linear (Lupas & Vedu; 1989) and decision
driven suboptimal multiuser detection techniques. To overcome the disadvantage intrinsic to
the total parallel interference cancelation (PIC), some modified versions like partial parallel
interference canceling (Divsalar et al; 1989) and linear parallel interference cancelation tech-
nique (Kim & Lee; 2001 ) have been proposed. Parallel interference weighted canceler has
been proposed in (Xiao & Liang; 1999) to mitigate the degrading effects of unreliable inter-
ference estimation. Two variants of PIC known as threshold PIC and block PIC have been
proposed in (Thippavajjula & Natarajan; 2004) for synchronous CI/MCCDMA uplink. Block
PIC is shown to provide performance gain relative to conventional PIC. Maity et al (Maity at
al; 2008a) further improves bit error rate (BER) performance of diversity assisted block PIC
using genetic algorithms.
A growing number of techniques have been proposed in the recent literature to estimate wire-
less channel parameters. Sgraja et al (Sgraja & Linder; 2003) propose an algorithm to estimate
the whole channel matrix using Wiener filtering. Such an estimator requires a Wiener filter, a
multiplication operation for each element of the channel matrix and matrix inversion, which
increases the complexity of the receiver for large number of sub-carriers. In some systems,
a known training sequence is sent by the transmitter and a training algorithm is performed
by the receiver on the observed channel output and the known input to estimate the chan-
nel (Chow et al; 1991), (Ziegler & Cioffi; 1992) The deterministic least squares (DLS) channel
identification algorithm in (Ziegler & Cioffi; 1992) is such a simple but widely used training
approach. However, it is not suited for time varying system. In (Wang & Ray; 1999), authors
propose an adaptive channel estimation algorithm using the cyclic prefix. This algorithm can
adaptively track the channel variation without additional training sequences.
In (Choi et al; 2001), time-domain channel estimation followed by symbol detection based on
zero forcing (ZF) and minimum mean square error (MMSE) criterion have been proposed.
Pilot based channel estimation is also widely used in many algorithms. The most common
pilot based channel estimation scheme is the least square (LS) method of channel estimation
(Coleri et al; 2002), (Schramm et al; 1998). Blind adaptive channel estimation, based on least
mean square (LMS) for OFDM communication, is proposed in (Doukopoulos & Moustakides;
2004). Kalman filter is also used for channel estimation in (Gupta & Mehra; 2007). Finite affine
projection (FAP) algorithm is used to estimate the channel response for OFDM system in (Gao
et al; 2007). Gao et al (Gao et al; 2007) propose an efficient channel estimation for multi-
ple input multiple output (MIMO) single-carrier block transmission with dual cyclic timeslot
structure. An optimal channel estimation is then investigated in the minimal mean square
error (MMSE) sense on the time slot basis.
This channel state information (CSI) is exploited to design optimized system and several
such algorithms for CDMA and MC-CDMA systems are reported in literature. The opti-
mized systems include adaptive algorithm to minimize the total transmitted power (Lok
& Wong; 2000), signal-to-interference ratio (SIR) balanced optimum power control in CDMA
(Wu; 1999), joint optimization of spreading codes and a utility based power control (Reynolds
& Wang; 2003), joint rate and power control (Kim; 1999), joint transmitter-receiver optimiza-
tion using multiuser detection and resource allocation for energy efficiency in wireless CDMA
networks (Buzzi & Poor; 2008), using transmitter power control, receiver array processing
and multiuser detection (Seo & Yang,2006) etc. The objective of the optimized methods, in
general, is to minimize transmit power and maximize per user’s data transmission rate.
3. Proposed System
MC-CDMA system was first proposed in (Yee; 1993) and is a combination of CDMA and
OFDM with the spreading codes applied in frequency domain. We use carrier interferometry
(CI) code as spreading code. Interferometry, a classical method in experimental physics, refers
to the study of interference patterns resulting from the superpositioning of waves. CI codes of
length N supports N users orthogonally and then, as system demand increases, codes can be
selected to accommodate upto addition N-1 users pseudo-orthogonaly. Additionally, there is
no restriction on the length N of the CI code (i.e. N
∈ I), making it more robust to the diverse
requirements of wireless environments. Since the present MC-CDMA system employs CI code
as spreading code, this multiple access scheme is called as CI/MC-CDMA system. In other
words, the CI/MC-CDMA is an MC-CDMA scheme employing complex carrier interferom-
etry spreading codes. Assuming that there are K users and N subcarriers in the MC-CDMA
system, the CI code for the k-th user
(1 ≤ k ≤ K) is given by (Natarajan et al; 2001):
[1, e
j∆
θ
k
, e
j(N−1)∆
θ
k
] where ∆θ
k
= 2π.k/N.
In this chapter, we have discussed the operation and performance of a newly developed
CI/MC-CDMA model which is a variation that is discussed in (Natarajan et al; 2001). The
system proposed here is capable of supporting high capacity with reduction in PAPR as well
as low BER values at the receiver. Therefore, we present a brief review of the model in (Natara-
jan et al; 2001) followed by our new model.
3.1 Transmitter Model
In CI/MC-CDMA transmitter (Natarajan et al; 2001), the incoming data a
k
[n] for the k-th user,
is transmitted over N narrow-band sub-carriers each multiplied with an element of the k-th
user spreading code. Binary phase shift keying (BPSK) modulation is assumed, i.e. a
k
[n] =
±
1, where a
k
[n] represents n-th bit of k-th user. The transmitted signal corresponding to n-th
bit of the incoming data is given by
Satellite Communications398
S(t) =
N−1
∑
k=0
N
−1
∑
i=0
a
k
[n]exp
j(2π. f
i
t+i∆θ
k
)
p(t) (1)
where f
i
= f
c
+ i.∆ f is the i-th subcarrier, and p(t) is a rectangular pulse of duration T
b
. As
with the traditional MC-CDMA, the ∆ f ’s are selected such that the carrier frequencies are
orthogonal to each other, typically ∆ f
= 1/T
b
, where T
b
is the bit duration.
The transmitter model developed in (Natarajan et al; 2001) allows high data rate transmission
for (2N-1) users employing ’N’ number of sub-carriers. However, in many practical situa-
tions, users may have transmission of variable data rate. It is logical to consider variable data
rate transmission in multimedia signals environment as diverse classes of traffic signals have
different requirement of quality of services (QoS)(Maity et al; 2008b). We like to modify the
above transmitter model by allocating all sub-carriers to the users of high data rate transmis-
sion and odd and even sub-carriers are shared alternately among the users of low data rate.
In other words, we can split the sub-carriers in even and odd parts as well as the ’N’ length
PO-CI (pseudo-orthogonal) codes in N/2 odd and N/2 even parts. The mathematical form
for the transmitted signal S
1
(t) becomes
S
1
(t) = [
N−1
∑
k=0
N
−1
∑
i=0
a
k
[n]exp
j(2π. f
i
t+2π .i.k/N)
+
3N/2−1
∑
k=N
N
−1
∑
∀i=odd
a
k
[n]exp
j(2π. f
i
t+2π .i.k/N+i∆φ
1
)
+
2N−1
∑
k=3N/2
N
−1
∑
∀i=odd
a
k
[n]exp
j(2π. f
i
t+2π .(i+1).k/N+i∆φ
2
)
+
5N/2−1
∑
k=2N
N
−1
∑
∀i=even
a
k
[n]exp
j(2π. f
i
t+2π .i.k/N+i∆φ
3
)
+
3N−1
∑
k=5N/2
N
−1
∑
∀i=even
a
k
[n]exp
j(2π. f
i
t+2π .(i+1).k/N+i∆φ
4
)
]p(t − n.T
b
) (2)
where ∆φ
1
= +π/2,∆φ
2
= −π/2,∆φ
3
= −π/N − π and ∆φ
4
= −π/N indicate respective
phase shift angles with respect to orthogonal CI codes. The phase shift are set in order to make
the same even or odd subcarriers used by the different users through the respective spreading
codes in out-of-phase. This out-of-phase condition reduces cross-correlation values among the
spreading code patterns that not only leads to the reduction in PAPR values but also lower
BER values at the receiver. This fact is analyzed mathematically as well as is supported by
simulation results.
3.2 Channel Model
We also introduce here the channel model. The particular channel model needs to be con-
sidered since we will analyze later BER performance of the proposed system and its relative
improvement/ degradation due to reduction in PAPR. An uplink model has been considered
where all the users’ transmissions are assumed to be synchronized for simplification of anal-
ysis, although, this condition may seem difficult to be valid practically. It is also assumed
that every user experiences an independent propagation environment that is modeled as a
slowly varying multipath channel. Multipath propagation in time translates into frequency
selectivity in the frequency domain (Proakis, 1995). Frequency selectivity refers to the selec-
tivity over the entire bandwidth of transmission and not over each subcarrier transmission.
This is because
1
T
b
(∆ f
c
) BW, where ∆ f
c
is the coherence bandwidth and BW is the total
bandwidth.
3.3 Receiver Design for the proposed system
In this subsection, we describe the multiuser receiver operation when all the users transmit
data through all sub-carriers as developed S
(t) in Eq. (1). The received signal r(t) for this S(t)
corresponds to
r
(t) =
K
∑
k=1
N
−1
∑
i=0
α
ik
a
k
[n]cos(2π. f
i
t + i.∆θ
k
+ β
ik
).p(t) + η( t) (3)
where α
ik
is the Rayleigh fading gain and β
ik
is uniformly distributed phase offset of the k-th
user in the i-th carrier and the symbol η
(t) represents additive white Gaussian noise (AWGN).
The received signal is projected onto N-orthogonal carriers and is despread using j-th users
CI code resulting in r
j
= (r
j
0
, r
j
1
, r
j
N
−1
), where r
j
i
corresponds to
r
j
i
= α
ij
. a
j
[n] +
K
∑
k=1,k=j
α
ik
a
k
[n]cos(i(∆θ
k
−∆θ
j
)
+
β
ik
−
ˆ
β
ij
) + η
i
(4)
where η
i
is a Gaussian random variable with mean 0 and variance N
0
/2. Exact phase and
frequency synchronization for the desired user is assumed i.e.,
ˆ
β
ij
= β
ij
. Now, a suitable
combining strategy is used to create a decision variable D
j
, which then enters a decision device
that outputs
ˆ
a
j
. Minimum mean square error combining (MMSEC) is employed as it is shown
to provide the best performance in a frequency selective fading channel (Cal & Akansu; 2000).
The decision variable D
j
for the n-th bit is (Natarajan et al; 2001)
D
j
n
=
N
∑
i=1
r
j
i
w
ij
(5)
where
w
ij
=
α
(var(a
k
)A
ij
+ N
0
/2)
(6)
where A
ij
=
∑
K
k
=1
α
2
ik
cos(iδθ
k
− iδθ
j
+ β
ik
− β
ij
)
2
and var(a
k
) = 1. Thus, the outputs as the
single user detector for all the users generate a decision vector D
= [D
1
, D
2
, D
K
] which
is used to obtain the initial estimates of the data
ˆ
a
= (
ˆ
a
1
,
ˆ
a
2
,
ˆ
a
k
). These initial estimates
are then used to evaluate multiple access interference (MAI) experienced by each user in the
interference cancelation technique.
4. Design of power and spectral efficient system
This section describes multi-carrier code division multiple access (MC-CDMA) with PAPR
(peak-to-average power ratio) reduction using channel coding, optimized system design for
number of subcarriers and users, estimation of wireless channel condition, and finally MC-
CDMA with multi-user detection (MUD). The overall discussion focuses on different issues
for different section of a communication system, namely PAPR reduction and optimized sys-
tem design in transmitter, estimation of parameters for the channel, multiuser detection at
the receiver for increase in user capacity. The different issues are described under four broad
subheadings as follows.
Power and Spectral Efcient Multiuser Broadband Wireless Communication System 399
S(t) =
N−1
∑
k=0
N
−1
∑
i=0
a
k
[n]exp
j(2π. f
i
t+i∆θ
k
)
p(t) (1)
where f
i
= f
c
+ i.∆ f is the i-th subcarrier, and p(t) is a rectangular pulse of duration T
b
. As
with the traditional MC-CDMA, the ∆ f ’s are selected such that the carrier frequencies are
orthogonal to each other, typically ∆ f
= 1/T
b
, where T
b
is the bit duration.
The transmitter model developed in (Natarajan et al; 2001) allows high data rate transmission
for (2N-1) users employing ’N’ number of sub-carriers. However, in many practical situa-
tions, users may have transmission of variable data rate. It is logical to consider variable data
rate transmission in multimedia signals environment as diverse classes of traffic signals have
different requirement of quality of services (QoS)(Maity et al; 2008b). We like to modify the
above transmitter model by allocating all sub-carriers to the users of high data rate transmis-
sion and odd and even sub-carriers are shared alternately among the users of low data rate.
In other words, we can split the sub-carriers in even and odd parts as well as the ’N’ length
PO-CI (pseudo-orthogonal) codes in N/2 odd and N/2 even parts. The mathematical form
for the transmitted signal S
1
(t) becomes
S
1
(t) = [
N−1
∑
k=0
N
−1
∑
i=0
a
k
[n]exp
j(2π. f
i
t+2π .i.k/N)
+
3N/2−1
∑
k=N
N
−1
∑
∀i=odd
a
k
[n]exp
j(2π. f
i
t+2π .i.k/N+i∆φ
1
)
+
2N−1
∑
k=3N/2
N
−1
∑
∀i=odd
a
k
[n]exp
j(2π. f
i
t+2π .(i+1).k/N+i∆φ
2
)
+
5N/2−1
∑
k=2N
N
−1
∑
∀i=even
a
k
[n]exp
j(2π. f
i
t+2π .i.k/N+i∆φ
3
)
+
3N−1
∑
k=5N/2
N
−1
∑
∀i=even
a
k
[n]exp
j(2π. f
i
t+2π .(i+1).k/N+i∆φ
4
)
]p(t − n.T
b
) (2)
where ∆φ
1
= +π/2,∆φ
2
= −π/2,∆φ
3
= −π/N − π and ∆φ
4
= −π/N indicate respective
phase shift angles with respect to orthogonal CI codes. The phase shift are set in order to make
the same even or odd subcarriers used by the different users through the respective spreading
codes in out-of-phase. This out-of-phase condition reduces cross-correlation values among the
spreading code patterns that not only leads to the reduction in PAPR values but also lower
BER values at the receiver. This fact is analyzed mathematically as well as is supported by
simulation results.
3.2 Channel Model
We also introduce here the channel model. The particular channel model needs to be con-
sidered since we will analyze later BER performance of the proposed system and its relative
improvement/ degradation due to reduction in PAPR. An uplink model has been considered
where all the users’ transmissions are assumed to be synchronized for simplification of anal-
ysis, although, this condition may seem difficult to be valid practically. It is also assumed
that every user experiences an independent propagation environment that is modeled as a
slowly varying multipath channel. Multipath propagation in time translates into frequency
selectivity in the frequency domain (Proakis, 1995). Frequency selectivity refers to the selec-
tivity over the entire bandwidth of transmission and not over each subcarrier transmission.
This is because
1
T
b
(∆ f
c
) BW, where ∆ f
c
is the coherence bandwidth and BW is the total
bandwidth.
3.3 Receiver Design for the proposed system
In this subsection, we describe the multiuser receiver operation when all the users transmit
data through all sub-carriers as developed S
(t) in Eq. (1). The received signal r(t) for this S(t)
corresponds to
r
(t) =
K
∑
k=1
N
−1
∑
i=0
α
ik
a
k
[n]cos(2π. f
i
t + i.∆θ
k
+ β
ik
).p(t) + η( t) (3)
where α
ik
is the Rayleigh fading gain and β
ik
is uniformly distributed phase offset of the k-th
user in the i-th carrier and the symbol η
(t) represents additive white Gaussian noise (AWGN).
The received signal is projected onto N-orthogonal carriers and is despread using j-th users
CI code resulting in r
j
= (r
j
0
, r
j
1
, r
j
N
−1
), where r
j
i
corresponds to
r
j
i
= α
ij
. a
j
[n] +
K
∑
k=1,k=j
α
ik
a
k
[n]cos(i(∆θ
k
−∆θ
j
)
+
β
ik
−
ˆ
β
ij
) + η
i
(4)
where η
i
is a Gaussian random variable with mean 0 and variance N
0
/2. Exact phase and
frequency synchronization for the desired user is assumed i.e.,
ˆ
β
ij
= β
ij
. Now, a suitable
combining strategy is used to create a decision variable D
j
, which then enters a decision device
that outputs
ˆ
a
j
. Minimum mean square error combining (MMSEC) is employed as it is shown
to provide the best performance in a frequency selective fading channel (Cal & Akansu; 2000).
The decision variable D
j
for the n-th bit is (Natarajan et al; 2001)
D
j
n
=
N
∑
i=1
r
j
i
w
ij
(5)
where
w
ij
=
α
(var(a
k
)A
ij
+ N
0
/2)
(6)
where A
ij
=
∑
K
k
=1
α
2
ik
cos(iδθ
k
− iδθ
j
+ β
ik
− β
ij
)
2
and var(a
k
) = 1. Thus, the outputs as the
single user detector for all the users generate a decision vector D
= [D
1
, D
2
, D
K
] which
is used to obtain the initial estimates of the data
ˆ
a
= (
ˆ
a
1
,
ˆ
a
2
,
ˆ
a
k
). These initial estimates
are then used to evaluate multiple access interference (MAI) experienced by each user in the
interference cancelation technique.
4. Design of power and spectral efficient system
This section describes multi-carrier code division multiple access (MC-CDMA) with PAPR
(peak-to-average power ratio) reduction using channel coding, optimized system design for
number of subcarriers and users, estimation of wireless channel condition, and finally MC-
CDMA with multi-user detection (MUD). The overall discussion focuses on different issues
for different section of a communication system, namely PAPR reduction and optimized sys-
tem design in transmitter, estimation of parameters for the channel, multiuser detection at
the receiver for increase in user capacity. The different issues are described under four broad
subheadings as follows.
Satellite Communications400
4.1 MC-CDMA with PAPR reduction using channel coding
In this section, we will first define PAPR mathematically and then see whether this PAPR is
related to the properties of the spreading codes in multiuser systems. The rationale behind
such relation lies as each subcarrier is multiplied by chip of individual user’s spreading code
which is generated from phase shift for CI codes. It would not be irrelevant to mention here
that high PAPR occurs due to the superpositioning of several in-phase or near in-phase subcar-
riers. So cross-correlation and auto-correlation values of CI codes expect to have an influence
on PAPR values of the resultant multiuser signals. In MC-CDMA system, the corresponding
PAPR definition per discrete-time symbol is given by
PAPR
=
max
0≤i≤N−1
|S( i)
2
|
E[S(i)
2
]
(7)
where E
[|S(i)|
2
] and max
0≤i≤N−1
|S(t)|
2
denote the the average power and the peak power,
respectively in one symbol interval. The power of i-th time-domain sample denoted by P
(i),
1
≤ n ≤ N, from equation (2) for complex signal is
P
(i) = (
K
∑
k=1
N
−1
∑
i=0
a
k
[n]c
i
k
exp(j2π f
i
t))(
K
∑
k=1
N
−1
∑
i1=0
a
k
[n]c
i
k
exp(j2π f
i
t))
∗
=
K
∑
k=1
|a
k
[n]|
2
+
K
∑
k=1
∑
k=1,k=k1
a
k
[n]a
k1
[n]
N−1
∑
i2=−(N−1)
Z
(k,k1)
(i2)exp(i2π f
i2
t)
+
K
∑
k=1
a
k
[n]
2
N
−1
∑
i2=−(N−1),i2=0
Z
(k,k)
(i2)exp(j2π f
i2
t) (8)
The symbol a
k
[n] indicates n-th symbol of k-th user. Here Z
k,k1
(i2) is the aperiodic crosscor-
relation function of spreading codes between user k and k1,
Z
(k,k1)
(i2) =
N−i2
∑
m=1
c
m
k
(c
m+i2
k1
)∗
and Z
k,k
(i2) is the aperiodic autocorrelation function of the k-th user. It can be found that the
signal power of MC-CDMA system is partially determined by the correlation property of the
selected set of spreading codes. We now briefly present proposed PAPR reduction method
using code optimization, phase optimization and trellis coding.
A. Code Optimization
As defined earlier, the CI code for the k
th
user is given by the spreading sequence,
{β
0
k
, β
1
k
, β
2
k
, β
N−1
k
} = {e
j∆θ
0
k
, e
j∆θ
1
k
e
j∆θ
N−1
k
}
= {
e
j(2π/N)0.k
, e
j(2π/N)1.k
e
j(2π/N)(N−1).k
} (9)
Here, k
[0, 1, 2, K −1]. However, low value of PAPR is achieved if we give cycle shift of the
code that leads to new code. We can write the new code as
New code
= {β
0
k
+shi f t
, β
1
k
+shi f t
, β
N−1
k
+shi f t
}
= {
e
j∆θ
0
k
+shi f t
, e
j∆θ
1
k
+shi f t
e
j∆θ
N−1
k
+shi f t
}
= {
e
j(2π/N)0.(k+shi ft)
, e
j(2π/N)1.(k+shi ft)
e
j(2π/N)(N−1).(k+shi f t)
} (10)
Here ’shift’ indicates the number of cycle shift which is fixed for all users for a given period
of time,
[0 ≤
shi f t
≤ K]. It is seen from the simulation results that for a minimum value of
PAPR, the ’shift’ is either [1,2,3] or [(K-1) to (K-3)]. It is also found that performance achieved
by doing (K-1) to (K-3) shifting operations is same as is obtained by performing 1 to 3 times
reverse shifting. This means that as far as the code optimization is concerned, code sequence
for the users is shifted in forward or reverse cyclic shifting by an amount of 1 to 3 shifts.
B. Phase Optimization
To achieve lower PAPR value, we can use the iterative method where we shift the phase of
each set of users with additional rotation in between ∆φ
(max)
and ∆φ
(min)
so that the condition
∆φ
(max)
> ∆φ > ∆φ
(min)
is satisfied. It is also to be mentioned here that ∆φ
(max)
is allowed to
take value of ∆φ
+ π/32N, while ∆φ
(min)
=∆φ −π/32N . Fig. 1 shows the proposed code and
phase optimized variable data rate CI/MC-CDMA system with reduction in PAPR value.
Fig. 1. Block diagram representation of proposed M-ary CI/MC-CDMA PAPR reduction
scheme
C. Trellis coding
We also incorporate the effect of trellis coding for further improvement in PAPR reduction.
Trellis coding is a kind of convolution coding used here in combination with code and phase
optimization so that symbols for the different users are placed in the constellation that may
minimize the occurrence of high peak generation in the same odd and even sub-carriers.
Moreover, the usage of trellis coding offers the benefit of reduction in bit error rate (BER)
performance at the receiver. Fig. 2 shows the simplified block diagram of Fig. 1 with trellis
coding.
Power and Spectral Efcient Multiuser Broadband Wireless Communication System 401
4.1 MC-CDMA with PAPR reduction using channel coding
In this section, we will first define PAPR mathematically and then see whether this PAPR is
related to the properties of the spreading codes in multiuser systems. The rationale behind
such relation lies as each subcarrier is multiplied by chip of individual user’s spreading code
which is generated from phase shift for CI codes. It would not be irrelevant to mention here
that high PAPR occurs due to the superpositioning of several in-phase or near in-phase subcar-
riers. So cross-correlation and auto-correlation values of CI codes expect to have an influence
on PAPR values of the resultant multiuser signals. In MC-CDMA system, the corresponding
PAPR definition per discrete-time symbol is given by
PAPR
=
max
0≤i≤N−1
|S( i)
2
|
E[S(i)
2
]
(7)
where E
[|S(i)|
2
] and max
0≤i≤N−1
|S(t)|
2
denote the the average power and the peak power,
respectively in one symbol interval. The power of i-th time-domain sample denoted by P
(i),
1
≤ n ≤ N, from equation (2) for complex signal is
P
(i) = (
K
∑
k=1
N
−1
∑
i=0
a
k
[n]c
i
k
exp(j2π f
i
t))(
K
∑
k=1
N
−1
∑
i1=0
a
k
[n]c
i
k
exp(j2π f
i
t))
∗
=
K
∑
k=1
|a
k
[n]|
2
+
K
∑
k=1
∑
k=1,k=k1
a
k
[n]a
k1
[n]
N−1
∑
i2=−(N−1)
Z
(k,k1)
(i2)exp(i2π f
i2
t)
+
K
∑
k=1
a
k
[n]
2
N
−1
∑
i2=−(N−1),i2=0
Z
(k,k)
(i2)exp(j2π f
i2
t) (8)
The symbol a
k
[n] indicates n-th symbol of k-th user. Here Z
k,k1
(i2) is the aperiodic crosscor-
relation function of spreading codes between user k and k1,
Z
(k,k1)
(i2) =
N−i2
∑
m=1
c
m
k
(c
m+i2
k1
)∗
and Z
k,k
(i2) is the aperiodic autocorrelation function of the k-th user. It can be found that the
signal power of MC-CDMA system is partially determined by the correlation property of the
selected set of spreading codes. We now briefly present proposed PAPR reduction method
using code optimization, phase optimization and trellis coding.
A. Code Optimization
As defined earlier, the CI code for the k
th
user is given by the spreading sequence,
{β
0
k
, β
1
k
, β
2
k
, β
N−1
k
} = {e
j∆θ
0
k
, e
j∆θ
1
k
e
j∆θ
N−1
k
}
= {
e
j(2π/N)0.k
, e
j(2π/N)1.k
e
j(2π/N)(N−1).k
} (9)
Here, k
[0, 1, 2, K −1]. However, low value of PAPR is achieved if we give cycle shift of the
code that leads to new code. We can write the new code as
New code
= {β
0
k
+shi f t
, β
1
k
+shi f t
, β
N−1
k
+shi f t
}
= {
e
j∆θ
0
k
+shi f t
, e
j∆θ
1
k
+shi f t
e
j∆θ
N−1
k
+shi f t
}
= {
e
j(2π/N)0.(k+shi ft)
, e
j(2π/N)1.(k+shi ft)
e
j(2π/N)(N−1).(k+shi f t)
} (10)
Here ’shift’ indicates the number of cycle shift which is fixed for all users for a given period
of time,
[0 ≤
shi f t
≤ K]. It is seen from the simulation results that for a minimum value of
PAPR, the ’shift’ is either [1,2,3] or [(K-1) to (K-3)]. It is also found that performance achieved
by doing (K-1) to (K-3) shifting operations is same as is obtained by performing 1 to 3 times
reverse shifting. This means that as far as the code optimization is concerned, code sequence
for the users is shifted in forward or reverse cyclic shifting by an amount of 1 to 3 shifts.
B. Phase Optimization
To achieve lower PAPR value, we can use the iterative method where we shift the phase of
each set of users with additional rotation in between ∆φ
(max)
and ∆φ
(min)
so that the condition
∆φ
(max)
> ∆φ > ∆φ
(min)
is satisfied. It is also to be mentioned here that ∆φ
(max)
is allowed to
take value of ∆φ
+ π/32N, while ∆φ
(min)
=∆φ −π/32N . Fig. 1 shows the proposed code and
phase optimized variable data rate CI/MC-CDMA system with reduction in PAPR value.
Fig. 1. Block diagram representation of proposed M-ary CI/MC-CDMA PAPR reduction
scheme
C. Trellis coding
We also incorporate the effect of trellis coding for further improvement in PAPR reduction.
Trellis coding is a kind of convolution coding used here in combination with code and phase
optimization so that symbols for the different users are placed in the constellation that may
minimize the occurrence of high peak generation in the same odd and even sub-carriers.
Moreover, the usage of trellis coding offers the benefit of reduction in bit error rate (BER)
performance at the receiver. Fig. 2 shows the simplified block diagram of Fig. 1 with trellis
coding.
Satellite Communications402
Fig. 2. Simplified block diagram representation for the proposed M-ary CI/MC-CDMA
scheme with trellis coding
4.2 Proposed GA based channel estimation
This subsection first defines fitness function ‘F’ and GA based minimization is presented later.
A. Formation of Fitness function
We assume that actual fading gain at n-th subcarrier is α
n
and its estimated value is denoted
by
ˆ
α
n
. The error in estimated value is represented by e
n
. We can think of probability density
function (pdf) of the estimation error as central Chi-square distribution (Ahamad & Assaad;
2009) and can be written as follows:
f
(|e
2
n
|) =
1
σ
2
n
e
−| e
n
|
2
σ
2
n
(11)
where σ
2
n
is the variance of estimation error. So, in terms of estimated channel gains and its
corresponding error terms, the expression of (4) can be written as follows:
r
j
i
=
ˆ
α
i
+ e
i
+
K
∑
k=1,k=j
ˆ
α
i
ρ
kj
+
K
∑
k=1,k=j
e
i
ρ
kj
+ η
j
=
ˆ
α
i
+ e
n
+ σ
2
I
+ σ
2
Ie
+ σ
2
N
(12)
The first, second, third, forth and fifth term of (12) can be designated for the j-user as signal
term in i
− th subcarrier, estimated error in signal term, variance of interfere i.e. interference
power due to all other users at i-th subcarrier, interference power for estimation error, and
noise power at i-th subcarrier, respectively. For large number of users, the third and the forth
term correspond to a random variable with normal distribution (according to central limit
theorem).
We define signal-to-interference noise power ratio (SINR) corresponding to j-th user’s bit at
i-th subcarrier as follows:
(SINR)
j
i
=
(|
ˆ
α
i
|+ |e
i
|)
2
σ
2
I
+ σ
2
Ie
+ σ
2
N
i
(13)
We assume SINR for all subcarriers are independent, so total SINR for j-th user’s bit is
(SINR)
j
=
N
∑
i=1
(SINR)
j
i
(14)
The channel capacity corresponding to j-th user’s is
C
j
= log(1 + SI NR
j
) bits/sample (15)
Now total channel capacity can be calculated as C
=
∑
∀j
C
j
.
We now define ‘F’ as weighted average of channel capacity and detection probability p
e
i.e.
F
= f (C, p
e
). It is preferable to minimize ‘F’, while target is to maximize C and minimize p
e
.
It is logical to express C as C
norm
=
C
ˆ
α,e
C
α=1
, that indicates normalization of the channel capacity.
The symbol C
α=1
corresponds to non-fading situation and obviously channel capacity with
reliable decoding will be high. It is quite true that the value of
C
ˆ
α,e
C
α=1
is less than 1 but our target
is to achieve this value close to 1. The p
e
is calculated as follows:
p
e
=
1
K
K
∑
k=1
(b
k
−
ˆ
b
k
) (16)
where, K is total number of users, b
k
and
ˆ
b
k
are the transmitted and the received k-th user bit,
respectively.
The objective function ‘F’ can be defined as
F
= w
1
(1 −C
norm
) + w
2
p
e
= w
1
(1 −
C
ˆ
h,e
C
h=1
) + w
2
p
e
(17)
where w
1
and w
2
are the weight factors of channel capacity and detection reliability, respec-
tively. Each weight factor represents how important each index is during the searching process
of GA. For example, if both indices are equally important, each one should be 0.5 so that the
relationship w
1
+ w
2
= 1.0 must hold.
B. Optimization of Fitness function using GA
The experimental conditions of GA for the present problem are depicted as follows:
(i) size of population is 10,(ii) number of generation/iterations 100, (iii) probability of crossover
per generation is 0.80, and (iv) probability of mutation per bit is 0.07.
Initialization of twenty sets of random values for
ˆ
α
1
,
ˆ
α
2
,
ˆ
α
n
, e
1
,e
2
, e
n
are done. The values
of
ˆ
α
i
are taken from Rayleigh distribution, while the values of e’s are taken from (11). Then the
value of C and p
e
are calculated for each set. Using the procedure outlined in previous sub-
section, the value of fitness function ‘F’ is calculated for each of
ˆ
α
1
,
ˆ
α
2
,
ˆ
α
n
, e
1
,e
2
, e
n
using
(17). An upper bound of F value
(F
U
) is determined based on the calculated ‘F’ values. The
value of
(F
U
) acts as a threshold and is adjustable. This is required so that the needful number
of sets of
ˆ
α
1
,
ˆ
α
2
,
ˆ
α
n
, e
1
,e
2
, e
n
values for which ‘F’ values lie below the (F
U
) are duplicated.
The remaining sets having ‘F’ values higher than
(F
U
) are ignored from the population. This
process is done from the concept of selection of GA based algorithm. A binary string is gen-
erated through decimal-to-binary conversion for each selected set of
ˆ
α
1
,
ˆ
α
2
,
ˆ
α
n
, e
1
,e
2
, e
n
value and thus a set of strings are calculated for all selected combinations. Now, crossover and
mutation operations are done with above probabilities.Operations as described, when applied
to the selected sets, generate a new set of
ˆ
α
1
,
ˆ
α
2
,
ˆ
α
n
, e
1
,e
2
, e
n
value. This set is considered
as population for next iteration/generation of the proposed GA based optimization problem.
The operations are repeated for desired number of iterations or till a predefined acceptable
values for C and p
e
are achieved.
Power and Spectral Efcient Multiuser Broadband Wireless Communication System 403
Fig. 2. Simplified block diagram representation for the proposed M-ary CI/MC-CDMA
scheme with trellis coding
4.2 Proposed GA based channel estimation
This subsection first defines fitness function ‘F’ and GA based minimization is presented later.
A. Formation of Fitness function
We assume that actual fading gain at n-th subcarrier is α
n
and its estimated value is denoted
by
ˆ
α
n
. The error in estimated value is represented by e
n
. We can think of probability density
function (pdf) of the estimation error as central Chi-square distribution (Ahamad & Assaad;
2009) and can be written as follows:
f
(|e
2
n
|) =
1
σ
2
n
e
−| e
n
|
2
σ
2
n
(11)
where σ
2
n
is the variance of estimation error. So, in terms of estimated channel gains and its
corresponding error terms, the expression of (4) can be written as follows:
r
j
i
=
ˆ
α
i
+ e
i
+
K
∑
k=1,k=j
ˆ
α
i
ρ
kj
+
K
∑
k=1,k=j
e
i
ρ
kj
+ η
j
=
ˆ
α
i
+ e
n
+ σ
2
I
+ σ
2
Ie
+ σ
2
N
(12)
The first, second, third, forth and fifth term of (12) can be designated for the j-user as signal
term in i
− th subcarrier, estimated error in signal term, variance of interfere i.e. interference
power due to all other users at i-th subcarrier, interference power for estimation error, and
noise power at i-th subcarrier, respectively. For large number of users, the third and the forth
term correspond to a random variable with normal distribution (according to central limit
theorem).
We define signal-to-interference noise power ratio (SINR) corresponding to j-th user’s bit at
i-th subcarrier as follows:
(SINR)
j
i
=
(|
ˆ
α
i
|+ |e
i
|)
2
σ
2
I
+ σ
2
Ie
+ σ
2
N
i
(13)
We assume SINR for all subcarriers are independent, so total SINR for j-th user’s bit is
(SINR)
j
=
N
∑
i=1
(SINR)
j
i
(14)
The channel capacity corresponding to j-th user’s is
C
j
= log(1 + SI NR
j
) bits/sample (15)
Now total channel capacity can be calculated as C
=
∑
∀j
C
j
.
We now define ‘F’ as weighted average of channel capacity and detection probability p
e
i.e.
F
= f (C, p
e
). It is preferable to minimize ‘F’, while target is to maximize C and minimize p
e
.
It is logical to express C as C
norm
=
C
ˆ
α,e
C
α=1
, that indicates normalization of the channel capacity.
The symbol C
α=1
corresponds to non-fading situation and obviously channel capacity with
reliable decoding will be high. It is quite true that the value of
C
ˆ
α,e
C
α=1
is less than 1 but our target
is to achieve this value close to 1. The p
e
is calculated as follows:
p
e
=
1
K
K
∑
k=1
(b
k
−
ˆ
b
k
) (16)
where, K is total number of users, b
k
and
ˆ
b
k
are the transmitted and the received k-th user bit,
respectively.
The objective function ‘F’ can be defined as
F
= w
1
(1 −C
norm
) + w
2
p
e
= w
1
(1 −
C
ˆ
h,e
C
h=1
) + w
2
p
e
(17)
where w
1
and w
2
are the weight factors of channel capacity and detection reliability, respec-
tively. Each weight factor represents how important each index is during the searching process
of GA. For example, if both indices are equally important, each one should be 0.5 so that the
relationship w
1
+ w
2
= 1.0 must hold.
B. Optimization of Fitness function using GA
The experimental conditions of GA for the present problem are depicted as follows:
(i) size of population is 10,(ii) number of generation/iterations 100, (iii) probability of crossover
per generation is 0.80, and (iv) probability of mutation per bit is 0.07.
Initialization of twenty sets of random values for
ˆ
α
1
,
ˆ
α
2
,
ˆ
α
n
, e
1
,e
2
, e
n
are done. The values
of
ˆ
α
i
are taken from Rayleigh distribution, while the values of e’s are taken from (11). Then the
value of C and p
e
are calculated for each set. Using the procedure outlined in previous sub-
section, the value of fitness function ‘F’ is calculated for each of
ˆ
α
1
,
ˆ
α
2
,
ˆ
α
n
, e
1
,e
2
, e
n
using
(17). An upper bound of F value
(F
U
) is determined based on the calculated ‘F’ values. The
value of
(F
U
) acts as a threshold and is adjustable. This is required so that the needful number
of sets of
ˆ
α
1
,
ˆ
α
2
,
ˆ
α
n
, e
1
,e
2
, e
n
values for which ‘F’ values lie below the (F
U
) are duplicated.
The remaining sets having ‘F’ values higher than
(F
U
) are ignored from the population. This
process is done from the concept of selection of GA based algorithm. A binary string is gen-
erated through decimal-to-binary conversion for each selected set of
ˆ
α
1
,
ˆ
α
2
,
ˆ
α
n
, e
1
,e
2
, e
n
value and thus a set of strings are calculated for all selected combinations. Now, crossover and
mutation operations are done with above probabilities.Operations as described, when applied
to the selected sets, generate a new set of
ˆ
α
1
,
ˆ
α
2
,
ˆ
α
n
, e
1
,e
2
, e
n
value. This set is considered
as population for next iteration/generation of the proposed GA based optimization problem.
The operations are repeated for desired number of iterations or till a predefined acceptable
values for C and p
e
are achieved.
Satellite Communications404
4.3 Subcarrier PIC scheme
Multicarrier (MC) signal can be modeled as a vector in N-dimensions where N-mutually or-
thogonal subcarriers form the basis signals. Accordingly, MC-CDMA signals with high and
low data rates can be modeled as vectors of different dimensions in subcarrier signal space. In
MUD, CDMA signal is treated as a vector and is projected onto individual orthogonal spread-
ing function to estimate the interference of other users for the respective user. In PIC, for a
given user, CDMA composite signal is projected simultaneously to all spreading codes except
the desired one and the process demands high computation cost. The multiple access inter-
ference (MAI) estimation and its subsequent cancelation in MC-CDMA with variable data
rates can be implemented in the respective subcarrier component rather than projecting it
onto spreading functions followed by calculation of vector magnitude (Eq. 5 and Eq. 6), as is
done in case of conventional PIC method. This very simple concept is used to develop a low
computation cost PIC scheme when MAI is subtracted at the sub-carriers level. Fig. 3 shows
the block diagram representation of the proposed PIC method. The users are divided in two
different blocks, block 1(B-1) with high data rate transmission and block-2 (B-2) with low data
rate transmission.
Fig. 3. Block diagram representation of proposed PIC scheme
The received multiuser signal r
(t) is first passed through a lowpass filter followed by single
user detection through MMSEC. The decision vector D
= [D
1
, D
2
, D
K
] then generates the
initial estimates of the data
ˆ
a
= (
ˆ
a
1
,
ˆ
a
2
,
ˆ
a
k
) which are used to determine the polarity of
the interference. To estimate the interference experienced by j-th user at i-th subcarrier, the
received signal r(t) and the signal of all other users, except the j-th user, are projected onto i-th
subcarrier. The interference of other users are subtracted collectively from the former.
We now analyze mathematically the interference free estimation for the n-th bit of j-th user for
conventional PIC, two block PIC and the proposed subcarrier PIC. The expression of the same
for the conventional PIC system is
ˆ
a
j
n
= r
n
−
K
∑
k=1,k=j
ˆ
a
k
n
(18)
The similar expression for an arbitrary j-th user belonging to strong group and when belong
to weak group, respectively (of a two block PIC system) can be written as follows:
ˆ
a
j
n
= r
n
−
∑
∀k
1
∈S
1
,k
1
=j
ˆ
a
k
1
n
(19)
ˆ
a
j
n
= r
n
−
∑
∀k
1
∈S
1
ˆ
a
k
1
n
−
∑
∀k
2
∈S
2
,k
2
=j
ˆ
a
k
2
n
(20)
where the symbols of
ˆ
a
j
n
, r
n
, S
1
and S
2
represent n-th estimated bit of j-th user, resultant re-
ceived signal for n-th bit, set of strong and weak user groups, respectively.
The interference free estimation of the i-th subcarrier for the j-th user of block B
1
,
r
j
i
= r
i
−
∑
∀k
1
∈B
1
,k
1
=j
r
k
1
i
(21)
while the expression for the same belonging to block B
2
,
r
j
i
= r
i
−
∑
∀k
1
∈B
1
r
k
1
i
−
∑
∀k
2
∈S
2
,k
2
=j
r
k
2
i
(22)
where r
j
i
and r
i
indicate the i-th subcarrier component of the j-th user and the i-th subcarrier
component of resultant received signal, respectively.
Now, the decision variable D
j
n
for the n-th bit of an arbitrary j-th user of block B
1
can be
written accordingly to Eq. (5). The equation is rewritten in Eq. (22) for convenience of further
analysis. The similar expression for the j-th user of the block B
2
is written in Eq.(23)
D
j
n
=
N
∑
i=1
r
j
i
w
ij
(23)
D
j
n
=
N
∑
∀i=odd or even
r
j
i
w
ij
(24)
The values of r
j
i
in Eq. (22) and Eq. (23) can be put from Eq. (20) and Eq. (21), respectively.
Mathematical analysis of Eq. (20)-Eq.(23) show that stable decision variable D
j
n
can be achieved
for subcarrier PIC method compared to conventional PIC and block PIC. This is because in-
terference due to other users are subtracted before forming D
j
n
in the case of former unlike
the latter methods where D
j
n
is formed first and then interference is subtracted. This stable
decision variable D
j
n
gives rise to better estimation of
ˆ
a
j
leading to an improvement in BER
through interference cancelation. Moreover, the computation cost and time requirement is
less compared to the conventional PIC and other block PIC (Thippavajjula; 2004). This can
be well understood considering the fact that the users of block-1, transmit data at ‘q’ times
higher rate (say) compared to the users of block-2. So, for ‘q’ consecutive bits detection of
high data rate users, estimated interferences for the single bit due to low data rate users can
be made use. In other words, interferences estimated for low users’ single bit can be applied
to improve subsequent BER of high user data. It is to be mentioned here that the projection
of the received signal on the mutually orthogonal subcarriers is essentially the same for both
Power and Spectral Efcient Multiuser Broadband Wireless Communication System 405
4.3 Subcarrier PIC scheme
Multicarrier (MC) signal can be modeled as a vector in N-dimensions where N-mutually or-
thogonal subcarriers form the basis signals. Accordingly, MC-CDMA signals with high and
low data rates can be modeled as vectors of different dimensions in subcarrier signal space. In
MUD, CDMA signal is treated as a vector and is projected onto individual orthogonal spread-
ing function to estimate the interference of other users for the respective user. In PIC, for a
given user, CDMA composite signal is projected simultaneously to all spreading codes except
the desired one and the process demands high computation cost. The multiple access inter-
ference (MAI) estimation and its subsequent cancelation in MC-CDMA with variable data
rates can be implemented in the respective subcarrier component rather than projecting it
onto spreading functions followed by calculation of vector magnitude (Eq. 5 and Eq. 6), as is
done in case of conventional PIC method. This very simple concept is used to develop a low
computation cost PIC scheme when MAI is subtracted at the sub-carriers level. Fig. 3 shows
the block diagram representation of the proposed PIC method. The users are divided in two
different blocks, block 1(B-1) with high data rate transmission and block-2 (B-2) with low data
rate transmission.
Fig. 3. Block diagram representation of proposed PIC scheme
The received multiuser signal r
(t) is first passed through a lowpass filter followed by single
user detection through MMSEC. The decision vector D
= [D
1
, D
2
, D
K
] then generates the
initial estimates of the data
ˆ
a
= (
ˆ
a
1
,
ˆ
a
2
,
ˆ
a
k
) which are used to determine the polarity of
the interference. To estimate the interference experienced by j-th user at i-th subcarrier, the
received signal r(t) and the signal of all other users, except the j-th user, are projected onto i-th
subcarrier. The interference of other users are subtracted collectively from the former.
We now analyze mathematically the interference free estimation for the n-th bit of j-th user for
conventional PIC, two block PIC and the proposed subcarrier PIC. The expression of the same
for the conventional PIC system is
ˆ
a
j
n
= r
n
−
K
∑
k=1,k=j
ˆ
a
k
n
(18)
The similar expression for an arbitrary j-th user belonging to strong group and when belong
to weak group, respectively (of a two block PIC system) can be written as follows:
ˆ
a
j
n
= r
n
−
∑
∀k
1
∈S
1
,k
1
=j
ˆ
a
k
1
n
(19)
ˆ
a
j
n
= r
n
−
∑
∀k
1
∈S
1
ˆ
a
k
1
n
−
∑
∀k
2
∈S
2
,k
2
=j
ˆ
a
k
2
n
(20)
where the symbols of
ˆ
a
j
n
, r
n
, S
1
and S
2
represent n-th estimated bit of j-th user, resultant re-
ceived signal for n-th bit, set of strong and weak user groups, respectively.
The interference free estimation of the i-th subcarrier for the j-th user of block B
1
,
r
j
i
= r
i
−
∑
∀k
1
∈B
1
,k
1
=j
r
k
1
i
(21)
while the expression for the same belonging to block B
2
,
r
j
i
= r
i
−
∑
∀k
1
∈B
1
r
k
1
i
−
∑
∀k
2
∈S
2
,k
2
=j
r
k
2
i
(22)
where r
j
i
and r
i
indicate the i-th subcarrier component of the j-th user and the i-th subcarrier
component of resultant received signal, respectively.
Now, the decision variable D
j
n
for the n-th bit of an arbitrary j-th user of block B
1
can be
written accordingly to Eq. (5). The equation is rewritten in Eq. (22) for convenience of further
analysis. The similar expression for the j-th user of the block B
2
is written in Eq.(23)
D
j
n
=
N
∑
i=1
r
j
i
w
ij
(23)
D
j
n
=
N
∑
∀i=odd or even
r
j
i
w
ij
(24)
The values of r
j
i
in Eq. (22) and Eq. (23) can be put from Eq. (20) and Eq. (21), respectively.
Mathematical analysis of Eq. (20)-Eq.(23) show that stable decision variable D
j
n
can be achieved
for subcarrier PIC method compared to conventional PIC and block PIC. This is because in-
terference due to other users are subtracted before forming D
j
n
in the case of former unlike
the latter methods where D
j
n
is formed first and then interference is subtracted. This stable
decision variable D
j
n
gives rise to better estimation of
ˆ
a
j
leading to an improvement in BER
through interference cancelation. Moreover, the computation cost and time requirement is
less compared to the conventional PIC and other block PIC (Thippavajjula; 2004). This can
be well understood considering the fact that the users of block-1, transmit data at ‘q’ times
higher rate (say) compared to the users of block-2. So, for ‘q’ consecutive bits detection of
high data rate users, estimated interferences for the single bit due to low data rate users can
be made use. In other words, interferences estimated for low users’ single bit can be applied
to improve subsequent BER of high user data. It is to be mentioned here that the projection
of the received signal on the mutually orthogonal subcarriers is essentially the same for both