Satellite Communications Part 6 potx
Bạn đang xem bản rút gọn của tài liệu. Xem và tải ngay bản đầy đủ của tài liệu tại đây (2.13 MB, 30 trang )
Characterisation and Channel Modelling for Satellite Communication Systems 141
is of paramount significance in the design and implementation of satellite-based
communication systems.
The radio propagation channels can be developed using different approaches, e.g., physical
or deterministic techniques based on measured impulse responses and ray-tracing
algorithms which are complex and time consuming and statistical approach in which input
data and computational efforts are simple. The modelling of propagation effects on the LMS
communication links becomes highly complex and unpredictable owing to diverse nature of
radio propagation paths. Consequently statistical methods and analysis are generally the
most favourable approaches for the characterization of transmission impairments and
modelling of the LMS communication links.
The available statistical models for narrowband LMS channels can be characterized into two
categories: single state and multi-state models (Abdi et al., 2003). The single state models are
described by single statistical distributions and are valid for fixed satellite scenarios where
the channel statistics remain constant over the areas of interest. The multi-state or mixture
models are used to demonstrate non-stationary conditions where channel statistics vary
significantly over large areas for particular time intervals in nonuniform environments. In
this section, channel models developed for satellites based on statistical methods are
discussed.
4.1 Single-State Models
Loo Model: The Loo model is one of the most primitive statistical LMS channel model with
applications for rural environments specifically with shadowing due to roadside trees. In
this model the shadowing attenuation affecting the LOS signal due to foliage is
characterized by log-normal pdf and the diffuse multipath components are described by
Rayleigh pdf. The model illustrates the statistics of the channel in terms of probability
density and cumulative distribution functions under the assumption that foliage not only
attenuates but also scatters radio waves as well. The resulting complex signal envelope is
the sum of correlated lognormal and Rayleigh processes. The pdf of the received signal
envelope is given by (Loo, 1985; Loo & Butterworth, 1998).
0
2
0
2
ln
2
1
brfor exp
brfor exp
)(
0
2
0
0
2
0
b
r
b
r
d
r
dr
rP
(8)
where µ and
0
d are the mean and standard deviation, respectively. The parameter
0
b denotes the average scattered power due to multipath effects. Note that if attenuation
due to shadowing (lognormal distribution) is kept constant then the pdf in (8) simply yields
in Rician distribution. This model has been verified experimentally by conducting
measurements in rural areas with elevation angles up to
30 (Loo et al., 1998).
Corraza-Vatalaro Model: In this model, a combination of Rice and lognormal distribution is
used to model effects of shadowing on both the LOS and diffuse components (Corazza &
Vatalaro, 1994) The model is suitable for non-geostationary satellite channels such as
medium-earth orbit (MEO) and low-earth orbit (LEO) channels and can be applied to
different environments (e.g., urban, suburban, rural) by simply adjusting the model
parameters. The pdf of the received signal envelop can be written as:
dSspSrprP
Sr
0
)(
)()()(
(9)
where )( Srp denotes conditional pdf following Rice distribution conditioned on
shadowing S (Corazza et al., 1994)
))1(2(.)1(exp)1(2)(
0
2
2
2
KKIKKKSrP
S
r
S
r
S
r
0r (10)
where
K
is Rician factor (section 3.2) and
0
I is zero order modified Bessel function of first
kind. The pdf of lognormal of shadowing S, is given by:
2
ln
2
1
2
1
exp)(
h
S
Sh
S
SP 0S (11)
where
,20)10ln(h µ and
2
)(
h are mean and variance of the associated normal
variance, respectively. The received signal envelop can be interpreted as the product of two
independent processes (lognormal and Rice) with cumulative distribution function in the
following form (Corraza & Vatalaro, 1994):
))1(2,2(1)(
)(
)(
0
0
0 0
00
KKQEdrdSP
S
SP
rrPrP
S
r
S
S
r
r
r
S
r
(12)
where E(.) denotes the average with respect to S and Q is Marcum Q function.
The model is appropriate for different propagation conditions and has been verified using
experimental data with wide range of elevation angles as compared to Loo’s model.
Extended-Suzuki Model: A statistical channel model for terrestrial communications
characterized by Rayleigh and lognormal process is known as Suzuki model (Suzuki, 1977).
This model is suitable for modelling random variations of the signal in different types of
urban environments. An extension to this model, for frequency non-selective satellite
communication channels, is presented in (Pätzold et al., 1998) by considering that for most
of the time a LOS component is present in the received signal. The extended Suzuki process
is the product of Rice and lognormal probability distribution functions where inphase and
quadrature components of Rice process are allowed to be mutually correlated and the LOS
Satellite Communications142
component is frequency shifted due to Doppler shift. The pdf of the extended Suzuki
process can be written as (Pätzold et al., 1998):
dyyPrP
y
r
y
),()(
1
(13)
where
),( yxP
denotes the joint pdf of the independent Rician and lognormal processes
)(t
and )(t
, and yrx where y is variable of integration. The pdfs of Rice and
lognormal processes can be used in (13) to obtain the following pdf:
)(exp).(.exp)(
22
)(ln
0
0
2
))((
1
2
2
00
22
3
0
my
y
rp
p
y
r
IrP
y
r
0r (14)
where
0
is the mean value of random variable ,
x
m and µ are the mean and standard
deviation of random variable y and p denotes LOS component.
The model was verified experimentally with operating frequency of 870 MHz at an
elevation angle
15 in rural area with 35% trees coverage. Two scenarios were selected: a
lightly shadowed scenario and a heavily shadowed scenario with dense trees coverage. The
cumulative distribution functions of the measurement data were in good agreement with
those obtained from analytical extended Suzuki model.
Xie-Fang Model: This model (Xie & Fang, 2000), based on propagation scattering theory,
deals with the statistical modelling of propagation characteristics in LEO and MEO satellites
communication systems. In these satellites communication systems a mobile user or a
satellite can move during communication sessions and as a result the received signals may
fluctuate from time to time. The quality-of-service (QoS) degrades owing to random
fluctuations in the received signal level caused by different propagation impairments in the
LMS communication links (section 2). In order to efficiently design a satellite
communication system, these propagation effects need to be explored. This channel model
deals with the statistical characterization of such propagation channels.
In satellite communications operating at low elevation angles, the use of small antennas as
well as movement of the receiver or the transmitter introduces the probability of path
blockage and multipath scattering components which result in random fluctuations in the
received signal causing various fading phenomena. In this model fading is characterized as
two independent random processes: short-term (small scale) fading and long-term fading.
The long term fading is modelled by lognormal distribution and the small scale fading is
characterized by a more general form of Rician distribution. It is assumed, based on
scattering theory of electromagnetic waves, that the amplitudes and phases of the scattering
components which cause small scale fading due to superposition are correlated. The total
electric field is the sum of multipath signals arriving at the receiver (Beckman et al., 1987):
n
i
iitot
jAjEE
1
)exp()exp(
(15)
where n denotes the number of paths,
i
A and
i
represent the amplitude and phase of the
th
i path component, respectively. The pdf of the received signal envelope can be obtained as
follows (Xie & Fang, 2000):
d
SS
rSSrSrS
SS
SSrS
SS
r
rP
r
2
0
21
22
2112
21
2
1
2
2
2
1
21
2
cos)(sin2cos2
exp
2
1
2
exp)(
(16)
and the pdf of the received signal power envelope is given by:
d
SS
WSSWSWS
SS
SSWS
SS
WP
p
2
0
21
2
2112
21
2
2
2
12
21
2
cos)(sin2cos2
exp
2
1
2
exp
2
1
)(
(17)
where the parameters
,
1
S ,
2
S ,
and
denote the variances and means of the Gaussian
distributed real and imaginary parts of the received signal envelope ‘r’, respectively, and
‘W’ represents the power of the received signal.
This statistical LMS channel model concludes that the received signal from a satellite can be
expressed as the product of two independent random processes. The channel model is more
general in the sense that it can provide a good fit to experimental data and better
characterization of the propagation environments as compared to previously developed
statistical channel models.
Abdi Model: This channel model (Abdi et al., 2003) is convenient for performance
predictions of narrowband and wideband satellite communication systems. In this model
the amplitude of the shadowed LOS signal is characterized by Nakagami distribution
(section 3.4) and the multipath component of the total signal envelop is characterized by
Rayleigh distribution. The advantage of this model is that it results in mathematically
precise closed form expressions of the channel first order statistics such as signal envelop
pdf, moment generating functions of the instantaneous power and the second order channel
statistics such as average fade durations and level crossing rates (Abdi et al., 2003).
According to this model the low pass equivalent of the shadowed Rician signal’s complex
envelope can as:
)(exp)()(exp)()( tjtZtjtAtR
(18)
Characterisation and Channel Modelling for Satellite Communication Systems 143
component is frequency shifted due to Doppler shift. The pdf of the extended Suzuki
process can be written as (Pätzold et al., 1998):
dyyPrP
y
r
y
),()(
1
(13)
where
),( yxP
denotes the joint pdf of the independent Rician and lognormal processes
)(t
and )(t
, and yrx
where y is variable of integration. The pdfs of Rice and
lognormal processes can be used in (13) to obtain the following pdf:
)(exp).(.exp)(
22
)(ln
0
0
2
))((
1
2
2
00
22
3
0
my
y
rp
p
y
r
IrP
y
r
0r (14)
where
0
is the mean value of random variable ,
x
m and µ are the mean and standard
deviation of random variable y and p denotes LOS component.
The model was verified experimentally with operating frequency of 870 MHz at an
elevation angle
15 in rural area with 35% trees coverage. Two scenarios were selected: a
lightly shadowed scenario and a heavily shadowed scenario with dense trees coverage. The
cumulative distribution functions of the measurement data were in good agreement with
those obtained from analytical extended Suzuki model.
Xie-Fang Model: This model (Xie & Fang, 2000), based on propagation scattering theory,
deals with the statistical modelling of propagation characteristics in LEO and MEO satellites
communication systems. In these satellites communication systems a mobile user or a
satellite can move during communication sessions and as a result the received signals may
fluctuate from time to time. The quality-of-service (QoS) degrades owing to random
fluctuations in the received signal level caused by different propagation impairments in the
LMS communication links (section 2). In order to efficiently design a satellite
communication system, these propagation effects need to be explored. This channel model
deals with the statistical characterization of such propagation channels.
In satellite communications operating at low elevation angles, the use of small antennas as
well as movement of the receiver or the transmitter introduces the probability of path
blockage and multipath scattering components which result in random fluctuations in the
received signal causing various fading phenomena. In this model fading is characterized as
two independent random processes: short-term (small scale) fading and long-term fading.
The long term fading is modelled by lognormal distribution and the small scale fading is
characterized by a more general form of Rician distribution. It is assumed, based on
scattering theory of electromagnetic waves, that the amplitudes and phases of the scattering
components which cause small scale fading due to superposition are correlated. The total
electric field is the sum of multipath signals arriving at the receiver (Beckman et al., 1987):
n
i
iitot
jAjEE
1
)exp()exp(
(15)
where n denotes the number of paths,
i
A and
i
represent the amplitude and phase of the
th
i path component, respectively. The pdf of the received signal envelope can be obtained as
follows (Xie & Fang, 2000):
d
SS
rSSrSrS
SS
SSrS
SS
r
rP
r
2
0
21
22
2112
21
2
1
2
2
2
1
21
2
cos)(sin2cos2
exp
2
1
2
exp)(
(16)
and the pdf of the received signal power envelope is given by:
d
SS
WSSWSWS
SS
SSWS
SS
WP
p
2
0
21
2
2112
21
2
2
2
12
21
2
cos)(sin2cos2
exp
2
1
2
exp
2
1
)(
(17)
where the parameters
,
1
S ,
2
S ,
and
denote the variances and means of the Gaussian
distributed real and imaginary parts of the received signal envelope ‘r’, respectively, and
‘W’ represents the power of the received signal.
This statistical LMS channel model concludes that the received signal from a satellite can be
expressed as the product of two independent random processes. The channel model is more
general in the sense that it can provide a good fit to experimental data and better
characterization of the propagation environments as compared to previously developed
statistical channel models.
Abdi Model: This channel model (Abdi et al., 2003) is convenient for performance
predictions of narrowband and wideband satellite communication systems. In this model
the amplitude of the shadowed LOS signal is characterized by Nakagami distribution
(section 3.4) and the multipath component of the total signal envelop is characterized by
Rayleigh distribution. The advantage of this model is that it results in mathematically
precise closed form expressions of the channel first order statistics such as signal envelop
pdf, moment generating functions of the instantaneous power and the second order channel
statistics such as average fade durations and level crossing rates (Abdi et al., 2003).
According to this model the low pass equivalent of the shadowed Rician signal’s complex
envelope can as:
)(exp)()(exp)()( tjtZtjtAtR
(18)
Satellite Communications144
where )(tA and )(tZ are independent stationary random processes representing the
amplitudes of the scattered and LOS components, respectively. The independent stationary
random process,
)(t
, uniformly distributed over (0, 2
) denotes the phase of scattered
components and
)(t
is the deterministic phase of LOS component. The pdf of the received
signal envelop for the first order statistics of the model can be written as (Abdi et al., 2003):
)2(2
,1,
2
exp.
2
2
)(
00
2
11
0
2
00
0
mbb
r
mF
b
r
b
r
mb
mb
rP
m
r
0r (19)
where
0
2b is the average power of the multipath component,
is the average power of the
LOS component and
(.)
11
F is the confluent hypergeometric function.
The channel model’s first order and second order statistics compared with different
available data sets, demonstrate the appropriateness of the model in characterizing various
channel conditions over satellite communication links. This model illustrates similar
agreements with the experimental data as the Loo’s model and is suitable for the numerical
and analytical performance predictions of narrowband and wideband LMS communication
systems with different types of encoded/decoded modulations.
4.2 Multi-state Models
In the case of nonstationary conditions when terminals (either satellite or mobile terminal)
move in a large area of a nonuniform environment, the received signal statistics may change
significantly over the observation interval. Therefore, propagation characteristics of such
environments are appropriately characterized by the so-called multi-state models.
Markov models are very popular because they are computationally efficient, analytically
tractable with well established theory and have been successfully applied to characterize
fading channels, to evaluate capacity of fading channels and in the design of optimum error
correcting coding techniques (Tranter et al., 2003). Markov models are characterized in
terms of state probability and state probability transition matrices. In multi-state channel
models, each state is characterized by an underlying Markov process in terms of one of the
single state models discussed in the previous section.
Lutz Model: Lutz’s model (Lutz et al., 1991) is two-state (good state and bad state) statistical
model based on data obtained from measurement campaigns in different parts of Europe at
elevation angles between 13° to 43° and is appropriate for the characterization of radio wave
propagation in urban and suburban areas. The good state represents LOS condition in
which the received signal follows Rician distribution with Rice factor K which depends on
the operating frequency and the satellite elevation angle. The bad state models the signal
amplitude to be Rayleigh distributed with mean power
2
0
S which fluctuates with time.
Another important parameter of this model is time share of shadowing ‘A’. Therefore, pdf of
the received signal power can be written as follows (Lutz et al., 1991):
0
000
)()()().1()( dSSpSSpASpASp
LNRayRice
(20)
The values of the parameters A, K, means, variances and the associated probabilities have
been derived from measured data for different satellite elevations, antennas and
environments using curve fitting procedures. The details can be found in (Lutz et al., 1991).
Transitions between two states are described by first order Markov chain where transition
from one state to the next depends only on the current state. For two-state Lutz’ model, the
probabilities
ij
P
( bgji ,,
) represent transitions from sate i to state j according to good or
bad state as shown in Fig. 2.
Fig. 2. Lutz’s Two-state LMS channel model.
The transition probabilities can be determined in terms of the average distances
g
D
and
b
D
in meters over which the system remains in the good and bad states, respectively.
g
gb
D
vR
P
b
bg
D
vR
P
(21)
where v is the mobile speed in meters per second, R is the transmission data rate in bits per
second. As the sum of probabilities in any state is equal to unity, thus
gbgg
PP 1
and
.1
bgbb
PP
The time share of shadowing can be obtained as:
gb
b
DD
D
A
(22)
The parameter A in this model is independent of data rate and mobile speed. For different
channel models, the time share of shadowing is obtained according to available propagation
conditions and parameters. For example in (Saunders & Evans, 1996) time share of
shadowing is calculated by considering buildings height distributions and street width etc.
Three-State Model: This statistical channel model (Karasawa et al., 1997), based on three
states, namely clear or LOS state, the shadowing state and the blocked state, provides the
analysis of availability improvement in non-geostationary LMS communication systems.
The clear state is characterized by Rice distribution, the shadowing state is described by
Characterisation and Channel Modelling for Satellite Communication Systems 145
where )(tA and )(tZ are independent stationary random processes representing the
amplitudes of the scattered and LOS components, respectively. The independent stationary
random process,
)(t
, uniformly distributed over (0, 2
) denotes the phase of scattered
components and
)(t
is the deterministic phase of LOS component. The pdf of the received
signal envelop for the first order statistics of the model can be written as (Abdi et al., 2003):
)2(2
,1,
2
exp.
2
2
)(
00
2
11
0
2
00
0
mbb
r
mF
b
r
b
r
mb
mb
rP
m
r
0r (19)
where
0
2b is the average power of the multipath component,
is the average power of the
LOS component and
(.)
11
F is the confluent hypergeometric function.
The channel model’s first order and second order statistics compared with different
available data sets, demonstrate the appropriateness of the model in characterizing various
channel conditions over satellite communication links. This model illustrates similar
agreements with the experimental data as the Loo’s model and is suitable for the numerical
and analytical performance predictions of narrowband and wideband LMS communication
systems with different types of encoded/decoded modulations.
4.2 Multi-state Models
In the case of nonstationary conditions when terminals (either satellite or mobile terminal)
move in a large area of a nonuniform environment, the received signal statistics may change
significantly over the observation interval. Therefore, propagation characteristics of such
environments are appropriately characterized by the so-called multi-state models.
Markov models are very popular because they are computationally efficient, analytically
tractable with well established theory and have been successfully applied to characterize
fading channels, to evaluate capacity of fading channels and in the design of optimum error
correcting coding techniques (Tranter et al., 2003). Markov models are characterized in
terms of state probability and state probability transition matrices. In multi-state channel
models, each state is characterized by an underlying Markov process in terms of one of the
single state models discussed in the previous section.
Lutz Model: Lutz’s model (Lutz et al., 1991) is two-state (good state and bad state) statistical
model based on data obtained from measurement campaigns in different parts of Europe at
elevation angles between 13° to 43° and is appropriate for the characterization of radio wave
propagation in urban and suburban areas. The good state represents LOS condition in
which the received signal follows Rician distribution with Rice factor K which depends on
the operating frequency and the satellite elevation angle. The bad state models the signal
amplitude to be Rayleigh distributed with mean power
2
0
S which fluctuates with time.
Another important parameter of this model is time share of shadowing ‘A’. Therefore, pdf of
the received signal power can be written as follows (Lutz et al., 1991):
0
000
)()()().1()( dSSpSSpASpASp
LNRayRice
(20)
The values of the parameters A, K, means, variances and the associated probabilities have
been derived from measured data for different satellite elevations, antennas and
environments using curve fitting procedures. The details can be found in (Lutz et al., 1991).
Transitions between two states are described by first order Markov chain where transition
from one state to the next depends only on the current state. For two-state Lutz’ model, the
probabilities
ij
P
( bgji ,, ) represent transitions from sate i to state j according to good or
bad state as shown in Fig. 2.
Fig. 2. Lutz’s Two-state LMS channel model.
The transition probabilities can be determined in terms of the average distances
g
D
and
b
D
in meters over which the system remains in the good and bad states, respectively.
g
gb
D
vR
P
b
bg
D
vR
P
(21)
where v is the mobile speed in meters per second, R is the transmission data rate in bits per
second. As the sum of probabilities in any state is equal to unity, thus
gbgg
PP 1
and
.1
bgbb
PP
The time share of shadowing can be obtained as:
gb
b
DD
D
A
(22)
The parameter A in this model is independent of data rate and mobile speed. For different
channel models, the time share of shadowing is obtained according to available propagation
conditions and parameters. For example in (Saunders & Evans, 1996) time share of
shadowing is calculated by considering buildings height distributions and street width etc.
Three-State Model: This statistical channel model (Karasawa et al., 1997), based on three
states, namely clear or LOS state, the shadowing state and the blocked state, provides the
analysis of availability improvement in non-geostationary LMS communication systems.
The clear state is characterized by Rice distribution, the shadowing state is described by
Satellite Communications146
Loo’s pdf and the blocked state is illustrated by Rayleigh fading as shown in Fig. 3(a), where
1
a denotes the LOS component,
2
a represents shadowing effects caused by trees
and
3
a represents blockage (perfect shadowing). Similarly, multipath contributions in the
form of coherently reflected waves from the ground are denoted by
1
b and incoherently
scattered components from the land obstructions are represented by
2
b . The pdf of the
received signal envelop is weighted linear combination of these distributions:
(r)NP(r)LP(r)MP(r)P
RayleighLooRiceR
(23)
where M, L, and N are the time share of shadowing of Rice, Loo and Rayleigh distributions,
respectively. The distribution parameters for the model were found by means of the data
obtained from measurements using “INMARSAT” satellite and other available data sets.
The model was validated by comparing the theoretical cumulative distributions with those
obtained from measurement data. The state transitions characteristics of the model were
obtained using Markov model as shown in Fig. 3(b). The state occurrence probability
functions
,
A
P
B
P and
c
P (where 1
CBA
PPP ) can be computed as follows (Karasawa et
al., 1997):
aP
A
/)90(
2
(24)
where
is the elevation angle of satellite (
9010
) and ‘a’ is a constant with values:
areassuburban for
4
1066.1
areasurban for
3
100.7
a
areassuburban for 4
areasurban for
4
C
C
B
P
P
P
(25)
In order to characterize the state duration statistics such as the average distances or time
spans during which a particular state tends to persist, a model capable of providing time-
variant features is essential. A Markov process suitable for this purpose is expressed as
three-state model as shown in Fig. 3(b) (Karasawa et al., 1997). In this model short-term
fluctuations in the received signal are represented by specific pdfs within the states and
long-term fading is described by the transitions between the states. This model is also
suitable for the performance assessment of satellite diversity.
A significant aspect of the LMS systems is that a single satellite is not adequate for
achieving the desired coverage reliability with a high signal quality. Thus, it is desirable that
different satellite constellations should be employed which can improve the system
availability and signal quality by means of satellite diversity. If a link with one of the
satellites is interrupted by shadowing, an alternative satellite should be available to help
reduce the outage probability. This channel model also provides analysis for the
improvement of the signal quality and service availability by means of satellite diversity
where at least two satellites in LEO/MEO orbit, illuminate the coverage area simultaneously
in urban and suburban environments.
1
a
2
a
3
a
1
b
2
b
AA
P
BB
P
CC
P
A
C
P
CA
P
BC
P
CB
P
AB
P
BA
P
(a) (b)
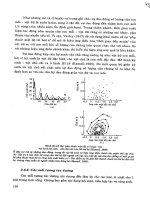
Fig. 3. Three-sate LMS channel model (a) Propagation impairments (b) Markov model.
Five-State Model: This channel model is based on Markov modelling approach in which
two-state and three-state models are extended to five-state model under different time share
of shadowing (Ming et al., 2008). The model is basically a composition of Gilbert-Elliot
channel model and the three-state Markov channel model in which shadowing effects are
split into three states: ‘good’ state represents low shadowing, ‘not good not bad’ state
characterizes moderate shadowing and ‘bad state’ describes heavy or complete shadowing
as shown in Fig. 4 (Ming et al., 2008). The ‘good’ state has two sub-states: clear LOS without
shadowing and LOS state with low shadowing. Similarly, the ‘bad’ state has two sub-states:
heavily shadowed areas or completely shadowed or blocked areas. A state transition can
occur when the receiver is in low or high shadowing areas for a period of time. The
transitions can take place from low and high shadowing conditions to moderate shadowing
conditions but cannot occur directly between low and high shadowing environments.
For different shadowing effects, the statistical signal level characteristics in terms of the pdf
are described as: low shadowing follows Rice distribution, moderate shadowing is
represented by Loo’s pdf and high shadowing conditions are described by Rayleigh-
lognormal distribution. The pdf of the received signal power is a weighted linear
combination of these distributions:
)()()()()()(
2_51_432211
sPXsPXsPXsPXsPXsP
LRayLRayLooRiceRice
(26)
where
i
X )5, ,1( i are time share of shadowing of the states
i
S )5, ,1(
i , respectively.
The state probability and state transition probability matrices are determined using the time
series of the measured data. The channel model has been validated using available
measured data sets and different statistical parameters are obtained using curve fitting
procedures. The channel statistics like the cumulative distribution function, the level
crossing rate, the average fade duration, and the bit error rate are computed which show a
Characterisation and Channel Modelling for Satellite Communication Systems 147
Loo’s pdf and the blocked state is illustrated by Rayleigh fading as shown in Fig. 3(a), where
1
a denotes the LOS component,
2
a represents shadowing effects caused by trees
and
3
a represents blockage (perfect shadowing). Similarly, multipath contributions in the
form of coherently reflected waves from the ground are denoted by
1
b and incoherently
scattered components from the land obstructions are represented by
2
b . The pdf of the
received signal envelop is weighted linear combination of these distributions:
(r)NP(r)LP(r)MP(r)P
RayleighLooRiceR
(23)
where M, L, and N are the time share of shadowing of Rice, Loo and Rayleigh distributions,
respectively. The distribution parameters for the model were found by means of the data
obtained from measurements using “INMARSAT” satellite and other available data sets.
The model was validated by comparing the theoretical cumulative distributions with those
obtained from measurement data. The state transitions characteristics of the model were
obtained using Markov model as shown in Fig. 3(b). The state occurrence probability
functions
,
A
P
B
P and
c
P (where 1
CBA
PPP ) can be computed as follows (Karasawa et
al., 1997):
aP
A
/)90(
2
(24)
where
is the elevation angle of satellite (
9010
) and ‘a’ is a constant with values:
areassuburban for
4
1066.1
areasurban for
3
100.7
a
areassuburban for 4
areasurban for
4
C
C
B
P
P
P
(25)
In order to characterize the state duration statistics such as the average distances or time
spans during which a particular state tends to persist, a model capable of providing time-
variant features is essential. A Markov process suitable for this purpose is expressed as
three-state model as shown in Fig. 3(b) (Karasawa et al., 1997). In this model short-term
fluctuations in the received signal are represented by specific pdfs within the states and
long-term fading is described by the transitions between the states. This model is also
suitable for the performance assessment of satellite diversity.
A significant aspect of the LMS systems is that a single satellite is not adequate for
achieving the desired coverage reliability with a high signal quality. Thus, it is desirable that
different satellite constellations should be employed which can improve the system
availability and signal quality by means of satellite diversity. If a link with one of the
satellites is interrupted by shadowing, an alternative satellite should be available to help
reduce the outage probability. This channel model also provides analysis for the
improvement of the signal quality and service availability by means of satellite diversity
where at least two satellites in LEO/MEO orbit, illuminate the coverage area simultaneously
in urban and suburban environments.
1
a
2
a
3
a
1
b
2
b
AA
P
BB
P
CC
P
A
C
P
CA
P
BC
P
CB
P
AB
P
BA
P
(a) (b)
Fig. 3. Three-sate LMS channel model (a) Propagation impairments (b) Markov model.
Five-State Model: This channel model is based on Markov modelling approach in which
two-state and three-state models are extended to five-state model under different time share
of shadowing (Ming et al., 2008). The model is basically a composition of Gilbert-Elliot
channel model and the three-state Markov channel model in which shadowing effects are
split into three states: ‘good’ state represents low shadowing, ‘not good not bad’ state
characterizes moderate shadowing and ‘bad state’ describes heavy or complete shadowing
as shown in Fig. 4 (Ming et al., 2008). The ‘good’ state has two sub-states: clear LOS without
shadowing and LOS state with low shadowing. Similarly, the ‘bad’ state has two sub-states:
heavily shadowed areas or completely shadowed or blocked areas. A state transition can
occur when the receiver is in low or high shadowing areas for a period of time. The
transitions can take place from low and high shadowing conditions to moderate shadowing
conditions but cannot occur directly between low and high shadowing environments.
For different shadowing effects, the statistical signal level characteristics in terms of the pdf
are described as: low shadowing follows Rice distribution, moderate shadowing is
represented by Loo’s pdf and high shadowing conditions are described by Rayleigh-
lognormal distribution. The pdf of the received signal power is a weighted linear
combination of these distributions:
)()()()()()(
2_51_432211
sPXsPXsPXsPXsPXsP
LRayLRayLooRiceRice
(26)
where
i
X )5, ,1( i are time share of shadowing of the states
i
S )5, ,1( i , respectively.
The state probability and state transition probability matrices are determined using the time
series of the measured data. The channel model has been validated using available
measured data sets and different statistical parameters are obtained using curve fitting
procedures. The channel statistics like the cumulative distribution function, the level
crossing rate, the average fade duration, and the bit error rate are computed which show a
Satellite Communications148
good agreement with the statistics of the data obtained from measurements. The channel
model is appropriate for urban and suburban areas.
Fig. 4. Five-state Markov channel model for LMS communications.
Modelling Frequency Selective LMS Channel: The LMS propagation channel effects
depend on the propagation impairments (section 2), geographical location, elevation angles
and operating frequency band. Extensive measurements are needed for the characterization
of LMS fading caused by different propagation impairments. When components of a signal
travelling through different paths arrive at the receiver with delays significantly larger as
compared to the bit or symbol duration, the signal will undergo significant amount of
distortion across the information bandwidth, it results in frequency selective fading or
wideband fading (e.g., in the case of broadband services or spread spectrum). The impulse
response of a wideband channel model (also known as tapped-delay line model) under
wide sense stationary uncorrelated scattering (WSSUS) assumption can be written as:
))()(2(exp)()(),(
,
1
ttfjtttath
iid
N
i
ii
(27)
where
),(ta
i
),(t
i
id
f
,
and
)(t
i
are the amplitude, delay, Doppler shift and phase of the
th
i
component of the received signal, respectively, and )(t
denotes the Dirac delta
function.
A tapped-delay line model that describes the wideband characteristics of LMS
communication link has been given in (Jahn, 2001). The parameters for this model are
extracted using extensive measurement data at L-band for different applications, scenarios
and environments. In order to adopt the channel for LMS communications, the channel
impulse response is divided into three components: the direct path, near echoes and far
echoes as shown in Fig. 5 (Jahn, 2001). The delays
i
), ,2,1( Ni
of the taps are taken with
respect to the delay of the direct path. The power of all taps is normalized to the power of
the direct path. The amplitude distributions of the echoes follow Rice or Rayleigh
distribution (section 3) depending on the presence of LOS or non-LOS situations,
respectively. The number
n
N of near echoes in the locality of the receiver follows Poisson
distribution with parameter
))()(.,.(
!
eNfei
N
Poisson
N
and the corresponding delays
i
), ,2,1( Ni characterizing near echoes follow exponential distribution with parameter
b
)}./()(.,.{
/
exp
befei
b
n
i
n
i
The power of the taps decay exponentially. The far
echoes
,1
nf
NNN which are few in numbers are characterized by Poisson
distribution. The amplitude distributions of the far echoes are described by Rayleigh
distribution. The description of different regions of the wideband LMS channel impulse
response can be found in (Jahn, 2001). Another physical-statistical channel model that deals
with the frequency selectivity of LMS channels is found in (Parks et al., 1996). This model
consists of two cascaded processes. The first one deals with propagation effects from
satellite to earth and the second process illustrates the terrestrial propagation impairments.
c
max
n
N
f
N
Fig. 5. Wideband LMS channel impulse response with different regions.
5. Conclusions
This chapter provides an overview of propagation impairments on LMS communication
links, probability distributions describing these fading effects and channel models
developed using these probability distributions. Proper knowledge of propagation
impairments and channel models is necessary for the design and performance assessment of
advanced transceiver techniques employed to establish reliable communication links in LMS
communication systems. The main focus lies on highlighting which are the effects and the
relevant propagation models need to be considered for LMS communication links in order
to accurately estimate the propagation impairments. The performance of LMS
communication systems depend on different factors including operating frequency,
elevation angles, geographic location, climate etc. Different approaches can be used to find
the effects of these factors on LMS communication links such as physical-statistical channel
models which are more accurate but require long simulation times and are complex. On the
other hand statistical methods are simple and require less computational efforts. In addition,
due to diverse nature of propagation environments, it is appropriate to use stochastic
approaches for the performance assessment of LMS communication links.
Characterisation and Channel Modelling for Satellite Communication Systems 149
good agreement with the statistics of the data obtained from measurements. The channel
model is appropriate for urban and suburban areas.
Fig. 4. Five-state Markov channel model for LMS communications.
Modelling Frequency Selective LMS Channel: The LMS propagation channel effects
depend on the propagation impairments (section 2), geographical location, elevation angles
and operating frequency band. Extensive measurements are needed for the characterization
of LMS fading caused by different propagation impairments. When components of a signal
travelling through different paths arrive at the receiver with delays significantly larger as
compared to the bit or symbol duration, the signal will undergo significant amount of
distortion across the information bandwidth, it results in frequency selective fading or
wideband fading (e.g., in the case of broadband services or spread spectrum). The impulse
response of a wideband channel model (also known as tapped-delay line model) under
wide sense stationary uncorrelated scattering (WSSUS) assumption can be written as:
))()(2(exp)()(),(
,
1
ttfjtttath
iid
N
i
ii
(27)
where
),(ta
i
),(t
i
id
f
,
and
)(t
i
are the amplitude, delay, Doppler shift and phase of the
th
i
component of the received signal, respectively, and )(t
denotes the Dirac delta
function.
A tapped-delay line model that describes the wideband characteristics of LMS
communication link has been given in (Jahn, 2001). The parameters for this model are
extracted using extensive measurement data at L-band for different applications, scenarios
and environments. In order to adopt the channel for LMS communications, the channel
impulse response is divided into three components: the direct path, near echoes and far
echoes as shown in Fig. 5 (Jahn, 2001). The delays
i
), ,2,1( Ni
of the taps are taken with
respect to the delay of the direct path. The power of all taps is normalized to the power of
the direct path. The amplitude distributions of the echoes follow Rice or Rayleigh
distribution (section 3) depending on the presence of LOS or non-LOS situations,
respectively. The number
n
N of near echoes in the locality of the receiver follows Poisson
distribution with parameter
))()(.,.(
!
eNfei
N
Poisson
N
and the corresponding delays
i
), ,2,1( Ni characterizing near echoes follow exponential distribution with parameter
b
)}./()(.,.{
/
exp
befei
b
n
i
n
i
The power of the taps decay exponentially. The far
echoes
,1
nf
NNN which are few in numbers are characterized by Poisson
distribution. The amplitude distributions of the far echoes are described by Rayleigh
distribution. The description of different regions of the wideband LMS channel impulse
response can be found in (Jahn, 2001). Another physical-statistical channel model that deals
with the frequency selectivity of LMS channels is found in (Parks et al., 1996). This model
consists of two cascaded processes. The first one deals with propagation effects from
satellite to earth and the second process illustrates the terrestrial propagation impairments.
c
max
n
N
f
N
Fig. 5. Wideband LMS channel impulse response with different regions.
5. Conclusions
This chapter provides an overview of propagation impairments on LMS communication
links, probability distributions describing these fading effects and channel models
developed using these probability distributions. Proper knowledge of propagation
impairments and channel models is necessary for the design and performance assessment of
advanced transceiver techniques employed to establish reliable communication links in LMS
communication systems. The main focus lies on highlighting which are the effects and the
relevant propagation models need to be considered for LMS communication links in order
to accurately estimate the propagation impairments. The performance of LMS
communication systems depend on different factors including operating frequency,
elevation angles, geographic location, climate etc. Different approaches can be used to find
the effects of these factors on LMS communication links such as physical-statistical channel
models which are more accurate but require long simulation times and are complex. On the
other hand statistical methods are simple and require less computational efforts. In addition,
due to diverse nature of propagation environments, it is appropriate to use stochastic
approaches for the performance assessment of LMS communication links.
Satellite Communications150
6. References
Abdi, A., Lau, C. W., Alouini, M., & Kaveh, M. (2003). A New Simple Model for Land
Mobile Satellite Channels: First- and Second-Order Statistics. IEEE Trans. Wireless
Comm., 2(3), 519-528.
Blaunstein, N., & Christodoulou, C. G. (2007). Radio Propagation and Adaptive Antennas
for Wireless Communication Links. John Wiley & Sons, Inc., Hoboken, New Jersey.
Corraza, G. E., & Vatalaro, F. (1994). A Statistical Channel Model for Land Mobile Satellite
Channels and Its Application to Nongeostationary Orbit Systems. IEEE Trans.
Vehicular Technology, 43(3), 738-742.
Corazza, G. E. (2007). Digital Satellite Communications. Springer Science plus Business
Media, LLC, New York.
Goldhirsh, J., & Vogel, W. J. (1998). Handbook of Propagation Effects for Vehicular and
Personal Mobile Satellite Systems, Over of Experimental and Modelling Results.
Ippolito, J. L., Jr. (2008). Satellite Communications Systems Engineering, Atmospheric
Effects, Satellite Link Design and System Performance. John Wiley & Sons Ltd.
ITU. (2002). Handbook on Satellite Communications, Wiley-Interscience, 3rd Edition.
ITU-R. (2007). Ionospheric Propagation data and Prediction Methods Required for the
Design of Satellite Services and Syatems. ITU-R P. 618-9.
ITU-R. (2009a). Ionospheric Propagation data and Prediction Methods Required for the
Design of Satellite Services and Syatems. ITU-R P. 531-10.
ITU-R. (2009b). Attenuation by Atmospheric Gases. ITU-R P. 676-8.
Jahn, A. (2001). Propagation Considerations and Fading Countermeasures for Mobile
Multimedia Services. Int. Journal of Satellite Communications, 19(3), 223-250.
Karasawa, Y., Kimura, K. & Minamisono, K. (1997). Analysis of Availability Improvement in
LMSS by Means of Satellite DiversityBased on Three-State Propagation Channel
Model. IEEE Trans. Vehicular Technology, 46(4), 1047-1056.
Loo, C. (1985). A Statistical Model for a Land Mobile Satellite Links. IEEE Trans. Vehicular
Technology, Vol. 34, no. 3, pp. 122-127.
Loo, C., & Butterworth, J. S. (1998). Lan Mobile Satellite Measurements and Modelling. IEEE
Proc., 86(7), 1442-14462.
Lutz, E., Cygan, D., Dippold, M., Donalsky, F., & Papke, W. (1991). The Land Mobile
Satellite Communication Channel- Rceording, Statistics and Channel Model. IEEE
Transactions on Vechicular Technology, 40(2), 375-386.
Ming, H., Dongya, Y., Yanni, C., Jie, X., Dong, Y., Jie, C. & Anxian, L. (2008). A New Five-
State Markov Model for Land Mobile Satellite Channels. Int. Symposium, Antennas,
Propagation and EM Theory, 1512-1515.
Parks, M. A. N., Saunders, S. R., Evans, B. G. (1996). A wideband channel model applicable
to Mobile Satellite Systems at L-band and S-band. IEE Colloquim on Propagation
Aspects of Future Mobile Systems, 12, 1-6.
Pätzold, M., Killat, U., & Laue, F. (1998). An Extended Suzuki Model for Land Mobile
Satellite Channels and Its Statistical Properties. IEEE Trans. Vehicular Technology,
47(2), 617-630.
Ratcliffe, J. A. (1973). Introduction in Physics of Ionosphere and Magnetosphere. Academic
Press, New York.Blaunstein, N. (1995). Diffusion spreading of middle-latitude
ionospheric plasma irregularities. Annales Geophasice, 13, 617-626.
Roddy, D. (2006). Satellite Communications, The McGraw Hill Companies, Inc, Fourth
Edition.
Saunders, S. R., & Evans, B. G. (1996). Physical Model for Shadowing Probability for Land
Mobile Satellite Propagation. IEE Electronic Letters, 32(17), 1248-1249.
Saunders, S. R., & Zavala, A. A. (2007). Antennas and Propagation for Wireless
Communication Systems. J. Wiley & Sons, New York.
Simon, M., & Alouini, M. (2000). Digital Communication over Fading Channels: A Unified
Approach to Performance Analysis. John Wileys & Sons, Inc, ISBN 0-471-31779-9
.
Suzuki, H. (1977). A Statistical Model for Urban Radio Propagation. IEEE Trans. Comm.,
25(7), 673-680.
Tranter, W., Shanmugan, K., Rappaport, T., and Kosbar, K. (2004). Principles of
Communication Systems Simulation with Wireless Applications. Pearson
Education, Inc.
Xie, Y., & Fang, Y. (2000). A General Statistical Channel Model for Mobile Satelllite Systems.
IEEE Trans. Vehicular Technology, 49(3), 744-752.
Characterisation and Channel Modelling for Satellite Communication Systems 151
6. References
Abdi, A., Lau, C. W., Alouini, M., & Kaveh, M. (2003). A New Simple Model for Land
Mobile Satellite Channels: First- and Second-Order Statistics. IEEE Trans. Wireless
Comm., 2(3), 519-528.
Blaunstein, N., & Christodoulou, C. G. (2007). Radio Propagation and Adaptive Antennas
for Wireless Communication Links. John Wiley & Sons, Inc., Hoboken, New Jersey.
Corraza, G. E., & Vatalaro, F. (1994). A Statistical Channel Model for Land Mobile Satellite
Channels and Its Application to Nongeostationary Orbit Systems. IEEE Trans.
Vehicular Technology, 43(3), 738-742.
Corazza, G. E. (2007). Digital Satellite Communications. Springer Science plus Business
Media, LLC, New York.
Goldhirsh, J., & Vogel, W. J. (1998). Handbook of Propagation Effects for Vehicular and
Personal Mobile Satellite Systems, Over of Experimental and Modelling Results.
Ippolito, J. L., Jr. (2008). Satellite Communications Systems Engineering, Atmospheric
Effects, Satellite Link Design and System Performance. John Wiley & Sons Ltd.
ITU. (2002). Handbook on Satellite Communications, Wiley-Interscience, 3rd Edition.
ITU-R. (2007). Ionospheric Propagation data and Prediction Methods Required for the
Design of Satellite Services and Syatems. ITU-R P. 618-9.
ITU-R. (2009a). Ionospheric Propagation data and Prediction Methods Required for the
Design of Satellite Services and Syatems. ITU-R P. 531-10.
ITU-R. (2009b). Attenuation by Atmospheric Gases. ITU-R P. 676-8.
Jahn, A. (2001). Propagation Considerations and Fading Countermeasures for Mobile
Multimedia Services. Int. Journal of Satellite Communications, 19(3), 223-250.
Karasawa, Y., Kimura, K. & Minamisono, K. (1997). Analysis of Availability Improvement in
LMSS by Means of Satellite DiversityBased on Three-State Propagation Channel
Model. IEEE Trans. Vehicular Technology, 46(4), 1047-1056.
Loo, C. (1985). A Statistical Model for a Land Mobile Satellite Links. IEEE Trans. Vehicular
Technology, Vol. 34, no. 3, pp. 122-127.
Loo, C., & Butterworth, J. S. (1998). Lan Mobile Satellite Measurements and Modelling. IEEE
Proc., 86(7), 1442-14462.
Lutz, E., Cygan, D., Dippold, M., Donalsky, F., & Papke, W. (1991). The Land Mobile
Satellite Communication Channel- Rceording, Statistics and Channel Model. IEEE
Transactions on Vechicular Technology, 40(2), 375-386.
Ming, H., Dongya, Y., Yanni, C., Jie, X., Dong, Y., Jie, C. & Anxian, L. (2008). A New Five-
State Markov Model for Land Mobile Satellite Channels. Int. Symposium, Antennas,
Propagation and EM Theory, 1512-1515.
Parks, M. A. N., Saunders, S. R., Evans, B. G. (1996). A wideband channel model applicable
to Mobile Satellite Systems at L-band and S-band. IEE Colloquim on Propagation
Aspects of Future Mobile Systems, 12, 1-6.
Pätzold, M., Killat, U., & Laue, F. (1998). An Extended Suzuki Model for Land Mobile
Satellite Channels and Its Statistical Properties. IEEE Trans. Vehicular Technology,
47(2), 617-630.
Ratcliffe, J. A. (1973). Introduction in Physics of Ionosphere and Magnetosphere. Academic
Press, New York.Blaunstein, N. (1995). Diffusion spreading of middle-latitude
ionospheric plasma irregularities. Annales Geophasice, 13, 617-626.
Roddy, D. (2006). Satellite Communications, The McGraw Hill Companies, Inc, Fourth
Edition.
Saunders, S. R., & Evans, B. G. (1996). Physical Model for Shadowing Probability for Land
Mobile Satellite Propagation. IEE Electronic Letters, 32(17), 1248-1249.
Saunders, S. R., & Zavala, A. A. (2007). Antennas and Propagation for Wireless
Communication Systems. J. Wiley & Sons, New York.
Simon, M., & Alouini, M. (2000). Digital Communication over Fading Channels: A Unified
Approach to Performance Analysis. John Wileys & Sons, Inc, ISBN 0-471-31779-9
.
Suzuki, H. (1977). A Statistical Model for Urban Radio Propagation. IEEE Trans. Comm.,
25(7), 673-680.
Tranter, W., Shanmugan, K., Rappaport, T., and Kosbar, K. (2004). Principles of
Communication Systems Simulation with Wireless Applications. Pearson
Education, Inc.
Xie, Y., & Fang, Y. (2000). A General Statistical Channel Model for Mobile Satelllite Systems.
IEEE Trans. Vehicular Technology, 49(3), 744-752.
Satellite Communications152
Combining satellite and geospatial
technologies for exploring rainstorm hazard over Mediterranean Central Area 153
Combining satellite and geospatial technologies for exploring rainstorm
hazard over Mediterranean Central Area
Nazzareno Diodato
X
Combining satellite and geospatial
technologies for exploring rainstorm hazard
over Mediterranean Central Area
1
Nazzareno Diodato
MetEROBS – Met European Research Observatory, GEWEX-CEOP Network,
World Climate Research Programme, via Monte Pino snc, 82100 Benevento
Italy
e-mail:
1. Introduction
Modelling is not an alternative to observation but,
under certain circumstances, can be a powerful tool
in understanding observations and in developing and testing theory.
Mulligan M., and Wainwright J., 2004. Modelling and Model Building.
In: Environmental Modelling, Wiley, p. 2
Multiple Damaging Hydrological Events (MDHE, Petrucci & Polemio, 2003) are rapidly
developing into deluges, flashfloods, floods, mudflows, accelerated erosion, and landslides
(Kar & Hodgson, 2008; Younis et al., 2008), with tragic consequences on the viable habitat
for humankind and ecosystems, and agriculture (Clarke & Rendell, 2005). In this context,
MDHE could have more impact than the frequently cited hazard of global warming due to
intensification of the hydrological cycle and the concentration of rainfall in sporadic- but
more intense events (Allen & Ingram, 2002).
There is, in fact, evidence available from different parts of the world of a rising trend of
natural disasters since 1993 (Sivakumar, 2005), included Medietarrean basin (Diodato &
Bellocchi, 2010). For Southern Italy, in particular, the catstrophic events of Sarno in 1998
(Mazzarella & Diodato, 2002), with the more recent devastating deluges in Naples in 2001,
2003, 2004, 2006, and in southeastern of Sicily in 2009, were caused by extremes rain of 100-
400 mm fallen in few hours over little areas. Therefore, global vision in remote sensing
coverage and surveillance loop are important, since we do not know where an event might
take place (Bacon et al., 2008). However, estimating rainfall from satellite imagery is rather
complex (Ymeti, 2007), and due to limited success of deterministic rainstorm impact
modelling techniques (Heneker et al., 2001).
1
This chapter is a revision of the paper appeared on The Open Environmental Engineering Journal, 2009, 2, 97-103.
© Diodato & Ceccarelli; Licensee Bentham Open.
8
Satellite Communications154
Also, while the literature on general model theory is vast, the aims of modellers usually
consist of improving our understanding of a phenomenon and its process, and ultimately
predicting the response of the landscape (Kelly et al., 2004; Diodato, 2005). In this context,
data assimilation models, that combine ground measurements with remote sensing of rain-
data, need to accommodate many specific aspects of the observations and models (Pan et al.,
2008).
While surface data will always remain important cornerstones of reference for monitoring
and modelling geospatial data, ground data suffers especially due to mutability of their
patterns, even as the modeller is compelled to adapt frequently to maintain sufficient
condition of temporal and spatial homogeneity, with time-series that are difficult to update.
The advent of Geographical Information Science (GISsci) can confer an innovative role on
hazard modelling development, satellite data assimilation, model outputs uncertainty
assessment, spatial data scaling, and mapping visualization. Although satellite data are
regarded as indirect information and not as reliable as surface data, they can be of great help
when used for scaling and assisting the modelling of a dynamic system (Su et al., 2008).
However, the problem is that we have a significant increase in uncertainty when the
measurements and forecasts move from the global to local scale, especially in their
landscape response to change, such as downpours, heavy runoffs and flash-floods, deluges,
sediment transport, and urban stormwater (after Beven, 2008). An interesting study for
assessing rainfall impact was recently done by (Shoji & Kitaura, 2006) that analyzed
precipitation with the parametric geostatistical approach in order to obtain information for
predicting natural hazards caused by heavy rains.
In this paper, a different geostatistical criterion was applied – specifically a non-parametric
approach – by transforming ground and satellite information into a continuous probabilistic
response consistent with soft descriptions of hazards which is referred to in this study to
mitigate the uncertainties in downscaling and geocomputational tracking (e.g., spatio-
temporal non-homogeneity in the primary variable pattern, accuracy of the supplementary
variables, errors involving sampling and hazard modelling). Processes operating to these
multiple spatial and temporal scales, however, challenge the predictive capability of
environmental models and integration or scaling of data from different sources (Allen et al.,
2004). Non-parametric geostatistical multivariate analysis, via co-indicator coding criteria, is
able to combine rainstorm indicators (which are recorded at sparse raingauge station-points)
and supplementary satellite rain data (which are recorded across regular patterns). So that,
the novelty of our approach lies in how methods and different tools might incorporate
uncertainty associated with satellite data into a model of rainstorm hazard accounting, and
to illustrate how model performs at sub-regional scale. In this way, the expansion of a
Rainstorm Hazard Index (RHI) data from point to spatial information can be assessed with
the Indicator CoKriging (ICK) technique, using Tropical Rainfall Mission Monitoring
(TRMM–NASA) satellite rain data as covariate. Thus, spatial information is visualized with
examples of probability estimations for different precipitation durations – ranging from 3 to
48 hours – and the quantification of hydrological hazard fields is done using probability
maps of damaging rainstorms prone-areas.
2. Reference Data Sets and Methodology
2.1 Study area and problem setting
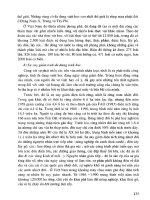
Heavy rainfall between 1951 and 2007 show Northern Mediterranean more affected than
Southern one (Fig. 1a). Worldwide temporal pattern is also shown with a trend of
hydrological disasters strongly increasing (Fig. 1b).
The rainstorms most perceived by the public are the large-scale damaging events; however,
there is evidence that the most deadly floods are those with short lead times – flash floods –
which in Mediterranean Europe have mostly a spatially limited character and can occur far
away from major rivers (Lalsat et al., 2003).
a) b)
Hydrological disasters
1900 1925 1950 1975 2000
Biolo gical
Geological Hydrologic al
Events Number
400
300
100
200
Fig. 1. (a): Occurrence of the heavy rain and hail during 1951–2007 period across
Mediterranean lands ( (b): Global natural disasters
trends upon 1900-2005 period from EM-DAT (OFDA/CRED International Disaster
Database, ).
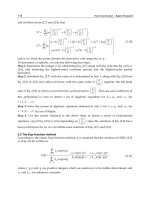
In this respect, a test-area extending approximately 60000 km
2
, was selected from
Mediterranean central area (Fig. 2a corner). SCIA-APAT Database (www.apat.it/) was
utilized for collecting rainfall ground data. However, ground data are not always updated
and not all the networks uniformly coincide at all times with this database. Then satellite
rain-data were also derived from the TRMM-NASA platform, algorithm 3B42 multi-satellite
precipitation estimates (Huffman et al., 2007), that uses an optimal combination (HQ) of 2B-
31, 2A-12, SSMI, AMSR, and AMSU precipitation estimates, with a resolution of 0.25x0.25
degree (about 25x25 km) grid boxes (
In this way, a reference classification was constructed from RHI, driven by rainstorm events
on 14 November 2004, 24 January 2003, and 4-5 May 1998. Data assimilation pattern in the
region under study were obtained from 64 raingauges (Fig. 2a), and 143 supplementary
satellite rain grid-data (Fig. 2b).
Combining satellite and geospatial
technologies for exploring rainstorm hazard over Mediterranean Central Area 155
Also, while the literature on general model theory is vast, the aims of modellers usually
consist of improving our understanding of a phenomenon and its process, and ultimately
predicting the response of the landscape (Kelly et al., 2004; Diodato, 2005). In this context,
data assimilation models, that combine ground measurements with remote sensing of rain-
data, need to accommodate many specific aspects of the observations and models (Pan et al.,
2008).
While surface data will always remain important cornerstones of reference for monitoring
and modelling geospatial data, ground data suffers especially due to mutability of their
patterns, even as the modeller is compelled to adapt frequently to maintain sufficient
condition of temporal and spatial homogeneity, with time-series that are difficult to update.
The advent of Geographical Information Science (GISsci) can confer an innovative role on
hazard modelling development, satellite data assimilation, model outputs uncertainty
assessment, spatial data scaling, and mapping visualization. Although satellite data are
regarded as indirect information and not as reliable as surface data, they can be of great help
when used for scaling and assisting the modelling of a dynamic system (Su et al., 2008).
However, the problem is that we have a significant increase in uncertainty when the
measurements and forecasts move from the global to local scale, especially in their
landscape response to change, such as downpours, heavy runoffs and flash-floods, deluges,
sediment transport, and urban stormwater (after Beven, 2008). An interesting study for
assessing rainfall impact was recently done by (Shoji & Kitaura, 2006) that analyzed
precipitation with the parametric geostatistical approach in order to obtain information for
predicting natural hazards caused by heavy rains.
In this paper, a different geostatistical criterion was applied – specifically a non-parametric
approach – by transforming ground and satellite information into a continuous probabilistic
response consistent with soft descriptions of hazards which is referred to in this study to
mitigate the uncertainties in downscaling and geocomputational tracking (e.g., spatio-
temporal non-homogeneity in the primary variable pattern, accuracy of the supplementary
variables, errors involving sampling and hazard modelling). Processes operating to these
multiple spatial and temporal scales, however, challenge the predictive capability of
environmental models and integration or scaling of data from different sources (Allen et al.,
2004). Non-parametric geostatistical multivariate analysis, via co-indicator coding criteria, is
able to combine rainstorm indicators (which are recorded at sparse raingauge station-points)
and supplementary satellite rain data (which are recorded across regular patterns). So that,
the novelty of our approach lies in how methods and different tools might incorporate
uncertainty associated with satellite data into a model of rainstorm hazard accounting, and
to illustrate how model performs at sub-regional scale. In this way, the expansion of a
Rainstorm Hazard Index (RHI) data from point to spatial information can be assessed with
the Indicator CoKriging (ICK) technique, using Tropical Rainfall Mission Monitoring
(TRMM–NASA) satellite rain data as covariate. Thus, spatial information is visualized with
examples of probability estimations for different precipitation durations – ranging from 3 to
48 hours – and the quantification of hydrological hazard fields is done using probability
maps of damaging rainstorms prone-areas.
2. Reference Data Sets and Methodology
2.1 Study area and problem setting
Heavy rainfall between 1951 and 2007 show Northern Mediterranean more affected than
Southern one (Fig. 1a). Worldwide temporal pattern is also shown with a trend of
hydrological disasters strongly increasing (Fig. 1b).
The rainstorms most perceived by the public are the large-scale damaging events; however,
there is evidence that the most deadly floods are those with short lead times – flash floods –
which in Mediterranean Europe have mostly a spatially limited character and can occur far
away from major rivers (Lalsat et al., 2003).
a) b)
Hydrological disasters
1900 1925 1950 1975 2000
Biolo gical
Geological Hydrologic al
Events Number
400
300
100
200
Fig. 1. (a): Occurrence of the heavy rain and hail during 1951–2007 period across
Mediterranean lands ( (b): Global natural disasters
trends upon 1900-2005 period from EM-DAT (OFDA/CRED International Disaster
Database,
).
In this respect, a test-area extending approximately 60000 km
2
, was selected from
Mediterranean central area (Fig. 2a corner). SCIA-APAT Database (www.apat.it/) was
utilized for collecting rainfall ground data. However, ground data are not always updated
and not all the networks uniformly coincide at all times with this database. Then satellite
rain-data were also derived from the TRMM-NASA platform, algorithm 3B42 multi-satellite
precipitation estimates (Huffman et al., 2007), that uses an optimal combination (HQ) of 2B-
31, 2A-12, SSMI, AMSR, and AMSU precipitation estimates, with a resolution of 0.25x0.25
degree (about 25x25 km) grid boxes ( />).
In this way, a reference classification was constructed from RHI, driven by rainstorm events
on 14 November 2004, 24 January 2003, and 4-5 May 1998. Data assimilation pattern in the
region under study were obtained from 64 raingauges (Fig. 2a), and 143 supplementary
satellite rain grid-data (Fig. 2b).
Satellite Communications156
Lat N
Long E
Kilometers0 50 10025
E E E E E E E E E E E E E
E E E E E E E E E E E E E
E E E E E E E E E E E E E
E E E E E E E E E E E E E
E E E E E E E E E E E E E
E E E E E E E E E E E E E
E E E E E E E E E E E E E
E E E E E E E E E E E E E
E E E E E E E E E E E E E
E E E E E E E E E E E E E
E E E E E E E E E E E E E
14
.2 0000 0
14
.2 0000 0
15
.1000 00
15
.1000 00
16
.00000 0
16
.00000 0
40
.40 0000
40
.4 0000 0
41
.3000 00
41
.3 0000 0
42
.2000 00
42
.2 00000
Kilometers0 50 10025
!
!
!
!
!
!
!
!
!
!
!
!
!
!
!
!
!
!
!
!
!
!
!
!
!
!
!
!
!
!
!
!
!
!
!
!
!
!
!
!
!
!
!
!
!
!
!
!
!
! !
!
!
!
!
!
!
!
!
!
!!
!
!
9
8
7
6
5
4
3
2
1
0
63
62
61
60
59
57
56
55
54
53
52
51
5049
48
47
46
45
44
43
42
41
40
39
38
37
36
34
33
32
31
30
29
27
26
25
24
23
22
21
19
18
16
15
13
12
14
.2 0000 0
14
.2 0000 0
15
.10 0000
15
.10 0000
16
.0000 00
16
.0000 00
40
.40 0000
40
.40000 0
41
.3000 00
41
.3 00000
42
.2000 00
42
.200000
a)
b)
Long E
Lat N
0 400 800 1200 1600 1800 2280 a.s.l.
meters
Tyrrhenhian Sea
Adriatic Sea
Naples
a)
Fig. 2. (a): Geographical setting and data assimilation patterns from in-situ-raingauges with
coded-station-points, and (b): TRMM-RS satellite rain data pixel centroid grid of 25 x 25 km,
superimposed on elevation data of hillshade land derived from DEM (SRTM)-90 meters
( />).
2.2 Rainstorm hazard problem-solving logic process
Expert systems can be designed to model processes when carried out using the IF-THEN
logic statement to impose an event contingent upon the condition (Moody & Katz, 2004).
Problem–solving logic process frameworks include first an invariant spatial model
recognizing critical-thresholds from the response ratios between the two following
components of the landscape:
- pulsing force that disturbs the system, including current rainstorm depth, and;
- resistance force, including storm variability that occurred in the system’s climate
history.
As a more concrete application, we can incorporate, for each rainy step of duration h at
sampled location s
α
, two processes into the rainstorm logic statement linking the the RHI to
the following power equation (after Diodato, 2006; Diodato & Petrucci, 2009):
α
2
α
s
1
s max : 1 48 hours
h
h
Rclim
h
RSD
RHI h
f
(1)
where RSD
h
is the Rain-Storm Depth (mm), that represents the pulsing force that disturbs
the system during an event of duration h, and:
Med 8
h wet
Rclim
f RSD h S (2)
is a function that represents the system resistance state, that is the intrinsic ability of the
system to resist change because of its history (recent and past). Med(RSD
h
) –the threshold
value – is the median of the annual maximum rainfall (mm) of duration h, and the term (8–
√h)S
wet
, is a function adjusting the threshold value with the current variation of the soil
humidity. As proxies of the soil humidity, three coefficients was introduced as S
wet
equal to
0.5, 0, and 2 according to dry, humid, and very humid soil conditions before the event,
respectively; these coefficients can be derived, in turn from remote sensing; the duration of
rainstorm (h) under square root is to explain a major accommodation of the system for
rainfall spanning over a longer period. Whereas, for each sampled location with a Rainstorm
Hazard Index (RHI)0, no-rainstorm hazard occurs, and with RHI value barely over 1, the
probability of occurrence of a rainstorm hazard commences at 0.50.
2.3 Matching coding approach for decision–making under uncertainty
While the above RHI–model is utilized to arrive at conclusions at the puntual-scale, the use
of geostatistics method may help to overcome the inherent difficulties in spatial scaling,
when the above RHI discrete data must accommodate a continuous spatial solution and data
collection across sampled- and unsampled locations. Thus, the RHI–results are converted to
a binary vector and matched to satellite rain-data under a GIS flow and supported by
indicator cokriging technique (Fig. 3).
Consider the following information obtained over the study area:
- values of the random primary variable Z (RHI), at m locations s
α
, z(s
α
), = 1,2 … n
1
;
and
- y(s) TRMM satellite rain-data at supplementary grid locations s within the area.
Indicator approach of the primary variable requires that all data be coded as local prior
probability values. Precise measurements of z
k
at hard data locations s
α
are then coded into a
set of K binary (hard) indicator data defined as:
with
α
α
1 s
s ;
0 otherwise
k
k
z z
i z
(3)
Combining satellite and geospatial
technologies for exploring rainstorm hazard over Mediterranean Central Area 157
Lat N
Long E
Kilometers0 50 10025
E E E E E E E E E E E E E
E E E E E E E E E E E E E
E E E E E E E E E E E E E
E E E E E E E E E E E E E
E E E E E E E E E E E E E
E E E E E E E E E E E E E
E E E E E E E E E E E E E
E E E E E E E E E E E E E
E E E E E E E E E E E E E
E E E E E E E E E E E E E
E E E E E E E E E E E E E
14
.2 0000 0
14
.2 0000 0
15
.1000 00
15
.1000 00
16
.00000 0
16
.00000 0
40
.40 0000
40
.4 0000 0
41
.3000 00
41
.3 0000 0
42
.2000 00
42
.2 00000
Kilometers0 50 10025
!
!
!
!
!
!
!
!
!
!
!
!
!
!
!
!
!
!
!
!
!
!
!
!
!
!
!
!
!
!
!
!
!
!
!
!
!
!
!
!
!
!
!
!
!
!
!
!
!
! !
!
!
!
!
!
!
!
!
!
!!
!
!
9
8
7
6
5
4
3
2
1
0
63
62
61
60
59
57
56
55
54
53
52
51
5049
48
47
46
45
44
43
42
41
40
39
38
37
36
34
33
32
31
30
29
27
26
25
24
23
22
21
19
18
16
15
13
12
14
.2 0000 0
14
.2 0000 0
15
.10 0000
15
.10 0000
16
.0000 00
16
.0000 00
40
.40 0000
40
.40000 0
41
.3000 00
41
.3 00000
42
.2000 00
42
.200000
a)
b)
Long E
Lat N
0 400 800 1200 1600 1800 2280 a.s.l.
meters
Tyrrhenhian Sea
A
driatic Sea
Naples
a)
Fig. 2. (a): Geographical setting and data assimilation patterns from in-situ-raingauges with
coded-station-points, and (b): TRMM-RS satellite rain data pixel centroid grid of 25 x 25 km,
superimposed on elevation data of hillshade land derived from DEM (SRTM)-90 meters
(
2.2 Rainstorm hazard problem-solving logic process
Expert systems can be designed to model processes when carried out using the IF-THEN
logic statement to impose an event contingent upon the condition (Moody & Katz, 2004).
Problem–solving logic process frameworks include first an invariant spatial model
recognizing critical-thresholds from the response ratios between the two following
components of the landscape:
- pulsing force that disturbs the system, including current rainstorm depth, and;
- resistance force, including storm variability that occurred in the system’s climate
history.
As a more concrete application, we can incorporate, for each rainy step of duration h at
sampled location s
α
, two processes into the rainstorm logic statement linking the the RHI to
the following power equation (after Diodato, 2006; Diodato & Petrucci, 2009):
α
2
α
s
1
s max : 1 48 hours
h
h
Rclim
h
RSD
RHI h
f
(1)
where RSD
h
is the Rain-Storm Depth (mm), that represents the pulsing force that disturbs
the system during an event of duration h, and:
Med 8
h wet
Rclim
f RSD h S (2)
is a function that represents the system resistance state, that is the intrinsic ability of the
system to resist change because of its history (recent and past). Med(RSD
h
) –the threshold
value – is the median of the annual maximum rainfall (mm) of duration h, and the term (8–
√h)S
wet
, is a function adjusting the threshold value with the current variation of the soil
humidity. As proxies of the soil humidity, three coefficients was introduced as S
wet
equal to
0.5, 0, and 2 according to dry, humid, and very humid soil conditions before the event,
respectively; these coefficients can be derived, in turn from remote sensing; the duration of
rainstorm (h) under square root is to explain a major accommodation of the system for
rainfall spanning over a longer period. Whereas, for each sampled location with a Rainstorm
Hazard Index (RHI)0, no-rainstorm hazard occurs, and with RHI value barely over 1, the
probability of occurrence of a rainstorm hazard commences at 0.50.
2.3 Matching coding approach for decision–making under uncertainty
While the above RHI–model is utilized to arrive at conclusions at the puntual-scale, the use
of geostatistics method may help to overcome the inherent difficulties in spatial scaling,
when the above RHI discrete data must accommodate a continuous spatial solution and data
collection across sampled- and unsampled locations. Thus, the RHI–results are converted to
a binary vector and matched to satellite rain-data under a GIS flow and supported by
indicator cokriging technique (Fig. 3).
Consider the following information obtained over the study area:
- values of the random primary variable Z (RHI), at m locations s
α
, z(s
α
), = 1,2 … n
1
;
and
- y(s) TRMM satellite rain-data at supplementary grid locations s within the area.
Indicator approach of the primary variable requires that all data be coded as local prior
probability values. Precise measurements of z
k
at hard data locations s
α
are then coded into a
set of K binary (hard) indicator data defined as:
with
α
α
1 s
s ;
0 otherwise
k
k
z z
i z
(3)
Satellite Communications158
Exploration
Spatial Data
Analysis
Weather
Hazard layers
DEM (2D-hillshade)
RHI
Indicator Coding
R
a
i
nstorms
pulsing
Raingauges
Remote
Sensing
RHI
EXPERT
SYSTEM
Precipitation
Precipitation
Geovisualizating
and
Decision Making
NCEP Reanalysis +
for Storm Climat
e
Designin
g
Synthesis
for
landscape
p
lannin
g
Cokriged
Rainstorms
Hazard Maps
W
e
Fig. 3. Flow chart of process for estimation of rainstorm hazard mapping via GIS rules.
The z–values are hard in both senses: (1) they are directly derived from measurements of
ground rainfall-data, and (2) are successively transformed into binary vector data. These
measurements are often supplemented by a relatively large amount of indirect data, such as
those conditioned on remotely sensed spectral response y(s).
Each of these data provides only indirect information about the value of the variable Z.
Using both ground and satellite information such as matching data, the approach is aimed at
assessing the probability that the value of z at any unsampled site s is greater than a given
critical z
k
value. In this way, Indicator CoKriging (ICK) is able to take into account both the
information to be processed together, and then used in the ordinary cokriging equations
(Goovaerts, 1997; Johnston et al., 2001). To account for both categorial (RHI) and continuous
(satellite data), we used standardized variables to produce composite indices compatible to
indicator cokriging (Johnston et al., 2001; Hengle et al., 2004). So that, both covariance and
cross-covariance functions were applied on the above standardized primary and auxiliary
variables for incorporating exhaustively sampled satellite data using the indicator datum that is
collocated with the location being estimated. Availability of coregionalization between
indicator ground and satellite at critical values of RHI for each location s
o
within the study area
allows a grid layer of: the hazard α(s
α
) of declaring a location vulnerable to damage by
rainstorms on the basis of the estimate
*
oIOK
;s
k
zI when actually Z(s) >
k
z = p
c
(critical
value = 1).
3. Results and Discussions
3.1 Mapping the rainstorms hazard prone-areas
Figure 4 (a,b,c) shows high-probability cokriged (p>50%) maps of areas prone to rainstorm
hazards (dark grey zones), and superimposed by areas where multiple damaging
hydrological events (MDHE) were observed. It was found that areas with high probability
of predicted hazard matched the area actually subject to injurious phenomena, such as
severe erosion, landslides, floods, and mudflows.
The severity of the damage suffered in these areas was not uniform for each rainstorm level,
i.e., the damage observed depended not only on the amount of rainfall but also on the
sensitivity of each specific landscape and on soil humidity (others topographical conditions
were not considered in this work).
Lat N
Long East
20 80400 Kilometers
14
,2
14
,2
15
,1
15
,1
16
16
40
,4
40
,4
41
,3
41
,3
42
,2
42
,2
24 Jan 2003
(24h)
Landslides
Landslides
Severe erosion
Floods
b)
Floods
Landslides
Floods
Lat N
Long East
20 80400 Kilometers
14
,2
14
,2
15
,1
15
,1
16
16
40
,4
40
,4
41
,3
41
,3
42
,2
42
,2
4-5 May 1998
(48h)
Mudflows
Flood
c)
Lat N
Long East
20 80400 Kilometers
14
,2
14
,2
15
,1
15
,1
16
16
40
,4
40
,4
41
,3
41
,3
42
,2
42
,2
14 Nov 2004
(3h)
Floods
Floods
Floods
Downpours
Floods
a)
Fig. 4. High-probability (p>50%) cokriged maps of areas prone to rainstorm hazards (dark
grey zone) for rainstorms of duration 3, 24, and 48 hours (a, b, and c, respectively). Note: the
damaging hydrological events superimposed were almost all matched by the cokriged
model.
The most extreme hydrogeomorphological processes occur over orographically complex
terrain where vegetation is sparse (especially lands that are under autumn tilling, or after
the rainy season), and where drainage systems may be obstructed by sediment erosion to
contain large volumes of runoff. Prolonged rain usually occurs during the winter season
only, when rainstorm prone-areas assume winding configurations, as for instance in Fig. 4b.
On the contrary, MDHE are more spatially limited in the warm season (May-September),
but more intensive, such as those which occurred on 14 November 2004 (Fig. 4a). Although
the event of May 4-5, 1998 was expected to be of lower intensity, because of its long
duration, the impact was catastrophic at the Sarno location (Campania region), where the
several mudflows destroyed over one hundred people (Fig. 4c). This occurred because the
meteorological perturbation originated from convective-clouds in larger systems, which are
today more dominant in rain-producing mechanisms of high-impact over small areas
(Dünkeloh & Jacobeit, 2003). This complexity is reflected in stormy pattern concentrate to
the end of summer, as it is possible observe by positive anomalies of rain amount in
Combining satellite and geospatial
technologies for exploring rainstorm hazard over Mediterranean Central Area 159
Exploration
Spatial Data
Analysis
Weather
Hazard layers
DEM (2D-hillshade)
RHI
Indicator Coding
R
a
i
nstorms
pulsing
Raingauges
Remote
Sensing
RHI
EXPERT
SYSTEM
Precipitation
Precipitation
Geovisualizating
and
Decision Making
NCEP Reanalysis +
for Storm Climat
e
Designin
g
Synthesis
for
landscape
p
lannin
g
Cokriged
Rainstorms
Hazard Maps
W
e
Fig. 3. Flow chart of process for estimation of rainstorm hazard mapping via GIS rules.
The z–values are hard in both senses: (1) they are directly derived from measurements of
ground rainfall-data, and (2) are successively transformed into binary vector data. These
measurements are often supplemented by a relatively large amount of indirect data, such as
those conditioned on remotely sensed spectral response y(s).
Each of these data provides only indirect information about the value of the variable Z.
Using both ground and satellite information such as matching data, the approach is aimed at
assessing the probability that the value of z at any unsampled site s is greater than a given
critical z
k
value. In this way, Indicator CoKriging (ICK) is able to take into account both the
information to be processed together, and then used in the ordinary cokriging equations
(Goovaerts, 1997; Johnston et al., 2001). To account for both categorial (RHI) and continuous
(satellite data), we used standardized variables to produce composite indices compatible to
indicator cokriging (Johnston et al., 2001; Hengle et al., 2004). So that, both covariance and
cross-covariance functions were applied on the above standardized primary and auxiliary
variables for incorporating exhaustively sampled satellite data using the indicator datum that is
collocated with the location being estimated. Availability of coregionalization between
indicator ground and satellite at critical values of RHI for each location s
o
within the study area
allows a grid layer of: the hazard α(s
α
) of declaring a location vulnerable to damage by
rainstorms on the basis of the estimate
*
oIOK
;s
k
zI when actually Z(s) >
k
z = p
c
(critical
value = 1).
3. Results and Discussions
3.1 Mapping the rainstorms hazard prone-areas
Figure 4 (a,b,c) shows high-probability cokriged (p>50%) maps of areas prone to rainstorm
hazards (dark grey zones), and superimposed by areas where multiple damaging
hydrological events (MDHE) were observed. It was found that areas with high probability
of predicted hazard matched the area actually subject to injurious phenomena, such as
severe erosion, landslides, floods, and mudflows.
The severity of the damage suffered in these areas was not uniform for each rainstorm level,
i.e., the damage observed depended not only on the amount of rainfall but also on the
sensitivity of each specific landscape and on soil humidity (others topographical conditions
were not considered in this work).
Lat N
Long East
20 80400 Kilometers
14
,2
14
,2
15
,1
15
,1
16
16
40
,4
40
,4
41
,3
41
,3
42
,2
42
,2
24 Jan 2003
(24h)
Landslides
Landslides
Severe erosion
Floods
b)
Floods
Landslides
Floods
Lat N
Long East
20 80400 Kilometers
14
,2
14
,2
15
,1
15
,1
16
16
40
,4
40
,4
41
,3
41
,3
42
,2
42
,2
4-5 May 1998
(48h)
Mudflows
Flood
c)
Lat N
Long East
20 80400 Kilometers
14
,2
14
,2
15
,1
15
,1
16
16
40
,4
40
,4
41
,3
41
,3
42
,2
42
,2
14 Nov 2004
(3h)
Floods
Floods
Floods
Downpours
Floods
a)
Fig. 4. High-probability (p>50%) cokriged maps of areas prone to rainstorm hazards (dark
grey zone) for rainstorms of duration 3, 24, and 48 hours (a, b, and c, respectively). Note: the
damaging hydrological events superimposed were almost all matched by the cokriged
model.
The most extreme hydrogeomorphological processes occur over orographically complex
terrain where vegetation is sparse (especially lands that are under autumn tilling, or after
the rainy season), and where drainage systems may be obstructed by sediment erosion to
contain large volumes of runoff. Prolonged rain usually occurs during the winter season
only, when rainstorm prone-areas assume winding configurations, as for instance in Fig. 4b.
On the contrary, MDHE are more spatially limited in the warm season (May-September),
but more intensive, such as those which occurred on 14 November 2004 (Fig. 4a). Although
the event of May 4-5, 1998 was expected to be of lower intensity, because of its long
duration, the impact was catastrophic at the Sarno location (Campania region), where the
several mudflows destroyed over one hundred people (Fig. 4c). This occurred because the
meteorological perturbation originated from convective-clouds in larger systems, which are
today more dominant in rain-producing mechanisms of high-impact over small areas
(Dünkeloh & Jacobeit, 2003). This complexity is reflected in stormy pattern concentrate to
the end of summer, as it is possible observe by positive anomalies of rain amount in
Satellite Communications160
September occur during the recent decade (1999-2008), compared to the climatological
period (1950-2000) (Fig. 5a).
The graph of Figure 5b also suggests that Southern Italy is subjected to a increasing
precipitation, in term of intensity and of course of hazard, within September months
spanning from 1948 to 2009. After 1996 in fact, rain rates were unusually very high, showing
an abrupt change during the last decade. This can be an important advice when RHI
modelling is used in an operative phase, where the climate information and human
experiences becoming essential for successful completion an alert forecasts.
MetEROBS
Scilla
a)
b)
1996
1940 1950 1960 1970 1980 1990 2000 2010
Year
Fig. 5. (a): Spatial pattern of the September rain anomalies (mm) during recent decade (2000-
2008) compared to climatological rain (1950-2000) upon Southern Italy (arranged from
TRMM remote sensing by NASA Earth Science Data); (b): September rain rate evolution from
1948 to 2009 for the same region (from NOAA, ESRL Physical Sciences Division
/> Acker & Leptoukh, 2007).
In this respect, the our results show that sub-regional rainstorm hazard modelling can
provide probability maps for damaging events in Italy with a spatial variability resolution of
approximately 20 km. Spatially finer estimates (e.g., at local-scale: < 10 km) can be ensured
only with the availability of more accurate and detailed supplementary satellite-rain data,
although, as noted by Anagnostou (2004), all satellite sensors are affected by errors
originating from the non-unique, non-linear relationship of rainfall characteristics to
observations and by sampling frequency and sensor resolution issues.
4. Conclusion
The model presented here provided the minimum but valuable set of data from which a
rough tool for estimating early impacts soon after rainstorms can be derived. Damaging
rainstorms collected for this retrospective experiment are documented in the category of
localized events. Impact of the damage was determined by an optimum scaling critical value
for predicting hazard prone-areas of three rainstorm types, although the RHI–model is
capable of performing with data of storms of different intensities. These first results show
that sub-regional rainstorm hazard modeling can provide probability maps for damaging
events in Italy with a spatial variability resolution of approximately 20 km. Spatially finer
estimates can be ensured only with the availability of more accurate- and detailed satellite-
rain data, or during forecast stages, if real-time monitoring is implemented on an
operational basis, where supplementary satellite information is then replaced by
Quantitative Precipitation Forecasting.
5. References
Acker J.G. & Leptoukh, G. (2007). Online analysis enhances use of NASA earth science data.
EOS Trans. AGU 88, 14–17.
Allen, M.R. & Ingram, W.J. (2002). Constraints on future changes in climate and the
hydrologic cycle. Nature 419, 224-231.
Allen, T.R.; Walsh, S.J.; Cairns, D.M., Messina, J.P., Butler, D. & Malanson, G.P. (2004).
Geostatistics and spatial analysis: Characterizing form and pattern at the Alpine
treeline. In: Geographical Information Science and Mountain Geomorphology,
Bishop, M.P. & J. F. Shroder Jr, (eds.). Springer-Praxis Publishing: Chichester, 190-
218.
Anagnostou, E.N. (2004). Overview of overland satellite rainfall estimation for hydro-
meteorological applications. Surv. Geophys., 25, 511-537.
Bacon, D.P.; Ahmad, N.N.; Dunn, T.J.; Montheit, M.C. & Sarma, A. (2008). An operational
multiscale system for hazards prediction, mapping, and response. Nat. Hazardsn 44,
317-327.
Beven, K. (2008). Models, Management and Uncertainty: The future of Hydrological Science.
In: Rivers Basins-From Hydrological Science to Water Management, I. Tchiguirinskaia,
S. Demuth, and P. Hubert (eds.), IAHS Publication No. 323 ISBN 978-1-901502-69-5,
154.
Clarke, M.L. & Rendell, H,M. (2005). Climate, extreme events and land degradation. In:
Extreme Weather Events and Public Health Responses, W. Kirch, B. Menne, and R.
Bertollini (eds.), Springer, 136-152.
Diodato, N. (2005). Geostatistical uncertainty modelling for the environmental hazard
assessment during single erosive rainstorm events. Environ. Monit. Assess. 105,
25-42, 2005.
Diodato, N. (2006). Spatial uncertainty modeling of climate processes for extreme
hydrogeomorphological events hazard monitoring. ASCE’s J. Environ. Eng. 132,
1530-1538.
Diodato, N.; Petrucci, O. & Ceccarelli, M. (2009). Rainstorm hazard problem-solving spatial-
time scale invariant process model designing. Geophys. Res. Abstracts, vol. 11,
EGU2009-4107, 2009.
Diodato, N. & Bellocchi G. (2010). Storminess and Environmental Changes in the
Mediterranean Central Area. Earth Interaction (in press).
Dünkeloh, A. & Jacobeit, J. (2003). Circulation dynamics of Mediterranean precipitation
variability 1948-1998. Int. J. Clim. 23, 1843-1866.
Goovaerts, P. (1997). Geostatistics for Natural Resources Evaluation, Oxford: Oxford University
Press.
Hengle, T.; Heuvelink, G.B.M. & Stein, A. (2004). A generic framework for spatial prediction
of soil variables based on regression-kriging. Geoderma 120, 75–93.
Heneker, T.M.; Lambert, M.F. & Kuczera, G. (2001).A point rainfall model for risk-based
design. J. Hydrol., 247, 54-71.
Combining satellite and geospatial
technologies for exploring rainstorm hazard over Mediterranean Central Area 161
September occur during the recent decade (1999-2008), compared to the climatological
period (1950-2000) (Fig. 5a).
The graph of Figure 5b also suggests that Southern Italy is subjected to a increasing
precipitation, in term of intensity and of course of hazard, within September months
spanning from 1948 to 2009. After 1996 in fact, rain rates were unusually very high, showing
an abrupt change during the last decade. This can be an important advice when RHI
modelling is used in an operative phase, where the climate information and human
experiences becoming essential for successful completion an alert forecasts.
MetEROBS
Scilla
a)
b)
1996
1940 1950 1960 1970 1980 1990 2000 2010
Year
Fig. 5. (a): Spatial pattern of the September rain anomalies (mm) during recent decade (2000-
2008) compared to climatological rain (1950-2000) upon Southern Italy (arranged from
TRMM remote sensing by NASA Earth Science Data); (b): September rain rate evolution from
1948 to 2009 for the same region (from NOAA, ESRL Physical Sciences Division
Acker & Leptoukh, 2007).
In this respect, the our results show that sub-regional rainstorm hazard modelling can
provide probability maps for damaging events in Italy with a spatial variability resolution of
approximately 20 km. Spatially finer estimates (e.g., at local-scale: < 10 km) can be ensured
only with the availability of more accurate and detailed supplementary satellite-rain data,
although, as noted by Anagnostou (2004), all satellite sensors are affected by errors
originating from the non-unique, non-linear relationship of rainfall characteristics to
observations and by sampling frequency and sensor resolution issues.
4. Conclusion
The model presented here provided the minimum but valuable set of data from which a
rough tool for estimating early impacts soon after rainstorms can be derived. Damaging
rainstorms collected for this retrospective experiment are documented in the category of
localized events. Impact of the damage was determined by an optimum scaling critical value
for predicting hazard prone-areas of three rainstorm types, although the RHI–model is
capable of performing with data of storms of different intensities. These first results show
that sub-regional rainstorm hazard modeling can provide probability maps for damaging
events in Italy with a spatial variability resolution of approximately 20 km. Spatially finer
estimates can be ensured only with the availability of more accurate- and detailed satellite-
rain data, or during forecast stages, if real-time monitoring is implemented on an
operational basis, where supplementary satellite information is then replaced by
Quantitative Precipitation Forecasting.
5. References
Acker J.G. & Leptoukh, G. (2007). Online analysis enhances use of NASA earth science data.
EOS Trans. AGU 88, 14–17.
Allen, M.R. & Ingram, W.J. (2002). Constraints on future changes in climate and the
hydrologic cycle. Nature 419, 224-231.
Allen, T.R.; Walsh, S.J.; Cairns, D.M., Messina, J.P., Butler, D. & Malanson, G.P. (2004).
Geostatistics and spatial analysis: Characterizing form and pattern at the Alpine
treeline. In: Geographical Information Science and Mountain Geomorphology,
Bishop, M.P. & J. F. Shroder Jr, (eds.). Springer-Praxis Publishing: Chichester, 190-
218.
Anagnostou, E.N. (2004). Overview of overland satellite rainfall estimation for hydro-
meteorological applications. Surv. Geophys., 25, 511-537.
Bacon, D.P.; Ahmad, N.N.; Dunn, T.J.; Montheit, M.C. & Sarma, A. (2008). An operational
multiscale system for hazards prediction, mapping, and response. Nat. Hazardsn 44,
317-327.
Beven, K. (2008). Models, Management and Uncertainty: The future of Hydrological Science.
In: Rivers Basins-From Hydrological Science to Water Management, I. Tchiguirinskaia,
S. Demuth, and P. Hubert (eds.), IAHS Publication No. 323 ISBN 978-1-901502-69-5,
154.
Clarke, M.L. & Rendell, H,M. (2005). Climate, extreme events and land degradation. In:
Extreme Weather Events and Public Health Responses, W. Kirch, B. Menne, and R.
Bertollini (eds.), Springer, 136-152.
Diodato, N. (2005). Geostatistical uncertainty modelling for the environmental hazard
assessment during single erosive rainstorm events. Environ. Monit. Assess. 105,
25-42, 2005.
Diodato, N. (2006). Spatial uncertainty modeling of climate processes for extreme
hydrogeomorphological events hazard monitoring. ASCE’s J. Environ. Eng. 132,
1530-1538.
Diodato, N.; Petrucci, O. & Ceccarelli, M. (2009). Rainstorm hazard problem-solving spatial-
time scale invariant process model designing. Geophys. Res. Abstracts, vol. 11,
EGU2009-4107, 2009.
Diodato, N. & Bellocchi G. (2010). Storminess and Environmental Changes in the
Mediterranean Central Area. Earth Interaction (in press).
Dünkeloh, A. & Jacobeit, J. (2003). Circulation dynamics of Mediterranean precipitation
variability 1948-1998. Int. J. Clim. 23, 1843-1866.
Goovaerts, P. (1997). Geostatistics for Natural Resources Evaluation, Oxford: Oxford University
Press.
Hengle, T.; Heuvelink, G.B.M. & Stein, A. (2004). A generic framework for spatial prediction
of soil variables based on regression-kriging. Geoderma 120, 75–93.
Heneker, T.M.; Lambert, M.F. & Kuczera, G. (2001).A point rainfall model for risk-based
design. J. Hydrol., 247, 54-71.
Satellite Communications162
Huffman, G.J.; Adler, R.F.; Bolvin, D.T.; Gu, G.; Nelkin, E.J.; Bowman, K.P.; Hong, Y.;
Stocker, E.F. & Wolff, D.B. (2007). The TRMM Multi-satellite Precipitation Analysis:
Quasi-Global, Multi-Year, Combined-Sensor Precipitation Estimates at Fine Scale”,
J. Hydrometeorology 8, 38-55.
Johnston, K.; Ver Hoef, J.M.; Krivoruchko, K. & Lucas, J. (2001). Using ArcGis Geostatistical
Analyst, New York: ESRI.
Kar, B. & Hodgson, M.E. (2008).A GIS-Based Model to Determine Site Suitability of
Emergency Evacuation Shelters. Trans. in GIS 12, 227–248.
Kelly, E.J.; Drake, N.A. & Barr, S.L. (2004). Spatial modelling of the terrestrial environment:
the coupling of remote sensing with spatial models. In: Spatial modelling of the
terrestrial environment, E.J. Kelly, N. A. Drake, & S.L. Barr (eds.), Wiley & Sons Ltd:
Chichester, 1-6.
Llasat, M.C.; Rigo, T. & Barriendos, M. (2003). The ‘Montserrat-2000’ flash flood event: A
comparison with the floods that have occurred in the northeast Iberian Peninsula
since the 14th century. Int. J. Climatol. 23, 453–469.
Mazzarella, M. & Diodato, N. (2002). The alluvial events in the last two Century at Sarno,
southern Italy: their classification and power-low time occurrence. Theor. App.
Climatol. 72, 75-84.
Moody, A. & Katz, D.B., (2004). Artificial intelligence in the study of mountain landscapes”,
in Geographical Information Science and Mountain Geomorphology, M. P. Bishop, M.P.,
and J. F. Shroder Jr, Ed. Springer-Praxis Publishing: Chichester, 220-251, 2004.
Pan, M.; Wood, E.F.; Wojcik, R. & McCabe, M.F. (2008). Estimation of regional terrestrial
water cycle using multi-sensor remote sensing observations and data assimilation.
Remote Sens. Environ. 112, 1282-1294.
Petrucci, O. & Polemio, M. (2003). The use of historical data for the characterisation of
multiple damaging hydrogeological events. Nat. Hazards Earth Syst. Sci., 3, 17–30.
Shoji, T. & Kitaura, H. (2006). Statistical and geostatistical analysis of rainfall in central
Japan. Comput. Geosci. 32, 1007-1024.
Sivakumar, M.V.K. (2005). Impact of natural disasters in agriculture, rangeland and forestry:
an overvie. In: Natural Disasters and Extreme Events in Agriculture, M. V. K.
Sivakumar, R. P. Motha, & H. P. Das (eds.), Springer-Verlag: Berlin, 1-22.
Su, H.; Wood, E.F.; Wang, H. & Pinker, R.T. (2008). Spatial and Temporal Scaling Behavior of
Surface Shortwave Downward Radiation Based on MODIS and In Situ Measurements.
Geosci. Rem. Sens. Lett. IEEE 5, 542-546.
Ymeti, I. (2007). Rainfall estimation by Remote Sensing for conceptual rainfall-runoff
modelling in the Upper Blue Nile basin. M.S. Thesis, International Institute for Geo-
information Science and Earth Observation, The Netherlands.
Younis, J.; Anquetin, S. & Thielen, J. (2008). The benefit of high-resolution operational
weather forecasts for flash flood warning. Hydrol. Earth Syst. Sci. 12, 1039–1051.
Design and Simulation of a DVB-S2-like Adaptive Air interface
Designed for Low Bit Rate Emergency Communications Satellite Link in Ku/Ka/Q/V Bands 163
Design and Simulation of a DVB-S2-like Adaptive Air interface Designed
for Low Bit Rate Emergency Communications Satellite Link in Ku/Ka/Q/V
Bands
Ponia Pech, Marie Robert, Alban Duverdier and Michel Bousquet
X
Design and Simulation of a DVB-S2-like
Adaptive Air interface Designed for Low Bit
Rate Emergency Communications Satellite
Link in Ku/Ka/Q/V Bands
Ponia Pech
1
, Marie Robert
2
, Alban Duverdier
2
and Michel Bousquet
3
1
TeSA,
2
CNES,
3
ISAE/SUPAERO
France
1. Introduction
Access to information is of paramount importance in emergency situations when a disaster
or a natural catastrophe (earthquakes, landslides, tsunamis, tidal wave, volcanic eruptions,
floods, cyclones, other tornados or forest fires) occurs in a given place. The rescuers must
have access to telecommunications means in order to be able to transmit critical information
(such as the number of victims, of persons needing medical assistance or to be transported
towards care centers, hospital locations, the nature of injuries, etc.) to the center that is in
charge of coordinating the heavy logistical rescue operations. However, when an extensive
area is affected (in developing countries in particular, but this holds true in first world
countries also), it is most often impossible to use some telecommunications equipments,
because of a destruction of the base stations or an unavailability of electric power. Thus, it is
an absolute priority, in order to manage a situation of post-disaster, to restore the
communications infrastructure. Three distinct and consecutive phases can be distinguished
(Pech et al., 2008):
Phase 1: This is the phase that immediately follows the disaster, where no means of
communications is available, and where minimal emergency communications must be
established as quickly as possible. This is in this phase that the very rapid deployment
(less than some hours) of a satellite system seems most suited. The ground equipments
that can be envisaged in this type of system are transportable or portable terminals, not
necessarily mobile, that can be operational everywhere between 5 and 30 minutes
without the assistance of a technical expert staff. Transmissions must be secured and
have a strong availability.
Phase 2: In a second stage, the restoration of a more elaborated communications
network involving a transportable user terminal with a higher capacity also ensuring
wireless connectivity (GSM, Wi-Fi, WiMax, etc.) is necessary to exchange more complex
information. This local infrastructure can be linked to the national telecommunications
9
Satellite Communications164
public network through a DVB-RCS-like professional satellite terminal, or an Inmarsat’s
BGAN (Global Broadband Area Network) device (Inmarsat).
Phase 3: After several weeks, even several months, once the first necessities are met and
the situation is being reestablished little by little, a restoration of the nominal
communication infrastructure can be envisaged.
Emergency satellite systems intended to address the needs of the rescue teams both in phase
1 and phase 2 have been the subject of numerous recent studies and developments, such as
for instance the FP6 WISECOM project (cf. Fig. 1) (WISECOM, 2007), diverse
standardization works TISPAN (ETSI. EG 202 339, 2004), EMTEL (ETSI. TS 102 181, TS 102
182 and TR 102 410), and ITU-R WP-4B work on wideband spreading signals (IUT-R. IUT-R
WP 4B, 2006), and research studies on UWB (Ultra Wide Band) satellite transmission carried
out with the French Space Agency (CNES - Centre Nationale d’Etudes Spatiales) and Thales
Alenia Space France (Leconte et al., 2006; Dervin, 2007). Another related research field which
has drawn much attention these last years from academia and industries alike is
telemedicine, for instance with the OURSES (French acronym meaning Offer of Services Rural
Use using Satellite) project (Girault et al., 2008; Mailhes et al., 2008).
Fig. 1. The WISECOM architecture
The present study inserts itself only within the framework of the aforementioned phase 1.
The purpose here is to propose and study a solution allowing to establish very quickly a
minimal low bit rate satellite link (in the order of several tens of kbps) in an emergency
situation, while using the available resources of the satellite, and a single-user ground
terminal with a low transmission power, a small diameter antenna, and a dedicated Tx/Rx
system, characterized by an electric consumption which shall be as low as possible (battery
or solar panels). The bi-directional transmission link is modeled within the Juzzle [4] open
source environment software with an emphasis on the return channel, deploying an
adaptive strategy based on the DVB-S2 adaptive modulation and coding (ACM) scheme.
This paper expounds the link budget dimensioning and a customized, enhanced DVB-S2 air
interface proposed to support minimal emergency communications in a severely impaired
channel environment in high frequencies; it also outlines the combined Excel/Matlab/Juzzle
high-level transmission link software simulation platform that is being developed in order
to assess the performance of the proposed transmission scheme. Focus is placed on the
underlying theoretical models involved in the simulator which follows a cross-layer
approach, integrating propagation, DVB-S2-based physical layer, and traffic components.
2. System architecture, scenario, and traffic characterization
2.1 System architecture and scenario
The proposed system architecture and scenario are as follows (Pech et al., 2008): the
emergency mission signals are superimposed with those of the primary system
characterized by a star topology, a classic multibeam, multicarrier, broadband bent-pipe
satellite operating either in Ku/Ka or Q/V-bands, and with a 120-MHz transponder (cf. Fig.
2). Thus a dedicated channel for the emergency mission is not required. The gateway has at
its disposal a bandwidth of 480 MHz, while the user links share a total bandwidth of 240
MHz, in four 120-MHz sub-bands and two polarizations, with a reuse frequency factor of 1
over 4. The frequencies used for the return link are enlisted in Table 1. Furthermore, all-IP
(Internet Protocol) architecture is assumed.
Fig. 2. System architecture
The main characteristics of the satellite are summarized in Table 2. For the emergency
mission, a set of 4 different types of user terminals is considered: two mobile user terminals
of very low transmission power (between 0.5 and 2 W), the first one (UTA) having a patch
antenna, and the second one (UTB) an omnidirectional antenna; and two deployable or
transportable user terminals: UTC is a rapidly deployable “mini-gateway” mounted on a
van, transmitting at up to 50 W, while UTD can be transported by a human user and has a
transmission power of up to 5 W.
2.2 Traffic characterization
In phase 1 of a post-disaster emergency situation, the services which are most required to be
provided as a minimum requirement are voice services, and transfer of small text or video
files (SMS - Short Message Service / MMS - Multimedia Messaging System). Special
emphasis will be laid upon Voice Over IP (VoIP), and more generally IP applications, as the
Design and Simulation of a DVB-S2-like Adaptive Air interface
Designed for Low Bit Rate Emergency Communications Satellite Link in Ku/Ka/Q/V Bands 165
public network through a DVB-RCS-like professional satellite terminal, or an Inmarsat’s
BGAN (Global Broadband Area Network) device (Inmarsat).
Phase 3: After several weeks, even several months, once the first necessities are met and
the situation is being reestablished little by little, a restoration of the nominal
communication infrastructure can be envisaged.
Emergency satellite systems intended to address the needs of the rescue teams both in phase
1 and phase 2 have been the subject of numerous recent studies and developments, such as
for instance the FP6 WISECOM project (cf. Fig. 1) (WISECOM, 2007), diverse
standardization works TISPAN (ETSI. EG 202 339, 2004), EMTEL (ETSI. TS 102 181, TS 102
182 and TR 102 410), and ITU-R WP-4B work on wideband spreading signals (IUT-R. IUT-R
WP 4B, 2006), and research studies on UWB (Ultra Wide Band) satellite transmission carried
out with the French Space Agency (CNES - Centre Nationale d’Etudes Spatiales) and Thales
Alenia Space France (Leconte et al., 2006; Dervin, 2007). Another related research field which
has drawn much attention these last years from academia and industries alike is
telemedicine, for instance with the OURSES (French acronym meaning Offer of Services Rural
Use using Satellite) project (Girault et al., 2008; Mailhes et al., 2008).
Fig. 1. The WISECOM architecture
The present study inserts itself only within the framework of the aforementioned phase 1.
The purpose here is to propose and study a solution allowing to establish very quickly a
minimal low bit rate satellite link (in the order of several tens of kbps) in an emergency
situation, while using the available resources of the satellite, and a single-user ground
terminal with a low transmission power, a small diameter antenna, and a dedicated Tx/Rx
system, characterized by an electric consumption which shall be as low as possible (battery
or solar panels). The bi-directional transmission link is modeled within the Juzzle [4] open
source environment software with an emphasis on the return channel, deploying an
adaptive strategy based on the DVB-S2 adaptive modulation and coding (ACM) scheme.
This paper expounds the link budget dimensioning and a customized, enhanced DVB-S2 air
interface proposed to support minimal emergency communications in a severely impaired
channel environment in high frequencies; it also outlines the combined Excel/Matlab/Juzzle
high-level transmission link software simulation platform that is being developed in order
to assess the performance of the proposed transmission scheme. Focus is placed on the
underlying theoretical models involved in the simulator which follows a cross-layer
approach, integrating propagation, DVB-S2-based physical layer, and traffic components.
2. System architecture, scenario, and traffic characterization
2.1 System architecture and scenario
The proposed system architecture and scenario are as follows (Pech et al., 2008): the
emergency mission signals are superimposed with those of the primary system
characterized by a star topology, a classic multibeam, multicarrier, broadband bent-pipe
satellite operating either in Ku/Ka or Q/V-bands, and with a 120-MHz transponder (cf. Fig.
2). Thus a dedicated channel for the emergency mission is not required. The gateway has at
its disposal a bandwidth of 480 MHz, while the user links share a total bandwidth of 240
MHz, in four 120-MHz sub-bands and two polarizations, with a reuse frequency factor of 1
over 4. The frequencies used for the return link are enlisted in Table 1. Furthermore, all-IP
(Internet Protocol) architecture is assumed.
Fig. 2. System architecture
The main characteristics of the satellite are summarized in Table 2. For the emergency
mission, a set of 4 different types of user terminals is considered: two mobile user terminals
of very low transmission power (between 0.5 and 2 W), the first one (UTA) having a patch
antenna, and the second one (UTB) an omnidirectional antenna; and two deployable or
transportable user terminals: UTC is a rapidly deployable “mini-gateway” mounted on a
van, transmitting at up to 50 W, while UTD can be transported by a human user and has a
transmission power of up to 5 W.
2.2 Traffic characterization
In phase 1 of a post-disaster emergency situation, the services which are most required to be
provided as a minimum requirement are voice services, and transfer of small text or video
files (SMS - Short Message Service / MMS - Multimedia Messaging System). Special
emphasis will be laid upon Voice Over IP (VoIP), and more generally IP applications, as the