Laser Welding Part 7 pot
Bạn đang xem bản rút gọn của tài liệu. Xem và tải ngay bản đầy đủ của tài liệu tại đây (10.31 MB, 20 trang )
Laser Welding114
TRIP600
V V V
DW9; DW10; DW11;
DW12
dtc1; dtc2
V V
(1)
V
DW22; DW23
QS13; QS14
V V V
DW13; DW14; DW15;
DW16
dtc5; dtc6
V V
DW18
QS7; QS8; QS9
V V QS10; QS11; QS12
V V
DW24; DW25; DW25;
DW27
QS15; QS16
Bending tests
DP800
V V
DWb19; DWb20
QSb1; QSb2
DP800+DP600
V V
(2)
DWb21
QSb3; QSb4
(1) Laser-welding using two parallel welds
(2) Tube manufacturing using tailor-welded
blanks
Legend of test nomenclature:
DW: drop-weight crush tests
DWb: drop-weight bending tests
dtc: crush tests at 250 mm/s
dtcb: bending tests at 250 mm/s
QS: quasi-static crush tests
QSb: quasi-static bending tests
Table 2. Summary of experimental program
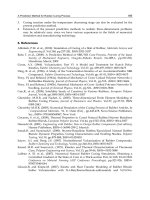
Fig. 6. Schema of set-up for bending tests
38
973
38
Fi
g
Q
u
a
6
m
m
st
r
an
co
m
ca
p
pe
Se
v
D
A
re
c
ce
n
T
h
to
p
ve
r
sp
e
ob
an
g
. 7. a), b). Detail
s
u
asi-static tests o
n
6
00kN capacity.
T
m
/s. Durin
g
the
r
ai
n
-gauge load-
c
d processed the
m
posed of indi
v
p
able of perfor
m
rformed with on
l
v
eral tests were
A
RTEC testin
g
m
c
ordin
g
of data
a
n
trall
y
and upri
g
h
e impact tests w
e
p
b
y
a fallin
g
m
r
ticall
y
on an an
v
e
cial care was ta
k
tain parallel fac
e
d the impactin
g
f
s
of tubes manuf
a
n
thi
n
-walled tu
b
T
he DARTEC ma
tests, the comp
r
c
ell and a LVDT.
measured data
f
v
idual strokes o
f
m
in
g
strokes to a
m
ly
one stroke of
9
performed at in
t
m
achine with a lo
a
a
lso made use
o
g
ht between two
e
e
re conducted o
n
m
ass, which was
v
il and hit b
y
th
e
k
en with the surf
a
e
s. This included
f
ace of the fallin
g
DP600
P (3:1)
a)
b)
a
ctured usin
g
tai
l
b
es were perfor
m
chine was opera
t
r
essive load an
d
The machine w
a
f
rom the test ma
f
90 mm displa
c
m
aximum of 10
0
9
0 mm displacem
e
t
ermediate spee
d
a
d capacit
y
of 25
0
o
f a PC. In this
e
ndplates but wi
t
n
a drop hammer
.
laterall
y
g
uide
d
e
impactor. No e
n
a
ces of the anvil,
machinin
g
the t
o
g
mass. The imp
a
D
l
or welded blank
s
m
ed on a DARTE
C
t
ed at a constant
d
displacement
w
a
s controlled b
y
a
chine. The entir
e
c
ement, as the
t
0
mm extension.
T
e
nt.
d
s of approximat
e
0
kN. The control
equipment the
s
t
hout an
y
further
.
The crush tubes
d
b
y
rails. The
s
n
d constraints
w
impactor and te
s
o
p ends of the tu
b
a
ctor used in the
D
P800
s
C
M1000 machi
n
cross-head spee
d
w
ere measured
u
a
PC that also re
c
e
crushin
g
proce
s
t
est machine wa
T
he bendin
g
test
e
l
y
250 mm/s,
u
of the test machi
n
s
pecimens were
p
support.
were impacted
a
s
pecimens were
p
w
ere provided, h
o
s
t specimens in o
r
b
es as well as th
e
d
y
namic bendi
n
DP600
n
e with
d
of 0.1
u
sin
g
a
c
orded
s
s was
s onl
y
s were
u
sing a
n
e and
p
laced
a
t their
p
laced
o
wever
r
der to
e
anvil
ng
tests
Laser welding application in crashworthiness parts 115
TRIP600
V V V
DW9; DW10; DW11;
DW12
dtc1; dtc2
V V
(1)
V
DW22; DW23
QS13; QS14
V V V
DW13; DW14; DW15;
DW16
dtc5; dtc6
V V
DW18
QS7; QS8; QS9
V V QS10; QS11; QS12
V V
DW24; DW25; DW25;
DW27
QS15; QS16
Bending tests
DP800
V V
DWb19; DWb20
QSb1; QSb2
DP800+DP600
V V
(2)
DWb21
QSb3; QSb4
(1) Laser-welding using two parallel welds
(2) Tube manufacturing using tailor-welded
blanks
Legend of test nomenclature:
DW: drop-weight crush tests
DWb: drop-weight bending tests
dtc: crush tests at 250 mm/s
dtcb: bending tests at 250 mm/s
QS: quasi-static crush tests
QSb: quasi-static bending tests
Table 2. Summary of experimental program
Fig. 6. Schema of set-up for bending tests
38
973
38
Fi
g
Q
u
a
6
m
m
st
r
an
co
m
ca
p
pe
Se
v
D
A
re
c
ce
n
T
h
to
p
ve
r
sp
e
ob
an
g
. 7. a), b). Detail
s
u
asi-static tests o
n
6
00kN capacity.
T
m
/s. Durin
g
the
r
ai
n
-gauge load-
c
d processed the
m
posed of indi
v
p
able of perform
rformed with on
l
v
eral tests were
A
RTEC testin
g
m
c
ordin
g
of data
a
n
trall
y
and upri
g
h
e impact tests w
e
p
b
y
a fallin
g
m
r
ticall
y
on an an
v
e
cial care was ta
k
tain parallel fac
e
d the impacting
f
s
of tubes manuf
a
n
thi
n
-walled tu
b
T
he DARTEC ma
tests, the comp
r
c
ell and a LVDT.
measured data
f
v
idual strokes o
f
m
ing strokes to a
m
ly
one stroke of
9
performed at in
t
m
achine with a lo
a
a
lso made use
o
g
ht between two
e
e
re conducted o
n
m
ass, which was
v
il and hit b
y
th
e
k
en with the surf
a
e
s. This included
f
ace of the fallin
g
DP600
P (3:1)
a)
b)
a
ctured usin
g
tai
l
b
es were perfor
m
chine was opera
t
r
essive load an
d
The machine w
a
f
rom the test ma
f
90 mm displa
c
m
aximum of 100
9
0 mm displacem
e
t
ermediate spee
d
a
d capacit
y
of 25
0
o
f a PC. In this
e
ndplates but wi
t
n
a drop hammer
.
laterall
y
g
uide
d
e
impactor. No e
n
a
ces of the anvil,
machinin
g
the t
o
g
mass. The imp
a
D
l
or welded blank
s
m
ed on a DARTE
C
t
ed at a constant
d
displacement
w
a
s controlled b
y
a
chine. The entir
e
c
ement, as the
t
0
mm extension.
T
e
nt.
d
s of approximat
e
0
kN. The control
equipment the
s
t
hout an
y
further
.
The crush tubes
d
b
y
rails. The
s
n
d constraints
w
impactor and te
s
o
p ends of the tu
b
a
ctor used in the
D
P800
s
C
M1000 machi
n
cross-head spee
d
w
ere measured
u
a
PC that also re
c
e
crushin
g
proce
s
t
est machine wa
T
he bending test
e
l
y
250 mm/s,
u
of the test machi
n
s
pecimens were
p
support.
were impacted
a
s
pecimens were
p
w
ere provided, h
o
s
t specimens in o
r
b
es as well as th
e
dynamic bendin
DP600
n
e with
d
of 0.1
u
sin
g
a
c
orded
s
s was
s onl
y
s were
u
sing a
n
e and
p
laced
a
t their
p
laced
o
wever
r
der to
e
anvil
ng
tests
Laser Welding116
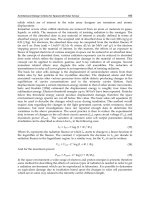
had a cylindrical end with a 38mm diameter and a support for the tubes as presented in
figure 6.
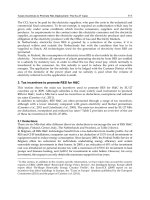
The dynamic tests were carried out at test energies ranging from 0.575 to 14.270 kJ. Different
test energies were obtained changing the drop height and the impact mass. Figure 8 shows
the drop hammer rig as well as associated instrumentation, test supports and specimens. A
Laser-Doppler velocimeter was used to obtain the velocity-time history during the dynamic
tests. It was then possible to obtain the load-time, displacement-time and load-displacement
histories. From these data, the axial displacement, or crushing distance, as well as the
displacement averaged mean load values may be calculated.
a) b)
Fig. 8. a) Drop-hammer rig and instrumentation (recording camera on the left); b) Image of
drop-hammer rig with Laser-Doppler velocimeter in the foreground.
The crushing tests of tubes were used to determine of maximum crushing force P
máx
, mean
crushing force P
m
, absorbed energy E
a
, as well as to perform a qualitative analysis of the
crushing behaviour that included the number of lobes formed, types of lobes, and collapse
type. The specimens were accurately measured prior to and after testing. The total crushing
distance
was measured as the difference of the height of the specimen before and after
testing. The recorded force-displacement curves obtained in the DARTEC tests were
integrated with respect to the deflection
to determine the mean crushing force. The mean
load P
m
was then calculated using the expression:
a
m
f
E
P
(1)
where
f
is the final deflection. The mean load is an indication of the energy-absorbing
ability of a structure, when compared to the axial displacement required to absorb that
energy. Subsequently, the mean load and absorbed energy were also calculated for
prescribed displacement values. The maximum crushing force was determined from the
load curves. However, this value is only reliably obtained in the quasi-static tests since
inertia effects and fluctuations in the initial load peak exist in the dynamic tests which
makes accurate recording difficult.
In the dynamic tests the velocity-time readings obtained with the Laser-Doppler velocimeter
were differentiated and integrated to obtain the load-time, displacement-time and load-
displacement histories. From these data, the axial displacement, or crushing distance, as
well as the displacement averaged mean load values may be calculated using the absorbed
energy in the same manner as with the quasi-static tests.
In general, the spot-welds resisted well the loading and deformations. Besides localised
material fracture, only in a few tubes and in a few locations, spot-welds were halfway torn
apart. Laser welds only presented problems for the TRIP600 steel. Only in a few of the top-
hat tubes manufactured with this material it was possible to obtain regular progressive
folding without separation of the hat-section and closeout panel. However, the hexagonal
laser-welded sections and the spot-welded tubes manufactured with TRIP600 did not
present that problem.
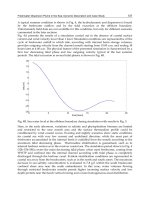
The analysis of results of energy absorption properties should consider the folding
behaviour and its initiation. Generally, the dynamic tube crushing tests made use of
initiators or triggers in the form of indentations in the tubes. These worked satisfactorily in
the dynamic tests, providing an efficient initialisation of the crushing process near the top of
the specimen (proximal face to the impact mass). This feature could be observed from the
camera recordings. Figures 9 and 10 present examples of the initiation of folding. The
images were obtained with the recording camera rotated for best resolution within the test
area.
Fig. 9. Initial sequence of crushing of a hexagonal tube
Generally, buckling was initiated at the proximal face of the specimens and progressed
towards the distal end. However, in some cases, there was a simultaneous initiation of
folding at both ends with a plastic buckle being developed near the distal end of the
specimen. This buckle generally remained stable during further deformation of the
specimen, which could be attributed to the contribution of the triggers at the opposite end of
the specimens. In some of the tests with spot-welded tubes this buckle caused a near-
simultaneous progression of the crushing process from both ends, or also instability towards
the end of the deformation process. Since the spot-welded tube did not have triggers this
occurrence is attributed to the competition between both ends in the contribution to the
deformation process. In figure 10 this occurrence is also observed.
Laser welding application in crashworthiness parts 117
had a cylindrical end with a 38mm diameter and a support for the tubes as presented in
figure 6.
The dynamic tests were carried out at test energies ranging from 0.575 to 14.270 kJ. Different
test energies were obtained changing the drop height and the impact mass. Figure 8 shows
the drop hammer rig as well as associated instrumentation, test supports and specimens. A
Laser-Doppler velocimeter was used to obtain the velocity-time history during the dynamic
tests. It was then possible to obtain the load-time, displacement-time and load-displacement
histories. From these data, the axial displacement, or crushing distance, as well as the
displacement averaged mean load values may be calculated.
a) b)
Fig. 8. a) Drop-hammer rig and instrumentation (recording camera on the left); b) Image of
drop-hammer rig with Laser-Doppler velocimeter in the foreground.
The crushing tests of tubes were used to determine of maximum crushing force P
máx
, mean
crushing force P
m
, absorbed energy E
a
, as well as to perform a qualitative analysis of the
crushing behaviour that included the number of lobes formed, types of lobes, and collapse
type. The specimens were accurately measured prior to and after testing. The total crushing
distance
was measured as the difference of the height of the specimen before and after
testing. The recorded force-displacement curves obtained in the DARTEC tests were
integrated with respect to the deflection
to determine the mean crushing force. The mean
load P
m
was then calculated using the expression:
a
m
f
E
P
(1)
where
f
is the final deflection. The mean load is an indication of the energy-absorbing
ability of a structure, when compared to the axial displacement required to absorb that
energy. Subsequently, the mean load and absorbed energy were also calculated for
prescribed displacement values. The maximum crushing force was determined from the
load curves. However, this value is only reliably obtained in the quasi-static tests since
inertia effects and fluctuations in the initial load peak exist in the dynamic tests which
makes accurate recording difficult.
In the dynamic tests the velocity-time readings obtained with the Laser-Doppler velocimeter
were differentiated and integrated to obtain the load-time, displacement-time and load-
displacement histories. From these data, the axial displacement, or crushing distance, as
well as the displacement averaged mean load values may be calculated using the absorbed
energy in the same manner as with the quasi-static tests.
In general, the spot-welds resisted well the loading and deformations. Besides localised
material fracture, only in a few tubes and in a few locations, spot-welds were halfway torn
apart. Laser welds only presented problems for the TRIP600 steel. Only in a few of the top-
hat tubes manufactured with this material it was possible to obtain regular progressive
folding without separation of the hat-section and closeout panel. However, the hexagonal
laser-welded sections and the spot-welded tubes manufactured with TRIP600 did not
present that problem.
The analysis of results of energy absorption properties should consider the folding
behaviour and its initiation. Generally, the dynamic tube crushing tests made use of
initiators or triggers in the form of indentations in the tubes. These worked satisfactorily in
the dynamic tests, providing an efficient initialisation of the crushing process near the top of
the specimen (proximal face to the impact mass). This feature could be observed from the
camera recordings. Figures 9 and 10 present examples of the initiation of folding. The
images were obtained with the recording camera rotated for best resolution within the test
area.
Fig. 9. Initial sequence of crushing of a hexagonal tube
Generally, buckling was initiated at the proximal face of the specimens and progressed
towards the distal end. However, in some cases, there was a simultaneous initiation of
folding at both ends with a plastic buckle being developed near the distal end of the
specimen. This buckle generally remained stable during further deformation of the
specimen, which could be attributed to the contribution of the triggers at the opposite end of
the specimens. In some of the tests with spot-welded tubes this buckle caused a near-
simultaneous progression of the crushing process from both ends, or also instability towards
the end of the deformation process. Since the spot-welded tube did not have triggers this
occurrence is attributed to the competition between both ends in the contribution to the
deformation process. In figure 10 this occurrence is also observed.
Laser Welding118
Fig. 10. Initial sequence of crushing of a top-hat tube
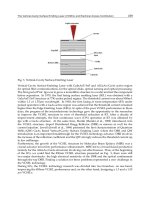
Fig. 11. Absorbed energies for DP600, top-hat geometry, spot welding
Fig. 12. Absorbed energies for DP600, top-hat geometry, laser welding
0
500
1000
1500
2000
2500
3000
3500
E50 E90
Energy (J)
QS1;QS2;QS3
dtc-3; dtc-4
DW7;DW8
0
500
1000
1500
2000
2500
3000
3500
E50 E90
Energy (J)
QS4;QS5
dtc-7; dtc-8
DW1;DW2
Several features can be observed from the results that allow a comparison of different
materials, geometries and welding processes. This analysis can be performed by comparing
the absorbed energies at prescribed displacements, in this case energies at 50mm and 90mm
of crushing length. This analysis is important since the absorption of energy and its
management are critical to obtain crashworthy structures. In figures 11 to 13 examples of
absorbed energies at different crushing lengths (E
50
; E
90
) and different test velocities are
presented. In these cases an increase of absorbed energies for impact loading is observed
which was expected when considering inertia and strain rate effects.
Fig. 13. Absorbed energies for TRIP600, hexagonal geometry, laser welding
a) quasi-static crush tests b) dynamic crush tests
Fig. 14. Comparison of absorbed energies for spot-welded (SW) and laser welded(LW) top-
hat tubes (DP600)
One of the observed characteristics in this study was the differences between spot-welded
and laser welded connections used in the manufacturing process of the tubes. Figures 14
and 15 present a graphical comparison of absorbed energies in tubes manufactured using
the two processes. The moderate increase in the amount of absorbed energy for a given
0
2500
5000
7500
10000
E50 E90
Energy (J)
QS10;QS11;QS12
dtc-5; dtc-6
DW14;DW15;DW16
0
500
1000
1500
2000
2500
3000
E50 E90
Energy (J)
QS1;QS2 (SW)
QS4;QS5;QS6 (LW)
0
500
1000
1500
2000
2500
3000
3500
E50 E90
Energy (J)
DW7;DW8 (SW)
DW1;DW2 (LW)
Laser welding application in crashworthiness parts 119
Fig. 10. Initial sequence of crushing of a top-hat tube
Fig. 11. Absorbed energies for DP600, top-hat geometry, spot welding
Fig. 12. Absorbed energies for DP600, top-hat geometry, laser welding
0
500
1000
1500
2000
2500
3000
3500
E50 E90
Energy (J)
QS1;QS2;QS3
dtc-3; dtc-4
DW7;DW8
0
500
1000
1500
2000
2500
3000
3500
E50 E90
Energy (J)
QS4;QS5
dtc-7; dtc-8
DW1;DW2
Several features can be observed from the results that allow a comparison of different
materials, geometries and welding processes. This analysis can be performed by comparing
the absorbed energies at prescribed displacements, in this case energies at 50mm and 90mm
of crushing length. This analysis is important since the absorption of energy and its
management are critical to obtain crashworthy structures. In figures 11 to 13 examples of
absorbed energies at different crushing lengths (E
50
; E
90
) and different test velocities are
presented. In these cases an increase of absorbed energies for impact loading is observed
which was expected when considering inertia and strain rate effects.
Fig. 13. Absorbed energies for TRIP600, hexagonal geometry, laser welding
a) quasi-static crush tests b) dynamic crush tests
Fig. 14. Comparison of absorbed energies for spot-welded (SW) and laser welded(LW) top-
hat tubes (DP600)
One of the observed characteristics in this study was the differences between spot-welded
and laser welded connections used in the manufacturing process of the tubes. Figures 14
and 15 present a graphical comparison of absorbed energies in tubes manufactured using
the two processes. The moderate increase in the amount of absorbed energy for a given
0
2500
5000
7500
10000
E50 E90
Energy (J)
QS10;QS11;QS12
dtc-5; dtc-6
DW14;DW15;DW16
0
500
1000
1500
2000
2500
3000
E50 E90
Energy (J)
QS1;QS2 (SW)
QS4;QS5;QS6 (LW)
0
500
1000
1500
2000
2500
3000
3500
E50 E90
Energy (J)
DW7;DW8 (SW)
DW1;DW2 (LW)
Laser Welding120
crush distance in laser welded connections was expected, considering previously published
results. However, in figure 14-b) it is observed that at higher impact speeds the spot-welded
tubes absorbed a higher amount of energy. This was not observed for TRIP600 steel,
although with this material the difference in absorbed energies between spot-welded and
laser welded tubes in dynamic crush testing was very small. It is possible that at impact
loading the continuous connection obtained using laser welds has undergone some local
separation although this was not observed in the tests considered for this analysis.
a) quasi-static crush tests b) dynamic crush tests
Fig. 15. Comparison of absorbed energies for spot-welded (SW) and laser welded (LW) top-
hat tubes (TRIP600)
Another observed feature in the experimental tests was the efficiency of different sections
for the purpose of energy absorption. This was possible in the tests of the TRIP600 material
where the specific absorbed energies of top-hat and hexagonal sections were compared.
Figure 16 presents results of that comparison. A remarkable increase in absorbed energy per
unit weight is observed for hexagonal sections. This was expected considering existing
results in the available literature (Auto/Steel Partnership, 1998) where the difference in the
average static crush force between top-hat and hexagonal tubes having the same mass was
of approximately 40%. In the present tests the increase in the average static crush force was
of approximately 32% with the increase in the absorbed energies E
50
and E
90
ranging from
32.9 to 37.4 % in the quasi-static tests and 29.6 to 35.5% in the dynamic tests. This increase in
the efficiency of the energy absorption is expected considering that thin-walled cylindrical
shells have more efficient folding modes and that octagonal and hexagonal thin-walled
sections are closer to the more efficient circular shape than top-hat sections.
In figure 17 a comparison of specific absorbed energies of DP600 and TRIP600 is presented,
based in tests using the same geometry (top-hat). A noticeable increase in specific absorbed
energy is observed for the TRIP600 material, in both quasi-static and dynamic tests. This
difference can be attributed to the higher strain hardening and strength properties and also
the higher elongation to fracture that implies a higher area under the stress-strain curve,
which is directly related with energy absorption. However, it should be noted that the tests
were performed in tubes manufactured using steel sheets with different thicknesses, which
might induce differences in the folding process with consequences in the absorbed energy.
0
1000
2000
3000
4000
5000
6000
E50 E90
Energy (J)
QS16 (SW)
QS13;QS14 (LW)
0
1000
2000
3000
4000
5000
6000
E50
Energy (J)
DW24;DW25;DW26;DW27 (SW)
DW22;DW23 (LW)
a) quasi-static crush tests b) dynamic crush tests
Fig. 16. Comparison of specific absorbed energies for top-hat and hexagonal tubes (TRIP600)
a) quasi-static crush tests b) dynamic crush tests
Fig. 17. Comparison of specific absorbed energies for DP600 and TRIP600 steels using top-
hat geometry
The available data for bending tests allows the evaluation of some features. In figure 18 a
comparison of quasi-static and dynamic absorbed energies is presented for the tubes
manufactured using tailor-welded blanks. As expected a slight increase is observed for the
dynamic case. Figure 19 presents a comparison of specific absorbed energies (E
50
and total
absorbed energy) between the tubes made of DP800 steel and the ones manufactured using
tailor welded blanks (that use DP600 and DP800 steel grades). The tubes manufactured
using tailor-welded blanks are more efficient because the plastic deformation is localized in
the central area where the striker impacts the tube.
0
2000
4000
6000
8000
10000
12000
E50 E90
Specific Energy (J/kg)
QS13;QS14 (Top-hat; LW)
QS15;QS16 (Top-hat; SW)
QS10;QS11;QS12 (Hexagonal; LW)
0
2000
4000
6000
8000
10000
12000
E50 E90
Specific Energy (J/kg)
DW22;DW23 (Top-hat; LW)
DW24;DW25;DW26;DW27 (Top-hat; SW)
DW14;DW15;DW16 (Hexagonal; LW)
0
500
1000
1500
2000
2500
3000
3500
4000
4500
E50 E90
Specific Energy (J/kg)
QS1;QS2;QS3 (DP600)
QS16 (TRIP600)
0
1000
2000
3000
4000
5000
6000
7000
8000
E50 E90
Specific Energy (J/kg)
DW5;DW6 (DP600)
DW7;DW8 (DP600)
DW24;DW25;DW26;DW27 (TRIP600)
Laser welding application in crashworthiness parts 121
crush distance in laser welded connections was expected, considering previously published
results. However, in figure 14-b) it is observed that at higher impact speeds the spot-welded
tubes absorbed a higher amount of energy. This was not observed for TRIP600 steel,
although with this material the difference in absorbed energies between spot-welded and
laser welded tubes in dynamic crush testing was very small. It is possible that at impact
loading the continuous connection obtained using laser welds has undergone some local
separation although this was not observed in the tests considered for this analysis.
a) quasi-static crush tests b) dynamic crush tests
Fig. 15. Comparison of absorbed energies for spot-welded (SW) and laser welded (LW) top-
hat tubes (TRIP600)
Another observed feature in the experimental tests was the efficiency of different sections
for the purpose of energy absorption. This was possible in the tests of the TRIP600 material
where the specific absorbed energies of top-hat and hexagonal sections were compared.
Figure 16 presents results of that comparison. A remarkable increase in absorbed energy per
unit weight is observed for hexagonal sections. This was expected considering existing
results in the available literature (Auto/Steel Partnership, 1998) where the difference in the
average static crush force between top-hat and hexagonal tubes having the same mass was
of approximately 40%. In the present tests the increase in the average static crush force was
of approximately 32% with the increase in the absorbed energies E
50
and E
90
ranging from
32.9 to 37.4 % in the quasi-static tests and 29.6 to 35.5% in the dynamic tests. This increase in
the efficiency of the energy absorption is expected considering that thin-walled cylindrical
shells have more efficient folding modes and that octagonal and hexagonal thin-walled
sections are closer to the more efficient circular shape than top-hat sections.
In figure 17 a comparison of specific absorbed energies of DP600 and TRIP600 is presented,
based in tests using the same geometry (top-hat). A noticeable increase in specific absorbed
energy is observed for the TRIP600 material, in both quasi-static and dynamic tests. This
difference can be attributed to the higher strain hardening and strength properties and also
the higher elongation to fracture that implies a higher area under the stress-strain curve,
which is directly related with energy absorption. However, it should be noted that the tests
were performed in tubes manufactured using steel sheets with different thicknesses, which
might induce differences in the folding process with consequences in the absorbed energy.
0
1000
2000
3000
4000
5000
6000
E50 E90
Energy (J)
QS16 (SW)
QS13;QS14 (LW)
0
1000
2000
3000
4000
5000
6000
E50
Energy (J)
DW24;DW25;DW26;DW27 (SW)
DW22;DW23 (LW)
a) quasi-static crush tests b) dynamic crush tests
Fig. 16. Comparison of specific absorbed energies for top-hat and hexagonal tubes (TRIP600)
a) quasi-static crush tests b) dynamic crush tests
Fig. 17. Comparison of specific absorbed energies for DP600 and TRIP600 steels using top-
hat geometry
The available data for bending tests allows the evaluation of some features. In figure 18 a
comparison of quasi-static and dynamic absorbed energies is presented for the tubes
manufactured using tailor-welded blanks. As expected a slight increase is observed for the
dynamic case. Figure 19 presents a comparison of specific absorbed energies (E
50
and total
absorbed energy) between the tubes made of DP800 steel and the ones manufactured using
tailor welded blanks (that use DP600 and DP800 steel grades). The tubes manufactured
using tailor-welded blanks are more efficient because the plastic deformation is localized in
the central area where the striker impacts the tube.
0
2000
4000
6000
8000
10000
12000
E50 E90
Specific Energy (J/kg)
QS13;QS14 (Top-hat; LW)
QS15;QS16 (Top-hat; SW)
QS10;QS11;QS12 (Hexagonal; LW)
0
2000
4000
6000
8000
10000
12000
E50 E90
Specific Energy (J/kg)
DW22;DW23 (Top-hat; LW)
DW24;DW25;DW26;DW27 (Top-hat; SW)
DW14;DW15;DW16 (Hexagonal; LW)
0
500
1000
1500
2000
2500
3000
3500
4000
4500
E50 E90
Specific Energy (J/kg)
QS1;QS2;QS3 (DP600)
QS16 (TRIP600)
0
1000
2000
3000
4000
5000
6000
7000
8000
E50 E90
Specific Energy (J/kg)
DW5;DW6 (DP600)
DW7;DW8 (DP600)
DW24;DW25;DW26;DW27 (TRIP600)
Laser Welding122
Fig. 18. Comparison of absorbed energies for bending tests of tailor welded tubes tested
quasi-statically and dynamically.
Fig. 19. Comparison of specific absorbed energies in bending tests of tubes manufactured
using DP800 steel and tailor-welded blanks (DP600 and DP800 steel).
3.2 Application of laser welding in the development of components with localized
thermal triggers
This section presents results of a study aimed at developing an approach consisting of local
heating of aluminium alloy structures with the purpose of introducing a local modification
of material properties. The main objective of this approach is the management of crash-
energy absorption in a cost effective manner through the introduction of triggers: by local
heating in areas chosen for triggers, local softening of aluminium can be induced thus
0
100
200
300
400
500
600
700
E50 Etot
Energy (J)
QSb3;QSb4
DWb21
0
50
100
150
200
250
E50 Etot
Specific energy (J/kg)
QSb1; QSb2
QSb3; QSb4
fo
r
de
R
e
al
u
(L
e
o
n
T
h
pr
o
fa
i
be
i
m
ad
w
h
li
k
or
i
In
de
si
m
co
m
co
m
T
h
m
a
of
or
i
d
o
in
d
tri
g
st
r
m
i
sh
o
sh
o
in
al
s
Fi
g
pl
a
r
cin
g
the tubula
r
formation i
n
the
e
search studies
u
minium tubin
g
e
e et al., 1999). T
h
n
number, shape,
h
e concept of us
i
o
vide for a lar
g
i
lure. Thus fract
u
accordin
g
l
y
i
n
m
plementation c
o
vanta
g
eous use
h
ich in the pres
e
k
e stren
g
th, wor
k
ig
inall
y
presente
d
particular, the
b
liberatel
y
impos
i
m
ulation tools c
a
m
bined simulat
i
m
ponent sub
j
ect
e
h
is stud
y
prese
n
a
terial properties
this research w
o
ig
inated
f
rom i
m
o
ne b
y
CO2 laser
d
uce a micro str
u
gg
ers of the fol
r
uctures. It is
w
i
crostructure wit
o
w the behavior
o
w
n
that with te
m
the microstruct
u
s
o an important f
a
g
. 20 – a) AA 60
6
a
stic behaviour u
r
structure to i
n
mode of hi
g
hest
have reported
a
b
y
artificiall
y
in
t
h
e absorbed ene
r
and location of t
r
i
n
g
thermal mo
d
g
er
g
lobal defor
m
u
re in critical re
gi
n
creased. Such
o
mpared to t
h
of aluminium is
e
nt context is de
f
k
hardenin
g
an
d
d
(B
j
ørneklett &
M
b
ucklin
g
of cras
h
i
n
g
local soft zo
n
a
n be used to a
s
i
on of the ther
m
e
d to d
y
namic lo
a
n
ts preliminar
y
r
and microstruct
u
o
rk is to impro
v
m
pact in tubular
weldin
g
techno
l
u
ctural modificat
i
din
g
process in
w
ell known that
h heat-treatmen
t
of this material
m
perature betw
e
u
re with decreas
e
a
ctor bein
g
the t
e
a)
6
0 T5 True stress
–
sed in the nume
r
n
itiate deformati
o
ener
gy
absorpti
o
a
ttempts to im
p
t
roducin
g
vario
u
rgy
and crushin
g
r
i
gg
erin
g
dents b
y
d
ification of an
a
m
ation o
f
a par
t
i
ons can be dela
y
desi
g
n featur
e
h
e alter
n
ative
p
therefore possi
b
f
ined as controll
e
d
ductilit
y
b
y
m
My
hr, 2003).
h
boxes durin
g
a
n
es (i.e. thermall
y
s
sess crashwort
h
m
al processin
g
a
a
din
g
.
r
esults of temp
e
u
re of a selected
v
e the crushin
g
components. T
h
l
o
gy
applied as
a
i
on caused b
y
th
e
the pro
g
ressiv
e
the 6060-T5 al
u
t
. Technical lite
r
at different tem
p
e
en 250 º C and 5
5
e
on hardness.
I
e
mperature and t
i
–
strain curve an
d
r
ical simulations.
o
n in prescribe
d
o
n.
p
rove ener
gy
a
b
s t
y
pes of tri
gg
e
r
morpholo
gy
we
y
usin
g
compute
r
a
luminium allo
y
t
and hi
g
her en
e
y
ed and the total
e
s are also hi
g
p
rocess of
g
eo
m
b
le b
y
appl
y
in
g
“
e
d manipulatio
n
m
eans of non-h
o
a
crash situation
induced tri
gg
er
s
h
iness performa
n
a
nd subsequent
e
rature and hea
t
6060-T5 alumini
u
stabilit
y
and th
e
h
e improvement
a
local heat treat
m
e
heatin
g
in pred
e
e
impact ener
gy
u
minum allo
y
s
u
r
ature presents
d
p
eratures and h
e
5
0 º C there is a
s
I
t should be me
n
i
me interdepend
e
d
on the heat aff
e
d
locations and
b
sorption of ex
t
r
in
g
dents (Kim,
re anal
y
zed dep
e
r
simulation.
in localized are
e
r
gy
absorption
ener
gy
absorpti
o
g
hl
y
cost-effect
i
m
etric redesi
g
n
.
“
local material d
e
n
of material pro
p
o
mo
g
enous heat
i
ma
y
be control
l
s
). For the impac
t
n
ce and even e
n
response in th
e
t
in
g
c
y
cle influe
n
u
m allo
y
. The o
b
e
absorption of
e
of the deforma
t
m
ent. This proce
e
fined zones tha
t
absorption of t
u
u
ffers modificati
o
d
ifferent dia
g
ra
m
e
at-c
y
cle duratio
n
s
i
g
nificant modif
i
n
tioned that the
t
e
nt
b)
e
cted zone; b) M
o
assure
t
ruded
2002);
e
ndin
g
as can
before
o
n can
i
ve in
.
This
e
si
g
n”,
p
erties
i
n
g
, as
l
ed b
y
t
event
n
able a
e
final
n
ce in
bj
ective
e
ner
gy
t
ion is
ss will
t
act as
u
bular
o
ns in
m
s that
n
. It is
i
cation
t
ime is
o
del of
Laser welding application in crashworthiness parts 123
Fig. 18. Comparison of absorbed energies for bending tests of tailor welded tubes tested
quasi-statically and dynamically.
Fig. 19. Comparison of specific absorbed energies in bending tests of tubes manufactured
using DP800 steel and tailor-welded blanks (DP600 and DP800 steel).
3.2 Application of laser welding in the development of components with localized
thermal triggers
This section presents results of a study aimed at developing an approach consisting of local
heating of aluminium alloy structures with the purpose of introducing a local modification
of material properties. The main objective of this approach is the management of crash-
energy absorption in a cost effective manner through the introduction of triggers: by local
heating in areas chosen for triggers, local softening of aluminium can be induced thus
0
100
200
300
400
500
600
700
E50 Etot
Energy (J)
QSb3;QSb4
DWb21
0
50
100
150
200
250
E50 Etot
Specific energy (J/kg)
QSb1; QSb2
QSb3; QSb4
fo
r
de
R
e
al
u
(L
e
o
n
T
h
pr
o
fa
i
be
i
m
ad
w
h
lik
or
i
In
de
si
m
co
m
co
m
T
h
m
a
of
or
i
d
o
in
d
tri
g
st
r
m
i
sh
o
sh
o
in
al
s
Fi
g
pl
a
r
cin
g
the tubula
r
formation i
n
the
e
search studies
u
minium tubin
g
e
e et al., 1999). T
h
n
number, shape,
h
e concept of us
i
o
vide for a lar
g
i
lure. Thus fract
u
accordin
g
l
y
i
n
m
plementation c
o
vanta
g
eous use
h
ich in the pres
e
k
e strength, wor
k
ig
inall
y
presente
d
particular, the
b
liberatel
y
impos
i
m
ulation tools c
a
m
bined simulat
i
m
ponent sub
j
ect
e
h
is stud
y
prese
n
a
terial properties
this research w
o
ig
inated
f
rom i
m
o
ne by CO2 laser
d
uce a micro str
u
gg
ers of the fol
r
uctures. It is
w
i
crostructure wit
o
w the behavior
o
w
n
that with te
m
the microstruct
u
s
o an important f
a
g
. 20 – a) AA 60
6
a
stic behaviour u
r
structure to i
n
mode of hi
g
hest
have reported
a
b
y
artificiall
y
in
t
h
e absorbed ene
r
and location of t
r
i
n
g
thermal mo
d
g
er
g
lobal defor
m
u
re in critical re
gi
n
creased. Such
o
mpared to t
h
of aluminium is
e
nt context is de
f
k
hardening an
d
d
(B
j
ørneklett &
M
b
ucklin
g
of cras
h
i
n
g
local soft zo
n
a
n be used to a
s
i
on of the ther
m
e
d to d
y
namic lo
a
n
ts preliminar
y
r
and microstruct
u
o
rk is to impro
v
m
pact in tubular
welding techno
l
u
ctural modificat
i
din
g
process in
w
ell known that
h heat-treatmen
t
of this material
m
perature betw
e
u
re with decreas
e
a
ctor bein
g
the t
e
a)
6
0 T5 True stress
–
sed in the nume
r
n
itiate deformati
o
ener
gy
absorpti
o
a
ttempts to im
p
t
roducin
g
vario
u
rgy
and crushin
g
r
i
gg
erin
g
dents b
y
d
ification of an
a
m
ation o
f
a par
t
i
ons can be dela
y
desi
g
n featur
e
h
e alter
n
ative
p
therefore possi
b
f
ined as controll
e
d
ductility by
m
My
hr, 2003).
h
boxes durin
g
a
n
es (i.e. thermall
y
s
sess crashwort
h
m
al processin
g
a
a
din
g
.
r
esults of temp
e
u
re of a selected
v
e the crushin
g
components. T
h
l
ogy applied as
a
i
on caused b
y
th
e
the pro
g
ressiv
e
the 6060-T5 al
u
t
. Technical lite
r
at different tem
p
e
en 250 º C and 5
5
e
on hardness.
I
e
mperature and t
i
–
strain curve an
d
r
ical simulations.
o
n in prescribe
d
o
n.
p
rove ener
gy
a
b
s t
y
pes of tri
gg
e
r
morpholo
gy
we
y
usin
g
compute
r
a
luminium allo
y
t
and hi
g
her en
e
y
ed and the total
e
s are also hi
g
p
rocess of
g
eo
m
b
le b
y
appl
y
in
g
“
e
d manipulatio
n
m
eans of non-h
o
a
crash situation
induced tri
gg
er
s
h
iness performa
n
a
nd subsequent
e
rature and hea
t
6060-T5 alumini
u
stabilit
y
and th
e
h
e improvement
a
local heat treat
m
e
heatin
g
in pred
e
e
impact ener
gy
u
minum allo
y
s
u
r
ature presents
d
p
eratures and h
e
5
0 º C there is a
s
I
t should be me
n
i
me interdepend
e
d
on the heat aff
e
d
locations and
b
sorption of ex
t
r
in
g
dents (Kim,
re anal
y
zed dep
e
r
simulation.
in localized are
e
r
gy
absorption
ener
gy
absorpti
o
g
hl
y
cost-effect
i
m
etric redesi
g
n
.
“
local material d
e
n
of material pro
p
o
mogenous heati
ma
y
be control
l
s
). For the impac
t
n
ce and even e
n
response in th
e
t
in
g
c
y
cle influe
n
u
m allo
y
. The o
b
e
absorption of
e
of the deforma
t
m
ent. This proce
e
fined zones tha
t
absorption of t
u
u
ffers modificati
o
d
ifferent dia
g
ra
m
e
at-c
y
cle duratio
n
s
i
g
nificant modif
i
n
tioned that the
t
e
nt
b)
e
cted zone; b) M
o
assure
t
ruded
2002);
e
ndin
g
as can
before
o
n can
i
ve in
.
This
e
si
g
n”,
p
erties
i
ng, as
l
ed b
y
t
event
n
able a
e
final
n
ce in
bj
ective
e
ner
gy
t
ion is
ss will
t
act as
u
bular
o
ns in
m
s that
n
. It is
i
cation
t
ime is
o
del of
Laser Welding124
T
h
te
s
m
a
T
h
su
c
all
T
h
c
yc
m
a
te
m
ob
j
Fo
sh
e
ea
c
Fo
w
a
re
g
af
f
Fi
g
Fi
g
w
i
T
h
sa
m
H
A
th
e
h
e mechanical pr
o
s
ts, and the prop
e
a
terial, accordin
g
h
e aluminium all
o
c
h as temperatu
r
o
y
occur for tem
p
h
is is attributed t
o
c
le. Appropriate
ay
not need v
e
m
peratures, and
j
ective of the hea
r carr
y
in
g
out th
e
e
et (avera
g
e thi
c
c
h sample place
d
r the laser heat t
r
a
s found suitab
l
g
ulated from las
e
f
ected zone.
g
. 21. Hardness r
e
g
ure 21 presents
i
th furnace heat-t
r
h
e laser was use
d
m
ple superficial
a
A
Z with the feed
e
HAZ, is similar
o
perties of the a
e
rties of the heati
g
to the Vickers
m
oy
studied suffer
s
r
e and heatin
g
c
y
p
eratures betwe
e
o
the dissolutio
n
choice of heati
n
e
r
y
lon
g
temp
e
these two factor
s
t treatment the h
i
e
furnace heat tr
e
c
kness 1.5mm).
T
d
in the central z
o
r
eatment a CO
2
l
a
l
e for the local
e
r power and fe
e
sults for furnac
e
results of Vicke
r
r
eatment. Temp
e
d
with 4 kW po
w
a
spect, presente
d
rate of 5 m/mi
n
with the obtain
e
luminium allo
y
n
g
affected zone
m
icro-hardness te
s
s
modifications i
n
y
cle. The si
g
nific
a
e
n 250ºC and 550
º
n
of copper rich
p
ng
c
y
cle paramet
e
rature c
y
cles f
o
s
var
y
dependin
g
ig
hest softenin
g
p
e
atment, several
s
T
he cut samples
o
ne of a furnace f
o
a
ser weldin
g
ma
c
softenin
g
appr
o
ed rate thus va
r
e
heat treatment.
r
s micro-hardnes
e
rature and time
a
w
er and differe
n
d
in Figures 22 a
n
n
. It is also possib
e
d in the bulk tre
a
6
060-T5 were o
b
(HAZ) are abou
t
s
t, as one can see
n
microstructure
a
nt chan
g
es in t
h
º
C where a decr
e
p
recipitates due
t
ers is also impo
r
o
r full transfor
m
g
on another, be
i
p
ossible of the al
l
s
amples were cu
t
were then sub
j
e
c
o
r prescribed te
m
c
hine was used (
o
ach. The densit
ry
in
g
material p
a
s test (with 100
g
a
re presented for
n
t feed rates. Th
e
n
d 23, show a si
g
le to see that the
a
ted specimens (
f
b
tained b
y
static
t
60% less than t
h
i
n
Figure 20.
for certain para
m
h
e microstructure
e
ase in hardness
o
t
o the imposed t
h
r
tant because th
e
m
ation, or ver
y
i
n
g
at this mom
e
l
o
y
.
t
from aluminiu
m
c
ted to heat tre
a
m
perature and ti
m
Trumpf – 4000
W
ty
of ener
gy
co
u
a
rameters and t
h
g
f load) for the s
a
the furnace tests
e
hardness resu
l
g
nificant increase
minimum hard
n
f
urnace heat trea
t
tensile
h
e base
m
eters,
of the
o
ccurs.
h
ermal
e
allo
y
y
hi
g
h
e
nt the
m
allo
y
a
tment:
m
e.
W
). This
u
ld be
h
e heat
a
mples
.
l
ts and
of the
n
ess, in
t
ment).
Fig. 22. Hardness results for laser heat treatment at center of HAZ (0 mm) and distance from
center of HAZ.
4kW
HV1_2m/min HV2_3m/min HV3_5m/min
Fig. 23. Images of the heat affected zone HAZ in samples treated with different laser speeds.
The structure considered in this study is a prismatic column with square cross-section of
aluminium 6060-T5. The dimension of the cross-section is 75x75 mm with 1.5 mm wall
thickness, and the length of the column is 300mm. The local heating in areas chosen for
triggers will be modelled in the numerical simulations through the modification of the
mechanical properties, as shown in figure 20.b). The location of these triggers on aluminium
alloy will be precisely induced thus forcing the column to deform in that zone.
The mechanical properties considered on the numerical simulations are Young’s modulus
E=69×10
3
MPa, Poisson’s ratio =0.3, density =2700Kg/m
3
and the initial yield stress
y
=180MPa for the base material and
y
=108MPa for the heat affected zone (HAZ). The
complete true stress–strain relation used in the simulations is shown in 20-b). As the
aluminium is insensitive to the strain rate effect, this is neglected in the finite element
modelling.
Laser welding application in crashworthiness parts 125
T
h
te
s
m
a
T
h
su
c
all
T
h
c
yc
m
a
te
m
ob
j
Fo
sh
e
ea
c
Fo
w
a
re
g
af
f
Fi
g
Fi
g
w
i
T
h
sa
m
H
A
th
e
h
e mechanical pr
o
s
ts, and the prop
e
a
terial, accordin
g
h
e aluminium all
o
c
h as temperatu
r
o
y
occur for tem
p
h
is is attributed t
o
c
le. Appropriate
ay
not need v
e
m
peratures, and
j
ective of the hea
r carr
y
in
g
out th
e
e
et (avera
g
e thi
c
c
h sample place
d
r the laser heat t
r
a
s found suitab
l
g
ulated from las
e
f
ected zone.
g
. 21. Hardness r
e
g
ure 21 presents
i
th furnace heat-t
r
h
e laser was use
d
m
ple superficial
a
A
Z with the feed
e
HAZ, is similar
o
perties of the a
e
rties of the heati
g
to the Vickers
m
oy
studied suffer
s
r
e and heatin
g
c
y
p
eratures betwe
e
o
the dissolutio
n
choice of heati
n
e
r
y
lon
g
temp
e
these two factor
s
t treatment the h
i
e
furnace heat tr
e
c
kness 1.5mm).
T
d
in the central z
o
r
eatment a CO
2
l
a
l
e for the local
e
r power and fe
e
sults for furnac
e
results of Vicke
r
r
eatment. Temp
e
d
with 4 kW po
w
a
spect, presente
d
rate of 5 m/mi
n
with the obtain
e
luminium allo
y
n
g
affected zone
m
icro-hardness te
s
s
modifications i
n
y
cle. The si
g
nific
a
e
n 250ºC and 550
º
n
of copper rich
p
ng
c
y
cle paramet
e
rature c
y
cles f
o
s
var
y
dependin
g
ig
hest softenin
g
p
e
atment, several
s
T
he cut samples
o
ne of a furnace f
o
a
ser weldin
g
ma
c
softenin
g
appr
o
ed rate thus va
r
e
heat treatment.
r
s micro-hardnes
e
rature and time
a
w
er and differe
n
d
i
n
Fi
g
ures 22 a
n
n
. It is also possib
e
d in the bulk tre
a
6
060-T5 were o
b
(HAZ) are abou
t
s
t, as one can see
n
microstructure
a
nt chan
g
es in t
h
º
C where a decr
e
p
recipitates due
t
ers is also impo
r
o
r full transfor
m
g
on another, be
i
p
ossible of the al
l
s
amples were cu
t
were then sub
j
e
c
o
r prescribed te
m
c
hine was used (
o
ach. The densit
ry
in
g
material p
a
s test (with 100
g
a
re presented for
n
t feed rates. Th
e
n
d 23, show a si
g
le to see that the
a
ted specimens (
f
b
tained b
y
static
t
60% less than t
h
i
n
Figure 20.
for certain para
m
h
e microstructure
e
ase in hardness
o
t
o the imposed t
h
r
tant because th
e
m
ation, or ver
y
i
n
g
at this mom
e
l
o
y
.
t
from aluminiu
m
c
ted to heat tre
a
m
perature and ti
m
Trumpf – 4000
W
ty
of ener
gy
co
u
a
rameters and t
h
g
f load) for the s
a
the furnace tests
e
hardness resu
l
g
nificant increase
minimum hard
n
f
urnace heat trea
t
tensile
h
e base
m
eters,
of the
o
ccurs.
h
ermal
e
allo
y
y
hi
g
h
e
nt the
m
allo
y
a
tment:
m
e.
W
). This
u
ld be
h
e heat
a
mples
.
l
ts and
of the
n
ess, in
t
ment).
Fig. 22. Hardness results for laser heat treatment at center of HAZ (0 mm) and distance from
center of HAZ.
4kW
HV1_2m/min HV2_3m/min HV3_5m/min
Fig. 23. Images of the heat affected zone HAZ in samples treated with different laser speeds.
The structure considered in this study is a prismatic column with square cross-section of
aluminium 6060-T5. The dimension of the cross-section is 75x75 mm with 1.5 mm wall
thickness, and the length of the column is 300mm. The local heating in areas chosen for
triggers will be modelled in the numerical simulations through the modification of the
mechanical properties, as shown in figure 20.b). The location of these triggers on aluminium
alloy will be precisely induced thus forcing the column to deform in that zone.
The mechanical properties considered on the numerical simulations are Young’s modulus
E=69×10
3
MPa, Poisson’s ratio =0.3, density =2700Kg/m
3
and the initial yield stress
y
=180MPa for the base material and
y
=108MPa for the heat affected zone (HAZ). The
complete true stress–strain relation used in the simulations is shown in 20-b). As the
aluminium is insensitive to the strain rate effect, this is neglected in the finite element
modelling.
Laser Welding126
M = 70 k
g
The present simulations were performed with the commercial software LS-DYNA that is
appropriate for non-linear explicit dynamic simulation for large deformations. The loading
condition is the impact of a rigid mass of 70kg at an initial speed of 45km/h on the top of the
model, as shown in Figure 24.a), being the lower part of the model clamped.
The elements used in this type of modelling need a good bending capacity and membrane
behaviour for large in-plane deformations allowing for axial loads. With these requirements
the chosen element is a Belytschko-Lin-Tsay shell element of four nodes, which is commonly
used in crash simulations. This element type is suitable for the large deformations which
occur in the folding process. Five integration points were used in the thickness direction.
b)
c)
Fig. 24. a) Loading Condition; b) Mesh size 3x3; c) Mesh size 1.5x1.5
The contact between the rigid wall and the model is defined as surface-surface interaction
with a friction coefficient equal to 0.1. Besides, self-contact with a friction coefficient 0.1 is
defined on the model walls and gravitational acceleration is applied to the whole model.
In the numerical simulations the focus of the laser heat treatment was chosen for trigger
dimension, and appropriate mesh size triggers are also chosen, as shown in Figure 24 b) and
c). The studies are based on the 3mm and 1.5mm width of the laser focus, that is, the weld3
and weld1.5 as indicated in the figures.
A total of six triggered configurations were defined, depending on number, width, and
location. The number of triggers can be largely divided into three types, i.e. without trigger,
triggers in opposite sides (2 sides) and triggers around of the model (4 sides of the model),
and their width is also varied either 3 or 1.5 mm, as shown in Table 3.
In all models the triggers are referenced to the top of the numerical model. For example, in
reference 14x20 it is meant that the triggers are inserted in up to intervals of 20 mm, fourteen
a
)
300mm
V = 45 km/h
75mm
triggers in along of the model. When the reference is 9x30 and 6x40 the same process is
done, inserted at even intervals of 30mm/40mm with nine/six triggers in along of the
model, respectively. For models with the reference 4x20, 4x30 and 4x40, only the initial four
triggers are introduced in up to intervals of 20mm, 30mm and 40mm, respectively.
Plastic folds are initially formed in the upper part of the smart models, and continue to
develop gradually down into the lower parts. Besides, as soon as the folds consist in a side
of the model, they develop in the side opposed in turns. These folds are facilitating a
mechanism to absorb the energy on the compressive deformation, therefore the tendency of
formation of folds fulfils an important role in the absorption of energy.
The numerical results of some smart models are shown in Figures 25-27, where it is possible
to observe that under dynamic loading models generally had a regular progressive folding,
but some of them exhibited irregular plastic folding during the terminal crushing stages, as
observed in model Weld3 4sides 4x20 (Figure 27), where the folds are well induced at the
trigger sites in the initial phase of deformation, but showing quite unstable deformation
later on. In both models without triggers, in the middle of the plastic deformation phase the
folds are quite irregular inducing to a structural instability.
Fig. 25. Deformed shape along of the model (14x20) with 1.5mm width of the HAZ triggers.
Crash energy absorption in the axially loaded model proceeds by the folding process. The
elements compressed by the axial compression at the critical load loose the stability of the
equilibrium configuration of the structure. Figure 28 shows through the force-displacement
curves where it is folding outward (A), contact outward (B), folding inward (C) and contact
inward (D). Through the deformed shape of the model the last statement can be confirmed.
When the first fold is forming, the model reaches the maximum force capacity, which represents
the first peak and is referred to as the maximum peak force. The load decrease as the first fold is
being developed where the folding outward is started. After the completion of the first fold, the
force reduces to the first lowest point where the contact outward happened. The further
deformation causes the load to increase until the next peak is formed with the formation of the
second fold. The process repeats with the folding the third, forth, and fifth folds until the kinetic
energy of the striking mass has been reduced to zero, as shown in Figures 29-33.
Laser welding application in crashworthiness parts 127
M = 70 k
g
The present simulations were performed with the commercial software LS-DYNA that is
appropriate for non-linear explicit dynamic simulation for large deformations. The loading
condition is the impact of a rigid mass of 70kg at an initial speed of 45km/h on the top of the
model, as shown in Figure 24.a), being the lower part of the model clamped.
The elements used in this type of modelling need a good bending capacity and membrane
behaviour for large in-plane deformations allowing for axial loads. With these requirements
the chosen element is a Belytschko-Lin-Tsay shell element of four nodes, which is commonly
used in crash simulations. This element type is suitable for the large deformations which
occur in the folding process. Five integration points were used in the thickness direction.
b)
c)
Fig. 24. a) Loading Condition; b) Mesh size 3x3; c) Mesh size 1.5x1.5
The contact between the rigid wall and the model is defined as surface-surface interaction
with a friction coefficient equal to 0.1. Besides, self-contact with a friction coefficient 0.1 is
defined on the model walls and gravitational acceleration is applied to the whole model.
In the numerical simulations the focus of the laser heat treatment was chosen for trigger
dimension, and appropriate mesh size triggers are also chosen, as shown in Figure 24 b) and
c). The studies are based on the 3mm and 1.5mm width of the laser focus, that is, the weld3
and weld1.5 as indicated in the figures.
A total of six triggered configurations were defined, depending on number, width, and
location. The number of triggers can be largely divided into three types, i.e. without trigger,
triggers in opposite sides (2 sides) and triggers around of the model (4 sides of the model),
and their width is also varied either 3 or 1.5 mm, as shown in Table 3.
In all models the triggers are referenced to the top of the numerical model. For example, in
reference 14x20 it is meant that the triggers are inserted in up to intervals of 20 mm, fourteen
a
)
300mm
V = 45 km/h
75mm
triggers in along of the model. When the reference is 9x30 and 6x40 the same process is
done, inserted at even intervals of 30mm/40mm with nine/six triggers in along of the
model, respectively. For models with the reference 4x20, 4x30 and 4x40, only the initial four
triggers are introduced in up to intervals of 20mm, 30mm and 40mm, respectively.
Plastic folds are initially formed in the upper part of the smart models, and continue to
develop gradually down into the lower parts. Besides, as soon as the folds consist in a side
of the model, they develop in the side opposed in turns. These folds are facilitating a
mechanism to absorb the energy on the compressive deformation, therefore the tendency of
formation of folds fulfils an important role in the absorption of energy.
The numerical results of some smart models are shown in Figures 25-27, where it is possible
to observe that under dynamic loading models generally had a regular progressive folding,
but some of them exhibited irregular plastic folding during the terminal crushing stages, as
observed in model Weld3 4sides 4x20 (Figure 27), where the folds are well induced at the
trigger sites in the initial phase of deformation, but showing quite unstable deformation
later on. In both models without triggers, in the middle of the plastic deformation phase the
folds are quite irregular inducing to a structural instability.
Fig. 25. Deformed shape along of the model (14x20) with 1.5mm width of the HAZ triggers.
Crash energy absorption in the axially loaded model proceeds by the folding process. The
elements compressed by the axial compression at the critical load loose the stability of the
equilibrium configuration of the structure. Figure 28 shows through the force-displacement
curves where it is folding outward (A), contact outward (B), folding inward (C) and contact
inward (D). Through the deformed shape of the model the last statement can be confirmed.
When the first fold is forming, the model reaches the maximum force capacity, which represents
the first peak and is referred to as the maximum peak force. The load decrease as the first fold is
being developed where the folding outward is started. After the completion of the first fold, the
force reduces to the first lowest point where the contact outward happened. The further
deformation causes the load to increase until the next peak is formed with the formation of the
second fold. The process repeats with the folding the third, forth, and fifth folds until the kinetic
energy of the striking mass has been reduced to zero, as shown in Figures 29-33.
Laser Welding128
Fig. 26. Deformed shape along of the model (4x20) with 3mm width of the four HAZ
triggers.
Fig. 27. Deformed shape on model with four HAZ triggers around the model with 3mm
width (4sides 4x20).
Figure 29 shows the force-displacement and absorbed energy-displacement curves of the
models with triggers along of the model and for the distance 40mm the results are quite
different than the other ones because the first fold is forming in the top of the model but the
second fold is being started at the bottom of the model. The absorption energy during the
crushing process for the same displacement than the others is increasing. This model is an
exception when compared to the others smart models studied here.
Fi
g
di
s
Fi
g
wi
In
m
a
fo
r
T
h
ha
tri
g
T
h
al
u
T
h
p
o
di
s
g
. 28. Deformed
s
placement curv
e
g
. 29. Force-displ
a
de of the HAZ tri
g
the case of mo
d
a
ximum si
g
nific
a
r
ce is effectivel
y
r
h
e hi
g
hest efficie
n
ve four tri
gg
ers
gg
ers around th
e
h
is section prese
n
u
minium allo
y
s
w
h
is was achieved
o
ssible to chan
g
e
t
s
solution effect i
n
0
10
20
30
40
50
60
70
80
0 50 10
0
Force (kN)
shape of the m
o
e
s of the models
w
a
cement and abso
gg
ers, on the ad
j
a
c
d
els without tri
gg
a
ntl
y
hi
g
her tha
n
r
educed about 14
n
c
y
of ener
gy
a
b
in opposite si
d
e
model with 3m
m
n
ted research w
o
w
ith the purpos
e
usin
g
laser heat
-
t
he local hardne
s
n
the sample, wit
h
0
150 200
Displacement (mm)
T20_1.5
T30_1.5
T40_1.5
o
del without tri
g
w
ithout tri
gg
ers
f
rbed ener
gy
-disp
l
c
ent sides at the s
a
g
ers, the maxim
u
n
the other mo
d
% for almost the
b
sorption durin
g
d
es with 1.5mm
m
width. In these
o
rk re
g
ardin
g
ex
e
of inducin
g
lo
c
-
treatment and i
n
s
s in a controlled
h
a laser treatme
n
250 300
0
100
0
200
0
300
0
400
0
500
0
Eabs (J)
gg
er with mesh
s
f
or both mesh siz
e
l
acement curves
o
a
me distance alon
g
u
m force exerte
d
d
els, as seen i
n
T
models b
y
the i
m
g
the crushing i
s
width, and in
m
cases the folds
p
p
erimental resul
c
al modification
n
furnace tests. I
t
wa
y
, i.e. b
y
the
c
n
t, b
y
chan
g
in
g
t
h
0
0
0
0
0
0
0 50 100
Displa
c
s
ize at 3mm and
e
.
o
f the models wit
h
g
of the model.
d
g
oes throu
g
h a
T
able 3. This ma
x
m
posed HAZ tri
g
s
found in mode
m
odels that ha
v
p
resent a re
g
ular
s
ts of heat-treat
m
of material pro
p
t
was verified t
h
c
opper rich preci
p
h
e feed rate.
150 200 250
c
ement (mm)
force-
h
1.5m
sharp
x
imum
g
ers.
ls that
v
e four
s
hape.
m
ent of
p
erties.
h
at it is
p
itates
300
Laser welding application in crashworthiness parts 129
Fig. 26. Deformed shape along of the model (4x20) with 3mm width of the four HAZ
triggers.
Fig. 27. Deformed shape on model with four HAZ triggers around the model with 3mm
width (4sides 4x20).
Figure 29 shows the force-displacement and absorbed energy-displacement curves of the
models with triggers along of the model and for the distance 40mm the results are quite
different than the other ones because the first fold is forming in the top of the model but the
second fold is being started at the bottom of the model. The absorption energy during the
crushing process for the same displacement than the others is increasing. This model is an
exception when compared to the others smart models studied here.
Fi
g
di
s
Fi
g
wi
In
m
a
fo
r
T
h
ha
tri
g
T
h
al
u
T
h
p
o
di
s
g
. 28. Deformed
s
placement curv
e
g
. 29. Force-displ
a
de of the HAZ tri
g
the case of mo
d
a
ximum signific
a
r
ce is effectivel
y
r
h
e hi
g
hest efficie
n
ve four tri
gg
ers
gg
ers around th
e
h
is section prese
n
u
minium alloys
w
h
is was achieved
o
ssible to chan
g
e
t
s
solution effect i
n
0
10
20
30
40
50
60
70
80
0 50 10
0
Force (kN)
shape of the m
o
e
s of the models
w
a
cement and abso
gg
ers, on the ad
j
a
c
d
els without tri
gg
a
ntly higher tha
n
r
educed about 14
n
c
y
of ener
gy
a
b
in opposite si
d
e
model with 3m
m
n
ted research w
o
w
ith the purpos
e
usin
g
laser heat
-
t
he local hardne
s
n
the sample, wit
h
0
150 200
Displacement (mm)
T20_1.5
T30_1.5
T40_1.5
o
del without tri
g
w
ithout tri
gg
ers
f
rbed ener
gy
-disp
l
c
ent sides at the s
a
g
ers, the maxim
u
n
the other mo
d
% for almost the
b
sorption durin
g
d
es with 1.5mm
m
width. In these
o
rk re
g
ardin
g
ex
e
of inducing lo
c
-
treatment and i
n
s
s in a controlled
h
a laser treatme
n
250 300
0
1000
2000
3000
4000
500
0
Eabs (J)
gg
er with mesh
s
f
or both mesh siz
e
l
acement curves
o
a
me distance alon
g
u
m force exerte
d
d
els, as seen in
T
models b
y
the i
m
g
the crushing i
s
width, and in
m
cases the folds
p
p
erimental resul
c
al modification
n
furnace tests. I
t
wa
y
, i.e. b
y
the
c
n
t, b
y
chan
g
in
g
t
h
0
0
0
0
0
0
0 50 100
Displa
c
s
ize at 3mm and
e
.
o
f the models wit
h
g
of the model.
d
g
oes throu
g
h a
T
able 3. This ma
x
m
posed HAZ tri
g
s
found in mode
m
odels that ha
v
p
resent a re
g
ular
s
ts of heat-treat
m
of material pro
p
t
was verified t
h
c
opper rich preci
p
h
e feed rate.
150 200 250
c
ement (mm)
force-
h
1.5m
sharp
x
imum
g
ers.
ls that
v
e four
s
hape.
m
ent of
p
erties.
h
at it is
p
itates
300
Laser Welding130
Fig. 30. Force -displacement and absorbed energy-displacement curves of the models with
four HAZ triggers on the opposite sides with 1.5mm of the width.
Fig. 31. Force-displacement and absorbed energy-displacement curves of the models with
3mm wide of the HAZ triggers, on the opposite sides at the same distance along of the
model.
Fig. 32. Force -displacement and absorbed energy-displacement curves of the models with
four HAZ triggers on the opposite sides with 3mm of the width.
Numerical simulations of crushing behaviour of aluminium tubes with local triggers obtained
through heat treatment were performed. The highest efficiency of absorption energy during
crushing is found in models that have four triggers in opposite sides with 1.5mm wide, and in
models with four triggers around the model and 3mm width.
0
10
20
30
40
50
60
70
0 50 100 150 200 250 300
Displacement (mm)
Force (kN)
4x20_1.5
4x30_1.5
4x40_1.5
0
1000
2000
3000
4000
5000
0 50 100 150 200 250 300
Displacement (mm)
Eabs (J)
0
10
20
30
40
50
60
70
0 50 100 150 200 250 300
Displacement (mm)
Force (kN)
T20
T30
T40
0
1000
2000
3000
4000
5000
0 50 100 150 200 250 300
Displacement (mm)
Eabs (J)
0
10
20
30
40
50
60
70
0 50 100 150 200 250 300
Displacement (mm)
Force (kN)
4x20
4x30
4x40
0
1000
2000
3000
4000
5000
0 50 100 150 200 250 300
Displacement (mm)
Eabs (J)
Fig. 33. Force-displacement and absorbed energy-displacement curves of the models with
four HAZ around the entire model with 3mm of the width.
ITEM
l
E
int
F
peak
F
med
Folds
mm J kN kN
Without trigger
mesh 3 262.0 4508 74.6 17.6 7
mesh 1.5 268.0 4466 74.2 15.1 10
WELD 1.5 2 sides
14x20 277.3 4332 63.9 16.1 8
9x30 277.6 4364 63.8 15.6 8
6x40 253.6 4282 64.0 16.4 8
4x20 274.1 4562 65.2 17.3 7
4x30 270.5 4631 65.5 17.9 7
4x40 273.3 4593 64.8 16.4 8
WELD 3
2 sides
14x20 275.9 4690 64.3 19.5 7
9x30 258.3 4394 56.5 17.0 7
6x40 259.7 4314 57.7 16.5 8
4x20 273.4 4396 65.9 17.7 7
4x30 271.7 4457 66.2 18.2 7
4x40 271.5 4255 64.2 16.6 8
4 sides
4x20 267.4 4455 56.2 16.5 10
4x30 258.4 4394 56.4 18.0 8
4x40 259.7 4313 58.5 16.5 5
Table 3. Numerical results
The research revealed that, by using a thermal trigger, a reduction of 15% of the initial crushing
force is achievable. It is also found that this thermal trigger can not only reduce the initial
maximum force but also ensure stable and uniform absorbed energy at most smart models.
The concept of using thermal modification of an aluminium alloy in localized areas for providing
a larger global deformation of a part and higher energy absorption before failure appears as
possible and effective in the experimental work presented and numerical simulations.
4. References
Auto/Steel Partnership, (1998). Automotive design manual, version 5.1, edited by American Iron
and Steel Institute – Auto/Steel Partnership, 1998.
0
10
20
30
40
50
60
0 50 100 150 200 250 300
Displacement (mm)
Force (kN)
4sides_20_3
4sides_30_3
4sides_40_3
0
1000
2000
3000
4000
5000
0 50 100 150 200 250 300
Displacement (mm)
Eabs (J)
Laser welding application in crashworthiness parts 131
Fig. 30. Force -displacement and absorbed energy-displacement curves of the models with
four HAZ triggers on the opposite sides with 1.5mm of the width.
Fig. 31. Force-displacement and absorbed energy-displacement curves of the models with
3mm wide of the HAZ triggers, on the opposite sides at the same distance along of the
model.
Fig. 32. Force -displacement and absorbed energy-displacement curves of the models with
four HAZ triggers on the opposite sides with 3mm of the width.
Numerical simulations of crushing behaviour of aluminium tubes with local triggers obtained
through heat treatment were performed. The highest efficiency of absorption energy during
crushing is found in models that have four triggers in opposite sides with 1.5mm wide, and in
models with four triggers around the model and 3mm width.
0
10
20
30
40
50
60
70
0 50 100 150 200 250 300
Displacement (mm)
Force (kN)
4x20_1.5
4x30_1.5
4x40_1.5
0
1000
2000
3000
4000
5000
0 50 100 150 200 250 300
Displacement (mm)
Eabs (J)
0
10
20
30
40
50
60
70
0 50 100 150 200 250 300
Displacement (mm)
Force (kN)
T20
T30
T40
0
1000
2000
3000
4000
5000
0 50 100 150 200 250 300
Displacement (mm)
Eabs (J)
0
10
20
30
40
50
60
70
0 50 100 150 200 250 300
Displacement (mm)
Force (kN)
4x20
4x30
4x40
0
1000
2000
3000
4000
5000
0 50 100 150 200 250 300
Displacement (mm)
Eabs (J)
Fig. 33. Force-displacement and absorbed energy-displacement curves of the models with
four HAZ around the entire model with 3mm of the width.
ITEM
l
E
int
F
peak
F
med
Folds
mm J kN kN
Without trigger
mesh 3 262.0 4508 74.6 17.6 7
mesh 1.5 268.0 4466 74.2 15.1 10
WELD 1.5 2 sides
14x20 277.3 4332 63.9 16.1 8
9x30 277.6 4364 63.8 15.6 8
6x40 253.6 4282 64.0 16.4 8
4x20 274.1 4562 65.2 17.3 7
4x30 270.5 4631 65.5 17.9 7
4x40 273.3 4593 64.8 16.4 8
WELD 3
2 sides
14x20 275.9 4690 64.3 19.5 7
9x30 258.3 4394 56.5 17.0 7
6x40 259.7 4314 57.7 16.5 8
4x20 273.4 4396 65.9 17.7 7
4x30 271.7 4457 66.2 18.2 7
4x40 271.5 4255 64.2 16.6 8
4 sides
4x20 267.4 4455 56.2 16.5 10
4x30 258.4 4394 56.4 18.0 8
4x40 259.7 4313 58.5 16.5 5
Table 3. Numerical results
The research revealed that, by using a thermal trigger, a reduction of 15% of the initial crushing
force is achievable. It is also found that this thermal trigger can not only reduce the initial
maximum force but also ensure stable and uniform absorbed energy at most smart models.
The concept of using thermal modification of an aluminium alloy in localized areas for providing
a larger global deformation of a part and higher energy absorption before failure appears as
possible and effective in the experimental work presented and numerical simulations.
4. References
Auto/Steel Partnership, (1998). Automotive design manual, version 5.1, edited by American Iron
and Steel Institute – Auto/Steel Partnership, 1998.
0
10
20
30
40
50
60
0 50 100 150 200 250 300
Displacement (mm)
Force (kN)
4sides_20_3
4sides_30_3
4sides_40_3
0
1000
2000
3000
4000
5000
0 50 100 150 200 250 300
Displacement (mm)
Eabs (J)
Laser Welding132
Bjørneklett, B. ; Myhr, O., (2003). Materials Design and Thermally Induced Triggers in Crash
Management, Proceedings IBEC Conference, 2003.
Cheng, C. ; Jie, M. ; Chan, L. ; Chow, L., (2007). True stress–strain analysis on weldment of
heterogeneous tailor-welded blanks—a novel approach for forming simulation,
International Journal of Mechanical Sciences, Volume 49, Issue 2, 2007, Pages 217-229.
Gaied, S. ; Roelandt, J-M ; Pinard, F.; Schmit, F. ; Balabane, L., (2009). Experimental and numerical
assessment of Tailor-Welded Blanks formability, Journal of Materials Processing
Technology, Volume 209, Issue 1, 2009, Pages 387-395.
Geoffroy, J. ; Cambien, I. ; Jouet, A., (1993). Contribution of high strength steels to the absorption
of impact energy. La metallurgia Italiana 1993;85(6):377–82.
Kim, H-S, (2002). New extruded multi-cell aluminium profile for maximum crash energy
absorption and weight efficiency, Thin-Walled Structures, 40, pp. 311-327, 2002.
Kim, J. ; Kim, N. ; Huh, M., (2000). Optimum blank design of an automobile sub-frame, Journal of
Materials Processing Technology, Volume 101, Issues 1-3, 2000, Pages 31-43.
Lee, S.; Hahn, C. ; Rhee, M. ; Ohd, J., (1999). Effect of triggering on the energy absorption capacity
of axially compressed aluminum tubes, Materials and Design, 20, pp.31-40, 1999.
Liu, G. ; Yuan, S. ; Chu, G., (2007). FEA on deformation behavior of tailor-welded tube in
hydroforming, Journal of Materials Processing Technology, Volumes 187-188, 2007,
Pages 287-291.
Padmanabhan, R.; Oliveira, M.; Menezes, L., (2008). Deep drawing of aluminium–steel tailor-
welded blanks, Materials & Design, Volume 29, Issue 1, 2008, Pages 154-160.
Panda, S.; Kumar, D. ; Kumar, H. ; Nath, A., (2007). Characterization of tensile properties of tailor
welded IF steel sheets and their formability in stretch forming, Journal of Materials
Processing Technology, Volume 183, Issues 2-3, 2007, Pages 321-332.
Panda, S.; Kumar, D., (2001). Improvement in formability of tailor welded blanks by application
of counter pressure in biaxial stretch forming, Journal of Materials Processing Technology,
Volume 204, Issues 1-3, 2008, Pages 70-79.
Peixinho, N., (2004). Study of viscoplasticity models for the prevision of the mechanical
behaviour of high-strength steels subjected to impact, PhD thesis, University of
Minho, 2004.
Peixinho, N.; Pinho, A., (2007). Study of viscoplasticity models for the impact behaviour of high-
strength steels, Journal of Computational and Nonlinear Dynamics, Vol. 2, pp. 114-123, 2007.
Peroni, L.; Avalle, M.; Belingardi, G., (2009). Comparison of the energy absorption capability of
crash boxes assembled by spot-weld and continuous joining techniques, International
Journal of Impact Engineering, 36 (2009) 498–511.
Qiu, X.; Chen, W., (2007). The study on numerical simulation of the laser tailor welded
blanks stamping, Journal of Materials Processing Technology, Volumes 187-188, 2007,
Pages 128-131.
Radlmayr, K-M.; Ponschab, H. ; Stiaszny, P.; Till, E., (1993). Comparative behaviour of safety
structures from soft and higher-tensile qualities as well as aluminium alloys in crashes.
In: Proceedings to the twenty-sixth ISATA conference on road and vehicle safety. Aachen
(Germany); 1993. Paper 93SF061.
Sheng, Z., (2008). Formability of tailor-welded strips and progressive forming test, Journal of
Materials Processing Technology, Volume 205, Issues 1-3, 2008, Pages 81-88.