Gas Turbines Part 3 pdf
Bạn đang xem bản rút gọn của tài liệu. Xem và tải ngay bản đầy đủ của tài liệu tại đây (2.57 MB, 25 trang )
Exergy and Environmental Considerations in Gas Turbine Technology and Applications
39
Fuel Properties Max Min Notes
Lower Heating Value, MJ/m
3
None 3.73 –11.20
Modified Wobbe Index
(MWI)
- Absolute limits
- Range within limits
54
+5%
40
-5%
Flammability Ratio
2.2:1
Rich:Lean Fuel/Air Ratio,
volume basis
Constituent Limits, mole %
Methane, CH
4
Ethane, C
2
H
6
Propane, C
3
H
8
Butane C
4
H
10
+ higher
paraffins (C
4
+)
Hydrogen, H
2
Carbon monoxide, CO
Oxygen, O
2
Total Inerts (N
2
+CO
2
+Ar)
Aromatics (Benzene C
6
H
6
,
Toluene C
7
H
8
, etc.)
Sulfur
100
15
15
5
Trace
Trace
Trace
Trace
15
Report
Report
85
0
0
0
0
0
0
0
0
0
0
% of reactant species
% of reactant species
% of reactant species
% of reactant species
% of reactant species
% of reactant species
% of reactant species
% of reactant species
% of total (reactants + inerts)
Table 4.4. Range of typical heavy-duty gas turbine fuel specification (adapted from GER
41040G – GE Gas Power Systems, Revised January 2002).
Conventional and New Environmental-conscious Aero and Industrial Gas Turbine Fuels
Conventional aero gas turbine fuels are commonly:
i. Kerosene from crude petroleum sources using established refining processes, and
ii. synthetic kerosene from Fischer-Tropsch (FT) synthesis using coal, natural gas, or any
other hydrocarbon feedstock (e.g. shale, tar sands, etc.). These are produced by first
gasifying the hydrocarbon resource followed by liquefaction to form hydrocarbon liquids
(e.g. as earlier noted, the Airline Industry Information update dateline 26 June 2009)
New Environmentally-conscious aero gas turbine fuels are:
i. Bio-fuels from bio-derived Fatty Acid Methyl Esters (FAME) mixed with conventional
aero fuel (kerosene) in regulated proportions,
ii. Bio-ethanol and bio-methanol neat or mixed in regulated proportions with gasoline,
iii. Biofuels produced from Fischer-Tropsch Synthesis (FTS) process using biomass
feedstock such as oil seeds – jathropha, palm oil, soybeans, rapeseed (canola),
sunflower, camelina, etc., as well as animal fats,
iv. Bio-syngas produced by gasification of biomass, lignocellulosic biomass and other
agricultural wastes used as feed into the FTS (2
nd
generation biofuels) to produce liquid
fuels (FTL), and
v. Liquefied petroleum gas (LPG) which is really not a cryogen; Liquefied gases such as
LNG, Methane and Hydrogen. Both methane and hydrogen will have to be liquefied for
use as aircraft fuel.
Table 4.5 below gives relative properties of conventional aviation kerosene and typical
biodiesel aircraft fuel (will vary with Fatty Acid Methyl Esters [FAME] type):
Gas Turbines
40
Property
Aviation
Kerosene
Bio-diesel 20% Blend Impact
Heat of combustion
[MJ/kg] typical
43.2 32 – 39
41.0 – 42.4
(spec. min:
42.8)
Airframe
range/loading
Density [kg/m
3
] range 775 – 840 860 – 900 792 – 852
Viscosity [mm2/sec
@ -20°C max.
Wing tank temp.
limits, Cold Starts &
Relight.
Approx. Carbon length
C14 – C15 max
(trace levels)
C16 – C22 C16 – C22
Combustion
emissions
Flash point, °C min. 38 >101 Unchanged
Freeze Point,°C max -47 -3? 0
-5 to -10 with
additives
Wing tank temp.
limits, Cold Start
and Relight.
Sulfur [ppm] max 3000 10
0.015 0.5 0.11
Material
compatibility
Acidity [mg KOH/g]
max
Phosphorous [ppm]
max
Excluded 10 2 Hot-end life
Metals [ppm] max Excluded 5 1 Hot-end life
Controlled to
well defined
level
Not
controlled
Not known
Fuel system &
injector life
Thermal Stability
Composition
Hydrocarbon FAME 20% FAME
Elastomer
compatibility
From: Ppt. Presentation by Chris Lewis, Company Specialist – Fluids, Rolls Royce plc, titled
“A Gas Turbine Manufacturer’s View of Biofuels”. 2006.
In the steam-reforming reaction, steam reacts with feedstock (hydrocarbons, biomass,
municipal organic waste, waste oil, sewage sludge, paper mill sludge, black liquor, refuse-
derived fuel, agricultural biomass wastes and lignocellulosic plants) to produce bio-syngas.
It is a gas rich in carbon monoxide and hydrogen with typical composition shown in Table
4.6 below.
Constituents % by vol. (dry & N
2
-free)
Carbon monoxide (CO) 28 – 36
Hydrogen (H
2
) 22 – 32
Carbon dioxide (CO
2
) 21 – 30
Methane (CH
4
) 8 – 11
Ethene (C
2
H
4
) 2 – 4
Benzene-Toluene-Xylene (BTX) 0.84 – 0.96
Ethane (C
2
H
5
) 0.16 – 0.22
Tar 0.15 – 0.24
Others (NH3, H2S, HCl, dust, ash, etc.) < 0.021
Source: M. Balat et al. Energy Conversion and Management 50 (2009) 3158 – 3168).
Table 4.6. Typical composition of bio-syngas from biomass gasification.
Exergy and Environmental Considerations in Gas Turbine Technology and Applications
41
A useful reference for the thermo-conversion of biomass into fuels and chemicals can be
found in the above referenced paper by M. Balat et al.
Ethanol-powered gas turbines for electricity generation
In a 2008 report by Xavier Navarro (RSS feed), a company called LPP Combustion (Lean,
Premixed, Prevaporized) was claimed to have demonstrated that during gas turbine testing,
emissions of NOx, CO, SO
2
and PM (soot) from biofuel ethanol (ASTM D-4806) were the
same as natural gas-level emissions achieved using dry low emission (DLE) gas turbine
technology. It was also claimed that the combustion of the bio-derived ethanol produced
virtually no net CO
2
emissions.
Gas Turbines and Biodiesels
A recent study by Bolszo and McDonnell (2009)
1
on emissions optimization of a biodiesel-
fired 30-kW gas turbine indicates that biodiesel fluid properties result in inferior
atomization and longer evaporation times compared to hydrocarbon diesel. It was found
that the minimum NOx emission levels achieved for biodiesel exceeded the minimum
attained for diesel, and that optimizing the fuel injection process will improve the biodiesel
NOx emissions.
A theoretical study was recently carried out by Glaude et al. (2009)
2
to clarify the NOx index
of biodiesels in gas turbines taking conventional petroleum gasoils and natural gas as
reference fuels. The adiabatic flame temperature T
f
was considered as the major determinant
of NOx emissions in gas turbines and used as a criterion for NOx emission. The study was
necessitated by the conflicting results from a lab test on a microturbine and two recent gas
turbine field tests, one carried out in Europe on rapeseed methyl ester (RME) and the other
in USA on soybean methyl ester (SME), the lab test showing a higher NOx emission while
the two field tests showed slightly lower NOx emission relative to petroleum diesel. It is
however clear that biodiesels have reduced carbon-containing emissions and there is
agreement also on experimental data from diesel engines which indicate a slight increase in
NOx relative to petroleum diesel. The five FAME’s studied by Glaude et al. were RME,
SME, and methyl esters from sunflower, palm and tallow.
The results showed that petroleum diesel fuels tend to generate the highest temperatures
while natural gas has the lowest, with biodiesel lying in-between. This ranking thus agrees
with the two field tests mentioned earlier. It was also found out that the variability of the
composition of petroleum diesel fuels can substantially affect the adiabatic flame
temperature, while biofuels are less sensitive to composition variations.
5. Factors limiting gas turbine performance
The Joule cycle (also popularly known as the Brayton cycle) is the ideal gas turbine cycle
against which the performance (i.e. the thermal efficiency of the cycle η
CY
) of an actual gas
turbine cycle is judged under comparable conditions. We prefer to restrict the use of Joule
1
C. D. Bolszo and V. G. McDonell, Emissions optimization of a biodiesel fired gas turbine, Proceedings
of the Combustion Institute, Vol 32, Issue 2, 2009, Pages 2949-2956.
2
Pierre A. Glaude, Rene Fournet, Roda Bounaceur and Michel Moliere, (2009). Gas Turbines and
Biodiesel: A clarification of the relative NOx indices of FAME, Gasoil and Natural Gas.
Gas Turbines
42
cycle to the ideal gas turbine cycle while the Brayton cycle is exclusively used for the actual
gas turbine cycle. The ideal gas turbine “closed”cycle (or Joule cycle) consists of four ideal
processes – two isentropic and two isobaric processes – which appear as shown in Fig. 5.1.
The thermal efficiency of the Joule cycle in terms of the pressure ratio r
p
given by
B
A
p
p
p
r = and the pressure ratio parameter ρ
p
given by
(1)/
pp
r
γ
γ
ρ
−
= is:
Joule
(1)/
11
11
p
p
r
γγ
η
ρ
−
⎛⎞
⎛⎞
⎜⎟
⎜⎟
=− =−
⎜⎟
⎜⎟
⎝⎠
⎝⎠
(5.1)
Hence, the thermal efficiency of the ideal gas Joule cycle is a function only of the pressure
ratio. Since for isentropic processes 1-2 and 3-4,
3
2
14
T
T
p
TT
ρ
=
= , the Joule efficiency is also
dependent of the isentropic temperature ratios only, but independent of the compressor and
the turbine inlet temperatures separately without a knowledge of the pressure ratio. Thus, ρ
p
is essentially the isentropic temperature ratio, the abscissa in Fig. 5.1. If air is the working
fluid employed in the ideal Joule cycle, the cycle is referred to as the air-standard Joule
cycle.
Fig. 5.1. Ideal Joule cycle (a) p-V and (b) T-s state diagrams. From Haywood [ ].
Fixing the inlet temperature to the compressor T
a
and the inlet temperature to the turbine T
b
automatically sets a limit to the pressure ratio r
p
, which occurs when the temperature after
isentropic compression from T
a
is equal to the TIT T
b
. However, when this occurs, the net
work done is seen to be equal to zero, as the area of the cycle on the T-s and p-V diagrams
indicate.
Haywood considers an interesting graphical representation of eq. 5.1 above for T
a
= 15°C
and T
b
= 100°C as shown in Fig. 5.2
Exergy and Environmental Considerations in Gas Turbine Technology and Applications
43
For T
a
= 15°C and T
b
= 100°C,
η
Joule
increases continuousl
y
with
rp ri
g
ht up to the limitin
g
value
as the curve labeled “reversible”
shows. The limitin
g
pressure ratio
r
p
= 99.82 approximated to 100 in
the figure is attained when ρ
p
= θ
= T
b
/T
a
= 1073/288 = 3.7257.
Under this condition, a sketch of
the Joule cycle on the T-s dia
g
ram
shows that as r
p
approaches this
value, the area enclosed b
y
the
c
y
cle approaches zero. However,
In practical terms, a pressure ratio
this lar
g
e is never used when
issues of process irreversiblities
are considered, to which the
remainin
g
two curves in the
graph pertain.
Fig. 5.2. Variation of cycle efficiency with Isentropic temperature ratio ρ
p
(t
a
= 15°C). From
Haywood [ ].
5.1 Effect of irreversibilities in the actual gas turbine cycle
In an actual plant, frictional effects in turbines and compressors and pressure drops in heat
exchangers and ductings and combustion chamber are basically lost opportunities for
production of useful work. The h-s curve diagram for such a gas turbine Brayton cycle
appears in Fig. 5.3, wherein the heat and work terms in each of the processes are identified,
ignoring the frictional effects in the heat exchangers, ductings and combustion chamber. We
note that the compressor work input required W
C
, is now much larger than its previous
value for the ideal Joule cycle while the turbine work output W
T
is considerably smaller
than for the ideal Joule cycle, revealing the considerable effect of turbine and compressor
inefficiencies on the cycle thermal efficiency. An analytic expression for the Brayton cycle
thermal efficiency can be shown to be:
(1 1/ )( )
()
pp
Brayton
p
ρ
αρ
η
βρ
−−
=
−
(5.2)
where α = η
C
η
T
θ, β = [1 + η
C
(θ – 1)], and θ = T
b
/T
a
.
In Fig. 5.2, the actual Brayton cycle performance is depicted for turbine and compressor
isentropic efficiencies of 88% and 85% respectively, t
a
= 15°C for two values of t
b
= 800°C
and 500°C respectively. The optimum pressure ratio is now reduced from approximately
100 to 11.2 for t
b
= 800°C, and to only 4.8 at t
b
= 500°C. This optimum pressure ratio is more
realistically achievable in a single compressor. Here also, we find that
η
Brayton
is highly
dependent on
θ
= T
b
/T
a
, showing a drastic reduction from TIT = 800°C to TIT = 500°C.
Gas Turbines
44
The compressor work input per unit mass o
f
working fluid is
2
()(1)
pa
cp a p
c
cT
WcTT
ρ
η
′
=
−= − (5.3)
while
4
1
() 1
p
Tpb pTb
WcTT cT
ρ
η
⎛⎞
′
=−= −
⎜⎟
⎝⎠
(5.4)
and
()
net T C
1
WW– W 1 ( )
p
pa
p
c
cT
ρ
α
ρ
η
⎛⎞
==−−
⎜⎟
⎝⎠
(5.5)
with α = η
C
η
T
θ and θ = T
b
/T
a
as before.
From 5.5, W
net
vanishes when ρ
p
= 1 and whe
n
ρ
p
= α. Also from differentiating 5.5 w.r.t. ρ
p
,
we obtain that W
net
is maximum when ρ
p
=
√α. The variation of W
net
with the adiabatic
temperature ratio ρ
p
appears in Fig. 5.4.
Fig. 5.3. Enthalpy-entropy diagram for Actual Brayton cycle, with turbine and Compressor
inefficiencies. From Haywood [ ].
Ha
y
wood [] discusses the
g
raphical
construction in Fi
g
. 5.4 due to
Hawthorne and Davis [ ] for the
variation of Q
B
, W
T
, W
C
, and W
net
with variation in ρ
p
for fixed values
of T
a
and T
b
. The maximum
efficienc
y
is obtained at the value o
f
ρ
p
correspondin
g
to the point H at
which a strai
g
ht line from point E is
tangent to the curve for W
net
, i.e at
ρ
p
= ρ
opt
. The method indicates that
the points of maximum thermal
efficiency of the Brayton cycle η
CY
and the maximum W
net
are not
coincident; rather the value of ρ
p
is
greater for the former than for the
latter. It may also be shown that, if
ρ
W
and ρ
opt
are the values of ρ
p
for
maximum W
net
and maximum η
CY
respectively, then
(1 )
w
opt
m
ρ
ρ
η
=−
where η
m
is the maximum value o
f
the thermal efficienc
y
of the
Brayton cycle.
Fig. 5.4. Variation of heat supplied to the combustor Q
B
, turbine work output W
T
, compressor
work input W
C
, and W
net
with isentropic temperature ratio ρ
p
. From Haywood [ ].
Exergy and Environmental Considerations in Gas Turbine Technology and Applications
45
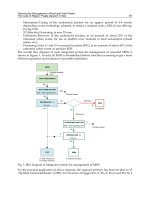
Figs. 5.5 and 5.6 show the schematic of the simple-cycle, open-flow gas turbine with a single
shaft and double shaft respectively. The single shaft units are typically used in applications
requiring relatively uniform speed such as generator drives while in the dual shaft
applications, the power turbine rotor is mechanically separate from the high-pressure
turbine and compressor rotor. It is thus aerodynamically coupled, making it suitable for
variable speeds applications.
Fig. 5.5. Simple-cycle, open-flow, single-shaft gas turbine
Fig. 5.6. Simple cycle, open-flow, dual-shaft gas turbine for mechanical drives.
5.2 Simple-cycle vs. Combined-cycle gas turbine power plant characteristics
Fig. 5.7 shows the variation of output per unit mass and efficiency for different firing
temperatures and pressure ratios for both simple-cycle and combined-cycle applications. In
the simple-cycle top figure, at a given firing temperature, an increase in pressure ratio
results in significant gains in thermal efficiency. The pressure ratio resulting in maximum
efficiency and maximum output are a function of the firing temperature; the higher the
pressure ratio, the greater the benefits from increased firing temperature. At a given
Gas Turbines
46
pressure ratio, increasing the firing temperature results in increased power output, although
this is achieved with a loss in efficiency mainly due to increase in cooling air losses for air-
cooled nozzle blades.
On the other hand, pressure ratio increases do not affect efficiency markedly as in simple-
cycle plants; indeed, pressure ratio increases are accompanied by decreases in specific
power output. Increases in firing temperature result in marked increases in thermal
efficiency. While simple-cycle efficiency is readily achieved with high pressure ratios,
combined-cycle efficiency is obtained with a combination of modest pressure ratios and
higher firing temperatures. A typical combined-cycle gas turbine as shown in Fig. 5.7 (lower
cycle) will convert 30% to 40% of the fuel input into shaft output and up to 98% of the
remainder goes into exhaust heat which is recovered in the Heat Recovery Steam Generator
(HRSG). The HRSG is basically a heat exchanger which provides steam for the steam turbine
part of the combined-cycle. It is not unusual to utilize more than 80% of the fuel input in a
combined-cycle power plant which also produces process steam for on- or off-site purposes.
Fig. 5.7. Gas turbine characteristics for simple-cycle (above) and for combined-cycle (below).
Abstracted from GE Power Systems.GER-3567H 10/00.
5.3 Other factors affecting gas turbine performance
Other factors affecting the performance of a gas turbine (heat rate, power output) include
the following: Air temperature (compressor inlet temperature) and pressure; Site elevation
or altitude; humidity; inlet and exhaust losses resulting from equipment add-ons such as air
filters, evaporative coolers, silencers, etc. The usual reference conditions stated by
manufacturers are 59F/15C and 14.7 psia/1.013 bar. In general, output decreases with
increasing air temperature while the heat rate increases less steeply. Similarly, altitude
Exergy and Environmental Considerations in Gas Turbine Technology and Applications
47
corrections are provided by manufacturers with factors less than 1.0 at higher latitudes. The
density of humid air is less than that of dry air and it affects both the heat rate and the
specific output of a gas turbine. The higher the humidity, the lower the power output and
conversely the higher the heat rate. Inlet and exhaust pressure losses result in power output
loss, heat rate increase and exhaust temperature increase.
5.4 Gas turbine emissions and control
Over the past three to four decades, many developed countries have put in place applicable
state and federal environmental regulations to control emissions from aero, industrial and
marine gas turbines. This was the case even before the current global awareness to the
Climate Change problem. Only NOx gas turbine emission was initially regulated in the early
1970s and it was found that injection of water or steam into the combustion zone of the
combustor liner did produce the then required low levels of NOx reduction without serious
detrimental effects on the gas turbine parts lives or the overall gas turbine cycle performance.
However, as more stringent requirements emerged with time, further increase in
water/steam approach began to have significant detrimental effects on the gas turbine parts
lives and cycle performance, as well increased levels of other emissions besides NOx.
Alternative or complimentary methods of emission controls have therefore been sought,
some internal to, and others external to, the gas turbine, namely:
i. Dry Low NOx Emission (DLN) or DLE burner technology
ii. Exhaust catalytic combustion technology
iii. Overspray fogging
While NOx emissions normally include Nitrous oxide (NO) and Nitrogen dioxide (NO
2
),
NOx from gas turbines is predominantly NO, although NO
2
is generally used as the mass
reference for reporting NOx. This can be seen from the typical exhaust emissions from a
stationary industrial gas turbine appearing in Table 5.1.
Table 5.1. Typical exhaust emissions from a stationary industrial gas turbine. Abstracted
from GE Power Systems – GER-4211-03/01.
Gas Turbines
48
NOx are divided into two main classes depending on their mechanism of formation. NOx
formed from the oxidation of free nitrogen in either the combustion air of the fuel are known
as “thermal NOx”, and they are basically a function of the stoichiometric adiabatic flame
temperature of the fuel. Emissions arising from oxidation of organically bound nitrogen in the
fuel (the fuel-bound-nitrogen, FBN) are known as “organic NOx”. Of the two, efficiency of
conversion of FBN to NOx proceeds much more efficiently than that of thermal NOx.
Fig. 5.8. Typical NOx emissions for a class of Industrial gas turbines. Abstracted from GE
Power Systems – GER-4311-03/01.
Fig. 5.9. Typical NOx emissions for a class of Industrial gas turbines. Abstracted from GE
Power Systems – GER-4311-03/01.
Thermal NOx is relatively well studied and understood, but much less so for organic NOx
formation. For thermal NOx production, NOx increases exponentially with combustor inlet
air temperature, increases quite strongly with F/A ratio or with firing temperature, and
increases with increasing residence time in the flame zone. It however decreases
exponentially with increasing water or steam injection or increasing specific humidity. Figs.
Exergy and Environmental Considerations in Gas Turbine Technology and Applications
49
5.1 and 5.2 show typical NOx emissions for industrial gas turbines operating on natural gas
fuel and No.2 distillate as a function of firing temperature.
As regards organic NOx, reduction of flame temperature (as through water or steam
injection) does scant little to abate it. Water and steam injection are known to actually
increase organic NOx in liquid fuels. As noted earlier, organic NOx is important only for
fuels containing significant amount of FBN such as crude or residual oils.
Carbon Monoxide (CO) emissions as seen from Table 5.1 can be of comparable magnitude
with NO emission, depending on the fuel and the loading condition of the gas turbine. Fig.
5.10 is a typical industrial gas turbine CO emission as a function of firing temperature. We note
that, contrary to the NOx trend, CO emission increases significantly as the firing temperature
is reduced below about 816°C (1500°F). It is noted that carbon monoxide is normally expected
from incomplete combustion and hence inefficiency in the combustion process.
Fig. 5.10. CO emissions from an industrial gas turbine. Abstracted from GE Power Systems –
GER-4311-03/01.
Fig. 5.11. UHC emissions from an industrial gas turbine. Abstracted from GE Power Systems
– GER-4311-03/01.
Gas Turbines
50
Unburned hydrocarbons (UHC) are also products of the inefficiency in the combustion
process. Fig. 5.11 shows a typical industrial gas turbine UHC emission as a function of firing
temperature.
Particulates.
Fuel properties, combustor operating conditions and the design of the combustor all affect
the gas turbine exhaust particulate emission, whose main components are smoke, ash,
erosion and corrosion products in the metallic ducting and piping of the system.
Gas Turbine Emission Control Techniques
Emission Control technique
NOx Lean Head End Liner; Water or Steam Injection; Dry Low NOx
Emission (DLE); Overspray fogging
CO Combustor Design; Catalytic reduction
UHC & VOC Combustor Design
SOx Control of sulfur in fuel
Particulates & PM-10 Fuel composition influencing Sulfur & Ash;
Smoke Combustor design; Fuel composition; Air atomization
6. Exergy considerations
Publication of research articles on exergy consideration in power cycles dates back about
four decades now, possibly with the initial work of Kalina (1984) on the combined cycle
system with novel bottoming cycle and that of El-Sayed and Tribus (1985) on a theoretical
comparison of the Rankine and Kalina cycles. This was followed with the work of Zheng et
al. (1986a) on Energy Utilization Diagram (EUD) for two types of LNG power-generation
systems; Zheng (1986b) on graphic exergy analysis for coal gasification-combined power
cycle based on EUD; Ishida et al. (1987) on evaluation of a chemical-looping-combustion
power-generation system by graphic exergy analysis; and Wall et al. (1989) ending the first
decade with an exergy study of the Kalina cycle that began the decade.
In the second decade belong the works of Najjar (1990) on hydrogen fuelled and cooled gas
turbines; Ishida et al. (1992a) on graphic exergy analysis of fuel-cell systems based on EUDs;
Jin & Ishida (1993) on graphical analysis of complex cycles; Joshi et al. (1996) on a review of
IGCC technology; and Jaber et al. (1998) on gaseous fuels (derived from oil shale) for heavy-
duty gas turbines and Combined Cycle Gas Turbines.
The third decade began with the analysis of Bilgen (2000) on exergetic and engineering
analysis of gas turbine-based cogeneration systems; Thongchai et al. (2001) on simplification
of power cycles with EUDs; Marrero et al. (2002) on 2
nd
law analysis and optimization of a
combined triple power cycle; Jin & Ishida (2004) on graphic presentation of exergy loss in
mixing on an EUD; Khaliq (2004) on second-law analysis of the Brayton/Rankine combined
power cycle with reheat; Khaliq (2004b) on thermodynamic performance evaluation of
combustion gas turbine cogeneration systems with reheat; Ertesvag et al. (2005) on exergy
analysis of a gas turbine combined cycle power plant with pre-combustion CO
2
capture; Tae
won Song et al. (2006) on performance characteristics of a MW-class SOFC/GT hybrid
system based on a commercially available gas turbine; Guillermo Ordorica-Garcia et al.
(2006) on technoeconomic evaluation of IGCC power plants for CO
2
avoidance; Fagbenle et
Exergy and Environmental Considerations in Gas Turbine Technology and Applications
51
al (2007) on thermodynamic analysis of biogas-fired integrated gasification steam-injected
gas turbine (BIG/STIG) plant; Karellas et al. (2008) on thermodynamic evaluation of
combined cycle plants; Fadok et al. (2008) on an update on advanced hydrogen turbine
development; Bartieri et al. (2008) on biomass as an energy resource – the thermodynamic
constraints on the performance of the conversion process in producing synthetic gas
(syngas) for high efficiency internal combustion engines such as CCGT as well as in fuel
cells (MCFC and SOFC) after adequate cleaning up and reforming; Khaliq (2009a) on exergy
analysis of a gas turbine trigeneration system for combined production of power, heat and
refrigeration; Khaliq (2009b) on energy and exergy analyses of compression inlet air-cooled
gas turbines using the Joule-Brayton refrigeration cycle; Khaliq (2009c) on exergy analysis of
the regenerative gas turbine cycle using absorption inlet cooling and evaporative
aftercooling; Farzaneh-Gord et al. (2009) on a new approach for enhancing performance of a
gas turbine using as a case study the Khangiran refinery in Iran; Fachina (2009) on Exergy
accounting – the energy that matters; and finally closing the highly productive decade with
Baratieri et al. (2009) on the use of syngas in IC engines and CCGT.
The fourth decade has begun with Woudstra et al. (2010) on thermodynamic evaluation of
combined cycle plants. This does in no way claim to be a complete account of all the
contributions to exergy analyses of power cycles from inception to the present time, rather
we have tried to give some highlights on the journey so far.
Exergetic Analyses of Power Cycles – Gas Turbines, CCGTs, IGCC & BIG/STIG
Dincer and Rosen (2007) have listed the following benefits of using exergy analysis in
industrial plant equipment and processes:
•
Efficiencies based on exergy, unlike those based on energy, are always measures of the
approach to true ideality, and therefore provide more meaningful information when
assessing the performance of energy systems. Also, exergy losses clearly identify the
locations, causes and sources of deviations from ideality in a system.
•
In complex systems with multiple products (e.g., cogeneration and trigeneration
plants), exergy methods can help evaluate the thermodynamic values of the product
energy forms, even though they normally exhibit radically different characteristics.
•
Exergy-based methods have evolved that can help in design-related activities. For
example, some methods (e.g., exergoeconomics and thermoeconomics) can be used to
improve economic evaluations. Other methods (e.g., environomics) can assist in
environmental assessments.
•
Exergy can improve understanding of terms like energy conservation and energy crisis,
facilitating better responses to problems.
The following table comparing energy and exergy from Dincer & Cengel [ ] is also useful in
appreciating exergy.
According to Szargut et al. [1988], “exergy is the amount of work obtainable when some
matter is brought to a state of thermodynamic equilibrium with the common components of
the natural surroundings by means of reversible processes, involving interaction only with
the above mentioned components of nature”. Four different types of exergy are identifiable
in principle, denoted as kinetic, potential, physical and chemical exergy, Masim and Ayres
[ ], viz.:
ε = ε
k
+ ε
p
+ ε
ph
+ ε
ch
Gas Turbines
52
ENERGY EXERGY
Is dependent on the parameters of matter
or energy flow only, and independent of
the environment parameters.
Is dependent on both the parameters of
matter or energy flow and on the
environment parameters.
Has the values different from zero (equal
to mc
2
upon Einstein’s equation)
Is equal to zero (in dead state by equilibrium
with the environment).
Is governed by the 1
st
Law of
Thermodynamics (FLT) for all the
processes.
Is governed by the 1
st
Law of
Thermodynamics (FLT) for reversible
processes only (while it is destroyed partly
or completely in irreversible processes).
Is limited by the 2
nd
Law of
Thermodynamics (SLT) for all processes
(including reversible ones).
Is not limited for reversible processes due to
the 2
nd
Law of Thermodynamics (SLT).
Is motion or ability to produce motion. Is work or ability to produce work.
Is always conserved in a process, so can
neither be destroyed or produced.
Is always conserved in a
reversible process,
but is always consumed in an irreversible
process.
Is a measure of quantity only.
Is a measure of quantity and quality due to
entropy.
Table 6.1.
Kinetic and potential exergy (ε
k
& ε
p
) have the same meaning as their corresponding energy
or work terms, W
k
and W
p
, both of which are usually negligible in the analysis of most
common industrial processes. Physical exergy is the work obtainable by taking a substance
through reversible physical processes from its initial state at temperature T and pressure p
to the final state determined by the temperature T
o
and pressure p
o
of the environment,
Szargut et al. [1988]. Consideration of physical exergy is important for optimization of
thermal and mechanical processes including heat engines and power plants. However, it is
of secondary importance and often negligible when attention is focused on very large
systems, such as chemical and metallurgical processes, where chemical exergy dominates in
resource accounting and environmental analyses Masim and Ayres [ ]. Chemical exergy is
the work that can be obtained by bringing a substance having the temperature and pressure
(T,p) to a state of thermodynamic equilibrium with the datum level components of the
environment. It has two components – one associated with chemical reactions occurring in
isolation, and the other associated with the diffusion of reaction products into the
surroundings, Masim and Ayres [ ]. Hence the importance of defining a reference state
when calculating both physical and chemical exergy. The exergy function is thus a measure
of the difference between two states, namely the state of the “target” system and that of its
surroundings (or, more appropriately, the ultimate state of the combined system plus its
surroundings, after they have reached mutual equilibrium of pressure p
o
, temperature T
o
,
and chemical composition μ
o
). As Masim and Ayres [ ] put it, the analytical expression for
exergy shows that exergy is a measure of the “thermodynamic distance” of the target system
from equilibrium, or alternatively, a measure of the “distinguishability” of the target system
from its environment.
For a closed system with (T,p), the exergy (loss) Δε is given by:
Δε = B = S(T-T
o
) – V(p-p
o
) + ∑μ
i
(N
i
– N
io
)
Exergy and Environmental Considerations in Gas Turbine Technology and Applications
53
where Ni is the number of moles of the i
th
system and μ
i
is its chemical potential. As noted
earlier, Δε ≤ 0, the equality holding only when the process is reversible. Here p
o
and T
o
are,
appropriately, the ambient atmospheric pressure and temperature respectively.
For a flow or open system, where mass crosses the system boundaries,
Δε = B = (H – H
o
) - T
o
(S-S
o
) - ∑μ
i
(N
i
– N
io
)
where H is enthalpy. In this case, it is important to have a knowledge of the detailed average
chemical composition of the reaction products and the environmental sink with which the
system reacts Masim and Ayres [ ].
Exergetic Analyses of Gas Turbine Cogeneration/Combined Cycle Plants
The generic name “Cogeneration or Combined Cycle” plants is used for gas turbine top cycle
plant whose hot exhaust is used for generating steam in a heat recovery steam generator
(HRSG) for a steam turbine bottom cycle. In these plants, the gas turbine combustion
chamber (combustor) is fuelled normally with liquid or gaseous fuels piped to the plant
from nearby storage tanks; the fuel is thus not produced on-site. Cogeneration/Combined
Cycle plants therefore generate additional power from the steam turbine. However, they
may also generate both power and steam from the steam turbine if process steam is required
on-site or elsewhere, as in district heating systems. In such a case, the Cogeneration/CC
plant would properly qualify to be called a Combined Heat and Power (CHP) Plant,
although this appellation is technically reserved for any power plant whose hot combustion
product gases are used to generate steam for on-site or other uses. Thus a CHP need not
have a gas turbine in its power production train, it could be any power plant that generates
“waste” heat from which we are able to extract “useful” thermal energy. In this regard,
many CHP plants are powered by large diesel Internal Combustion (I.C.) engines.
We first consider the work of Bilgen (2000) on exergetic analyses of gas turbine cogeneration
systems in which gas turbine cogeneration systems involving three different combinations
of power and steam generation from a gas turbine and a steam turbine fed with steam from
a HRSG were studied (see Figures 6.1, 6.2 and 6.3). The gas turbine exhaust gases produce
the steam in the HRSG.
Fig. 6.1. From Bilgen (2000).
Gas Turbines
54
Fig. 6.2. From Bilgen (2000)
Fig. 6.3. From Bilgen (2000).
Bilgen undertook a combustion analysis by calculating the composition of the fuel gas
mixture using direct minimization of the Gibbs function of formation of each compound I
from its constituent elements, using Lagrangian multipliers. The fuel utilization efficiency or
the 1
st
Law efficiency is given by
()
ep
f
WQ
E
C
η
+
= (6.1)
Where E
f
is the energy of the fuel, W
e
and Q
p
are the electrical energy and the thermal energy
of the process respectively while C is 0.98 as the parasitic system loss is assumed to be 2%.
The second law or exergy efficiency is defined as
()
ep
f
B
WB
ε
+
= (6.2)
Exergy and Environmental Considerations in Gas Turbine Technology and Applications
55
Where We is work, hence considered all exergy as earlier discussed, Bp is the exergy content
of process heat produced and Bf is the exergy content of fuel input. Expressions for the
energy and exergy terms above were given by Bilgen as follows:
f
ee ii
pr
Enhnh=−
∑
∑
(6.3)
1
2
12
22
()ln
y
O
fiieeo
rp
xx
CO H O
y
BngngRT
yy
⎛⎞
⎜⎟
=− +
⎜⎟
⎜⎟
⎝⎠
∑∑
(6.4)
where h
i
, h
e
are enthalpies and g
i
, g
e
are the Gibbs functions of reactants (shown with r) and
products (shown with p) for stoichiometric reaction of fuel evaluated at 1 bar and 298 K; y
i
α
is the mole fraction of component I in the environment.
A fuel exergy factor is defined as
f
f
f
B
E
ε
=
(6.5)
The exergy of the process heat produced is given by
B
p
= m
s
[(h-h
c
)- T
o
(s-s
c
)] (6.6)
where m
s
and s are the mass and entropy of the steam produced, sc is the entropy of the
condensate return, both at the process heat pressure, and T
o
is temperature of the
environment. Further,
Q
p
= m
s
(h-h
c
) (6.7)
Process heat exergy factor and power-to-heat ratio are defined as
p
p
p
Q
B
ε
= and
e
p
W
ph
Q
r = (6.8a,b)
A relationship can be established between exergy, ε, and fuel utilization, η, efficiencies using
the above equations as follows, Bilgen (2000):
1
p
ph
f
ph
r
r
ε
ε
η
ε
+
+
⎡
⎤
=
⎢
⎥
⎣
⎦
(6.9)
Two Case Studies corresponding to Figures 6.1 and 6.3 were considered in detail, and in
both cases, natural gas was used as fuel. Plant capacity factor was assumed to be 80%. The
data for Case Study I appear in Table 6.2 for base-load gas turbine at ISO conditions of 288 K
and 101.325 kPa, and 60% relative humidity and they are from a case study earlier reported
for an industrial gas turbine (the GE LM2500PE reported by Rice (1987) and Huang (1990).
Other parameters employed in the Case Study are isentropic efficiencies of compressor and
turbine of 70.4% and 92.6% respectively; intake air temperature same as ISO condition of
288K; process steam is saturated at 2026 kPa; temperature of condensate return is 373 K; and
the pinch point temperature difference is 50 K. Bilgen calculated the composition of the
products of combustion of natural gas with 226% air (in moles) as follows:
Gas Turbines
56
1 CO
2
; 0 CO; 2 HO
2
; 0.001 OH; 0 NO
2
; 0 NO; 24.515 N
2
; 4.52 O
2
. He also presented the
following parameters from his study which agreed quite well with those of Rice (1987) and
Huang (1990): cycle efficiency, air flow, specific work output, and exhaust temperature
compared quite well with Rice (1987) and fuel utilization efficiency, exergy efficiency, and
power-to-heat ratio compared quite well with Huang (1990).
Table 6.2. Base-load gas turbine data for Case Study I of Bilgen (2000).
The cycle efficiency of 37.62% in Table 6.3 below is for the gas turbine without cogeneration
while the fuel efficiency of 77.02% in the same Table 6.3 is for the cogeneration system. This
implies a 105% efficiency improvement. The exergy efficiency of the cogeneration system is
50.06% while Bilgen reports an exergy efficiency of only 35.78% for the system without
cogeneration, yielding a 40% improvement.
Table 6.3. Comparison of the results of Bilgen (2000) with those of Rice (1987) and Huang
(1990).
Process heat results of Bilgen (2000) appear in Table 6.4 below.
Fig. 6.4 below shows the 1
st
law and exergy (2
nd
law) efficiency and % steam extraction as a
function of power-to-heat ratio. The trends of the 1
st
and 2
nd
law efficiencies in the figure are
quite consistent with equations 6.1, 6.2, and 6.8b. The slow variation of the second law
efficiency with power-to-heat ratio indicates that the exergy content of the steam plus power
generated from the steam turbine is little degraded.
Exergy and Environmental Considerations in Gas Turbine Technology and Applications
57
Table 6.4. Process heat results of Bilgen (2000).
Fig. 6.4. shows the 1
st
law and exergy (2
nd
law) efficiency and % steam extraction as a
function of power-to-heat ratio.
Gas Turbines
58
Similarly, Fig. 6.5 shows power from the steam turbine, total power, process heat production
and payback period as a function of the power-to-heat ratio. The process steam production
(in t/h) follows the same relationship as that of the % steam extraction in Fig. 6.4.
Fig. 6.5. Total power, steam turbine power, process heat production and payback period as a
function of the power-to-heat ratio.
Exergy analysis of integrated gasification combined cycle gas turbine (IGCC) plants
Integrated Gasification Combined Cycle (IGCC) plants, as distinct from the general
Combined Cycle/Cogeneration plants, have an integrated fuel production unit (gasifier)
which provides the fuel (normally gaseous) required by the gas turbine combustors. The
feed into the gasifier could be a solid hydrocarbon (usually coal) or biomass (e.g.
agricultural wastes, lignocellulosic plants, etc.) as earlier noted in the section on
Conventional and New Environmental-conscious Aero and Industrial Gas Turbine Fuels. A
schematic of a coal-fired gasifier in an integrated coal gasification combined cycle gas
turbine plant (ICGCC) plant appears in Fig. 6.XXX below.
We shall consider a biogas-fired integrated gasification steam-injected gas turbine
(BIG/STIG) plant studied by Fagbenle et al. (2007) and shown schematically in Fig. 6.6
below. The Energy Utilization Diagram (EUD) popularized by the Ishida group and
discussed in section 6 of this chapter was used to highlight the exergy losses in the various
sub-systems of the plant. The EUD is a useful tool for exergy analysis of chemical processes
and plants in which the energy level or availability factor (A) is plotted against the energy-
transformation quantity (AH), enabling easy identification of subsystems with potentials for
performance improvement.
Exergy and Environmental Considerations in Gas Turbine Technology and Applications
59
Fig. 6.XXX. Simplified diagram of an integrated coal gasification combined cycle (ICGCC)
gas turbine plant. From Emun et al. (2010).
The BIG/STIG plant of Fig. 6.6 consists of a 53 MW gas turbine plant fuelled by fuel gas
(syngas assumed to be largely CH
4
) from a biogas gasifier and gas clean-up system. The
adiabatic combustion temperature was found from the 1
st
Law to be 1895K but a more
realistic (from metallurgical standpoint) turbine inlet temperature (TIT) of 1450 K was used
in the analysis. The turbine exhausts at 410 °C (TET) into a Heat Recovery Steam Generator
(HRSG) which produces steam for three purposes: injection steam into the turbine for blade
cooling, injection steam into the combustor for NOx emission reduction, and blast steam
required by the gasifier chemical process. The stack gases exhaust into the atmosphere at
151°C. Air flow of 141 kg/s and at 32.2 bar leaves the compressor, out of which 131.9 kg/s is
fed into the combustor while the remaining 9.1 kg/s is fed into the gasifier.
Basis of the Energy Utilization Diagram
The exergy change Δε
i
over all the energy donors and acceptors “i” in the energy-
transformation system is:
0
()
iii
ii
HTS
ε
Δ
=Δ−Δ
∑
∑
(6.10)
By the 1
st
law of thermodynamics, the first term on the RHS of the above equation is zero,
since the energy released by the energy donor must equal that gained by the energy
acceptor. Also, by the 2
nd
law of thermodynamics, to total entropy change in the system
must be greater than or equal to zero, the equality being for isentropic (lossless) processes,
i.e.
0
i
i
S
Δ
≥
∑
(6.11)
Hence,
io i
ii
TS
ε
Δ
=− Δ
∑
∑
(6.12)
The availability-factor or the energy level (an intensive parameter) is defined by
Gas Turbines
60
Fig. 6.6. BIG/STIG based on GE LM 5000 aero-derivative gas turbine [Williams (1988)].
0
1
S
HH
A T
ε
Δ
Δ
Δ
Δ
= =− (6.13)
It is seen that the relationship between the availability-factor of energy donors and energy
acceptors is A
ed
≥ A
ea
since in the energy change of the acceptor process, ΔH
ea
> 0. The
exergy loss in the system is thus given by
()0
ieaedea
i
HA A
ε
−
Δ= Δ − ≥
∑
∑
(6.14)
which, in the limit, gives the system exergy loss as:
0
()
ea
H
iedeaea
AAdH
ε
−Δ= −
∑
∫
(6.15)
A plot of the energy level of the energy donating process (A
ed
) and the energy accepting
process (A
ea
) against the transformed energy (ΔH
ea
) gives the energy loss in the system as
the area between the curves of A
ed
and A
ea
. This is the EUD diagram and the energy level
difference (A
ed
– A
ea
) is indicative of the driving force for the energy transformation process.
A summary of the operating conditions together with the results of the 1
st
law efficiencies
appears in Table 6.5 below, assuming compressor and turbine isentropic efficiencies of 98%
each. The first law efficiency based on power production alone is 41.5% while it is 45%
based on both heat and power.
Exergy and Environmental Considerations in Gas Turbine Technology and Applications
61
Table 6.5.
2
nd
Law or Exergy Analysis and synthesis
Irreversibilities in the turbines and the compressors processes.
The processes through the 2 stages each of the turbines (LP & HP) and the compressors (LP
& HP) as well as that through the power turbine (PT) are done irreversibly, and their
irreversibilities are
For the turbines:
I
t
= (1 – η
t
)W
HPT,LPT & PT
= (1 – 0.98)(143) = 2.9 MW
For the compressors:
I
c
=
&
1
(1) 1.7
c
cLPCHPC
IW MW
η
=− =
The gross power input to the compressors is therefore W
gross,c
= 85 + 1.73 = 86.7 MW, while
the net generated power is W
net, generated
= 140.14 - 86.73 = 53.4 MW.
Irreversibility due to the discharge of hot combustion products at 151°C and 1 bar into the
environment is given by I
exh
= ε
stack gases
= 3.6 MW as detailed below:
Gas Exergy loss, MW
N
2
2.28
CO
2
0.148
CO 0.278
H
2
O 0.860
Gas Turbines
62
The Heat Recovery Steam Generator, HRSG
The pinch point on the heat donor side is 546 K and on 512 K on the acceptor side, giving
AT
pinch
= 34°C, while the irreversibility was found to be I
HRSG
= 7.7 MW.
Combustion chamber subsystem reaction
The total exergy loss in the combustion chamber, I
cc
, assuming the steam is not dissociated,
is given by
I
cc
= ε
fuel
– Δε
air
- Δε
steam
Assuming that the ratio φ of the specific chemical exergy of the fuel to its net calorific value
is 0.98, then
Icc = (0.98)(5622kJ/kg)(22.9 kg/s) – Δε
air
- Δε
steam
= 126.17 – 58.4 – 7
= 60.8 MW
It is seen that the exergy loss in the combustion chamber (60.8 MW) is about 49% of the fuel
exergy (126.17 MW). Table 6.6 summarizes the results.
Net generated power 53.4 MW
Exhaust temperature 151 °C
Pinch point 273 °C
Minimum ΔT 34 °C
Location Exergy Loss (MW) Fuel exergy, % Total exergy loss, %
Total exergy loss 76.7 60.8 1000
HRSG 7.7 6.1 10.1
Combustion chamber 60.8 48.2 79.3
Stacks exhaust gases 3.6 2.9 4.7
Turbines 2.9 2.3 3.8
Compressors 1.7 1.3 2.2
Table 6.6. Summary of the net generated power and the exegy loss (Irreversibilities) in the
BIG/STIG plant.
The Energy Utilization Diagrams (EUDs) for the combustion chamber and the HRSG
The EUD for the combustion chamber and the HRSG appear in Figs. 6.7 and 6.8 respectively.
The largest single subsystem exergy loss occurs in the combustion chamber, being about
79% of the total system exergy loss. The EUD for the HRSG indicates a pinch point of 273°C
on the heat donor side and a ΔT = 34°C. The cross-hatched area approximately equals the
calculated values shown in Table 6.6.
The irreversibility of the combustion process can be reduced by reducing the effective
temperature difference across which the heat transfer is taking place, i.e. between the
acceptor and the donor. In this case, preheating the reactants with the exhaust stack gases
would reduce the irreversibility of the combustion process. Both the energy and the exergy
in the stack gases in this case are both lost. Exergy loss associated with the steam injection
mixing process in the combustion chamber has not been taken into consideration, primarily
because the amount of steam injected is relatively small.
Exergy and Environmental Considerations in Gas Turbine Technology and Applications
63
Fig. 6.5. Energy-utilization for the combustion chamber.
Fig. 6.6. Energy-utilization diagram for the heat recovery steam generator (HRSG).
7. References
Emun, F., Gadalla, M., Majozi, T. and Boer, D. (2010). Integrated gasification combined cycle
simulation and optimization. Computers and Chemical Engineering, 34 (2000) 331-338.
Fagbenle, R. Layi, Oguaka, A.B.C., Olakoyejo, O.T. (2007). A thermodynamic analysis of a
biogas-fired integrated gasification steam injected gas turbine (BIG/STIG) plant.
Applied Thermal Engineering 27 (2007) 2220-2225.
Woudstra, N., Woudstra, T., Pirone, A. and van der Stelt, T. (2010). Thermodynamic
evaluation of combined cycle plants. Energy Conversion and Management 51
(2010) 1099-1110.
IPIECA Workshop (2004), Baltimore, USA, 12-13 October 2004.
Rail Transport and Environment – Facts and Figures, Nov. 2008.
Airline Industry Information, May 3, 2010.
The Seattle Times, Dec. 31, 2008.
Shepherd, D. G. Introduction to the Gas Turbine, D. van Nostrand Co. Inc. 1949.
Eastop, T. D. and McConkey, A. Applied Thermodynamics for Engineering Technologists.
2
nd
. Ed. Longmans, London. 1970.
Wikipedia, Typical specifications for Jet A-1 Aircraft Fuels. 2010.
Specifications for Fuel Gases for Combustion in Heavy-Duty Gas Turbines. GE Power
Systems, GEI 41040G, Revised Jan. 2002.
Chris Lewis, (2006). A gas turbine manufacturer’s view of Biofuels. Ppt presentation, Rolls
Royce plc.
Balat., M., Balat, M., Kirtay, E. and Balat, H. (2009). Main routes for the thermo-conversion
of biomass into fuels and chemicals. Part I: Pyrolysis systems. Energy Conversion
and Management 50 (2009) 3147-3157.