Develop a project planning method based on building information model (bim) to optimally reduce activity overlaps and time cost
Bạn đang xem bản rút gọn của tài liệu. Xem và tải ngay bản đầy đủ của tài liệu tại đây (2.02 MB, 108 trang )
VIET NAM NATIONAL UNIVERSITY HO CHI MINH CITY
HO CHI MINH CITY UNIVERSITY OF TECHNOLOGY
TU ANH NGUYEN
DEVELOP A PROJECT PLANNING METHOD BASED ON
BUILDING INFORMATION MODEL (BIM) TO OPTIMALLY
REDUCE ACTIVITY OVERLAPS AND TIME COST
Major:
Construction Management
Major code:
8580302
MASTER’S THESIS
HO CHI MINH CITY, July 2023
THIS THESIS IS COMPLETED AT
HO CHI MINH CITY UNIVERSITY OF TECHNOLOGY – VNU-HCM
Supervisor: Assoc. Prof. Long Duc LUONG
Examiner 1: Assoc. Prof. Hoc Duc TRAN
Examiner 2: Dr. Cuong Viet CHU
This master’s thesis is defended at HCM City University of Technology,
VNU-HCM on July 13th, 2023.
Master’s Thesis Committee:
(Please write down full name and academic rank of each member of the
Master’s Thesis Committee)
1. Dr. Thu Anh NGUYEN
- Chairman
2. Dr. Minh Nhat HUYNH
- Member, Secretary
3. Assoc. Prof. Hoc Duc TRAN
- Reviewer 1
4. Dr. Cuong Viet CHU
- Reviewer 2
5. Dr. Chau Ngoc DANG
- Member
Approval of the Chairman of Master’s Thesis Committee and Dean of Faculty
of Civil Engineering after the thesis being corrected (If any).
CHAIRMAN OF THESIS COMMITTEE
HEAD OF FACULTY OF CIVIL
ENGINEERING
Dr. Thu Anh NGUYEN
Assoc. Prof. Dr. Tuan Anh LE
VIETNAM NATIONAL UNIVERSITY-HO CHI MINH CITY
HO CHI MINH CITY UNIVERSITY OF TECHNOLOGY
SOCIALIST REPUBLIC OF VIETNAM
Independence – Freedom – Happiness
THE TASK SHEET OF MASTER’S THESIS
Full name: Tu Anh NGUYEN
Student code: 2171070
Date of birth: October 16th, 1999
Place of birth: Quang Nam, Vietnam
Major: Construction Management
Major code: 858032
I.
THESIS TOPIC:
Develop a project planning method based on building information model (BIM)
to optimally reduce activity overlaps and time costs.
Phát triển phương pháp hoạch định dự án dựa trên mơ hình thơng tin BIM để
giảm tối ưu sự chồng lấn của các công tác và thời gian – chi phí.
II.
TASKS AND CONTENTS: Optimization in Construction Project
III.
TASKS STARTING DATE: February 2nd, 2023
IV.
TASKS ENDING DATE: June 10th, 2023
V.
INSTRUCTOR: Assoc. Prof. Long Duc LUONG
Ho Chi Minh City, June 10th, 2023
ADVISOR
HEAD OF DEPARTMENT
Assoc. Prof. Long Duc LUONG
Dr. Long Hoai LE
DEAN OF FACULTY OF CIVIL ENGINEERING
Assoc. Prof. Dr. Tuan Anh LE
i
ACKNOWLEDGEMENT
I would like to express my deepest appreciation and gratitude to all those who have
supported and contributed to the completion of my master thesis in Construction
Management as part of the International Master Programs (IMP) at the Ho Chi Minh City
University of Technology, Department of Civil Engineering.
First and foremost, I would like to extend my heartfelt thanks to my advisor, Assoc.
Prof. Luong Duc Long. Your guidance, expertise, and unwavering support throughout the
research process have been invaluable. Your profound knowledge and insightful
suggestions have helped shape and improve the quality of this thesis. I am truly grateful
for your patience, encouragement, and dedication.
I would also like to express my sincere gratitude to the faculty members of the
Department of Civil Engineering for their continuous encouragement, wisdom, and
valuable inputs. Their commitment to academic excellence and their willingness to share
their expertise have greatly enhanced my understanding and knowledge in the field of
Construction Management.
I would like to extend my appreciation to my fellow classmates and friends who
have provided me with valuable insights, discussions, and support throughout my academic
journey. Your presence and camaraderie have made this experience enjoyable and
memorable.
Additionally, I am deeply grateful to the staff and librarians at the Ho Chi Minh
City University of Technology for their assistance and resources, which have greatly
facilitated my research.
Finally, I would like to acknowledge my family for their unconditional love,
encouragement, and understanding throughout my studies. Their unwavering support has
been the foundation of my success.
Thank you all once again for your guidance, encouragement, and support.
Tu Anh NGUYEN
ii
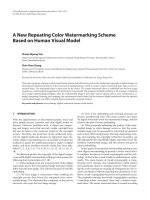
ABSTRACT
With the rise in usage of building information modeling (BIM) systems, there is a
greater demand for a construction schedule management system that can make more
sophisticated decisions. When there is a significant overlap between construction activities,
it can lead to poorer performance in those areas. As a result, a suitable construction
timetable should be created to reduce the overlap of nearby construction operations. One
potential solution for this problem is an active system. This research aims to provide a
methodical approach and computer system for simulating an ideal construction timetable
that eliminates overlapped tasks and improves operational performance. The primary
objectives of this study are to identify overlapping activities, apply fuzzy theory, and
evaluate the risks associated with schedule overlap problems. The genetic algorithm (GA)
theory is also applied to optimize the overlap of high-risk activities. The study created a
four-dimensional (4-D) environment system that utilizes building information modeling
(BIM), and it includes a scheduling simulator, as well as fuzzy and GA analysis tools. To
demonstrate the effectiveness of this approach, the study presented a case study based on
a real project.
Keywords: BIM implementation in construction projects, 4-D modeling, ratio
analysis of schedule overlaps, optimization of schedules using genetic algorithm, and time
and cost management.
iii
TÓM TẮT LUẬN VĂN THẠC SĨ
Với sự gia tăng trong việc sử dụng các hệ thống mơ hình hóa thơng tin xây dựng
(BIM), nhu cầu về một hệ thống quản lý tiến độ xây dựng có thể đưa ra các quyết định tinh
vi hơn ngày càng tăng. Khi có sự chồng chéo đáng kể giữa các hoạt động xây dựng, nó có
thể dẫn đến hiệu suất kém hơn trong các lĩnh vực đó. Do đó, cần tạo ra một thời gian biểu
xây dựng phù hợp để giảm sự chồng chéo của các hoạt động xây dựng lân cận. Một giải
pháp tiềm năng cho vấn đề này là một hệ thống đang hoạt động. Nghiên cứu này nhằm
mục đích cung cấp một cách tiếp cận có phương pháp và hệ thống máy tính để mơ phỏng
một thời gian biểu xây dựng lý tưởng giúp loại bỏ các nhiệm vụ chồng chéo và cải thiện
hiệu suất vận hành. Mục tiêu chính của nghiên cứu này là xác định các hoạt động chồng
chéo, áp dụng lý thuyết mờ và đánh giá rủi ro liên quan đến các vấn đề chồng chéo lịch
trình. Lý thuyết thuật toán di truyền (GA) cũng được áp dụng để tối ưu hóa sự chồng chéo
của các hoạt động rủi ro cao. Nghiên cứu đã tạo ra một hệ thống mơi trường bốn chiều (4D) sử dụng mơ hình hóa thơng tin tịa nhà (BIM) và nó bao gồm một trình mơ phỏng lập
lịch trình, cũng như các cơng cụ phân tích GA và mờ. Để chứng minh tính hiệu quả của
phương pháp này, nghiên cứu đã trình bày một nghiên cứu điển hình dựa trên một dự án
thực tế.
Từ khóa: Triển khai BIM trong các dự án xây dựng, mơ hình 4-D, phân tích tỷ lệ
chồng chéo lịch trình, tối ưu hóa lịch trình bằng thuật tốn di truyền, quản lý thời gian và
chi phí.
iv
AUTHOR’S COMMITMENT
The undersigned below:
Student full name:
Tu Anh NGUYEN
Student ID:
2171070
Place and date of born:
Quang Nam Province, Vietnam, October 16th, 1999
Address:
Binh Tan District, Ho Chi Minh City
With this declaration, the author finishes his master’s thesis entitled “DEVELOP
A PROJECT PLANNING METHOD BASED ON BUILDING INFORMATION
MODEL (BIM) TO OPTIMALLY REDUCE ACTIVITY OVERLAPS AND TIME
COST” under the advisor's supervision. All works, ideas, and materials that was gain from
other references have been cited correctly.
Ho Chi Minh City, June 10th, 2023
Tu Anh NGUYEN
v
TABLE OF CONTENTS
TABLE OF CONTENTS .................................................................................................. v
TABLE OF FIGURES ...................................................................................................viii
TABLE OF TABLES ........................................................................................................ x
LIST OF ABBREVIATIONS .......................................................................................... xi
CHAPTER 1: INTRODUCTION .................................................................................... 1
1.1. General Introduction ..................................................................................................... 1
1.2. Problem Statement ........................................................................................................ 1
1.3. Object and Range of Study ........................................................................................... 2
1.4. Scope of the Study ........................................................................................................ 3
1.5. Research Methodology ................................................................................................. 3
1.6. Structure of the Study ................................................................................................... 4
CHAPTER 2: LITERATURE REVIEW ........................................................................ 5
2.1. Definitions and Concepts ............................................................................................. 5
2.1.1. Schedule..................................................................................................................... 5
2.1.2. Overlapping principle ................................................................................................ 7
2.1.3. Overlapping time impact ......................................................................................... 11
2.1.4. Overlapping costs and benefits ................................................................................ 12
2.1.5. Overlapping Time-cost tradeoff .............................................................................. 12
2.1.6. Fuzzy logic .............................................................................................................. 13
2.1.7. Mamdani and Sugeno Fuzzy Inference Systems ..................................................... 14
2.1.8. BIM implementation in construction planning and scheduling .............................. 15
2.1.9. Optimization in Construction .................................................................................. 16
2.1.10. Optimization Method............................................................................................. 18
2.2. Genetic Algorithms .................................................................................................... 19
2.2.1. Genetic Operators .................................................................................................... 21
vi
2.2.2. Advantages of Genetic Algorithm ........................................................................... 27
2.3. Previous research ........................................................................................................ 27
CHAPTER 3: RESEARCH METHODOLOGY .......................................................... 29
3.1. Algorithm for Finding Overlapping Schedule in Project Activities .......................... 30
3.2. Fuzzy-Based Risk Analysis Algorithm ...................................................................... 35
3.3. Algorithm for Optimizing Schedule Overlapping using Genetic Algorithm ............. 40
3.3.1. Schedule optimization application process ............................................................. 40
3.3.2. Function and constraints utilized in the optimization of the project’s schedule ..... 42
3.3.3. The process of generating an initial solution for the GA algorithms ...................... 43
3.3.4. Establishing the fitness function .............................................................................. 44
3.3.5. Analysis of Genetic Algorithm operation ............................................................... 44
3.3.6. Tradeoff between the total cost of risk and the total overlapping duration ............. 45
3.3.7. Pareto Front ............................................................................................................. 46
3.4. System for Optimizing Schedule Overlapping using BIM-Based Simulation ........... 46
CHAPTER 4: MODEL IMPLEMENTATION AND VALIDATION ....................... 48
4.1. Model Implementation ............................................................................................... 48
4.1.1. Case study 1 ............................................................................................................. 48
4.1.2. Case study 2 – Bloomsdale Residence .................................................................... 62
4.2. Model validation ......................................................................................................... 73
4.3. Result Discussion ....................................................................................................... 73
CHAPTER 5: CONCLUSION AND RECOMMENDATION .................................... 75
5.1. Conclusion .................................................................................................................. 75
5.2. Research contribution ................................................................................................. 75
5.3. Future works ............................................................................................................... 76
REFERENCES ................................................................................................................ 77
APPENDICES .................................................................................................................. 81
vii
1. ANNEX A: Case study 2 detail work in MS Project .................................................... 81
2. ANNEX B: Case study 2 detail project time ................................................................. 82
3. ANNEX C: Case study 2 detail risk analysis ................................................................ 85
4. ANNEX D: Proposed MATLAB code .......................................................................... 87
viii
TABLE OF FIGURES
Figure 2.1: Activity on Node (AON) (P. B. Tarigan, 2021)[8] ....................................... 6
Figure 2.2: Activity on Arrow (AOA) (P. B. Tarigan, 2021)[8] ..................................... 7
Figure 2.3: Four types of activity relationships (Adopted from (Prasad, 1996)[11];
(Dehghan, Hazini, & Ruwanpura, 2011)[3] .................................................................... 9
Figure 2.4: The mechanism of activity overlapping (Dehghan & Ruwanpura, 2011)[10]
....................................................................................................................................... 10
Figure 2.5: Semi-independent activities' overlapping (Dehghan & Ruwanpura, 2011)[10]
....................................................................................................................................... 10
Figure 2.6: Schedule compression comparison ............................................................. 11
Figure 2.7: Overlapping time impact on the project schedule (Dehghan & Ruwanpura,
2011)[10] ....................................................................................................................... 12
Figure 2.8: Overlapping cost function (Dehghan, Hazini, & Ruwanpura, 2011)[3]..... 12
Figure 2.9: Fuzzy inference example ............................................................................ 15
Figure 2.10: Direct Cost, Indirect Cost, and Total Cost in Construction (Hegazy, 2002)[19]
....................................................................................................................................... 17
Figure 2.11: Optimization in Exact Method (P. B. Tarigan, 2021)[8] .......................... 18
Figure 2.12: General structure diagram of Genetic Algorithm ..................................... 21
Figure 2.13: The Single Point Crossover Method ......................................................... 24
Figure 2.14: The Two-Point Crossover Method ........................................................... 24
Figure 2.15: Uniform Crossover Approach ................................................................... 25
Figure 3.16: Overall Process of the Model .................................................................... 29
Figure 3.17: Typical condition of schedule overlapping ............................................... 32
Figure 3.18: The process of checking for schedule overlapping for each activity ........ 33
ix
Figure 3.19: Membership function for Probability (P), Intensity (I), Output and Fuzzy
Simulink......................................................................................................................... 36
Figure 3.20: Fuzzy rule surface in MATLAB ............................................................... 38
Figure 3.21: A process of schedule optimization using GA to optimize overlapping
schedule and time cost ................................................................................................... 41
Figure 3.22: TF-based solution generation method utilizing activity relationships ...... 44
Figure 4.23: Case study 1 bar chart ............................................................................... 49
Figure 4.24: Genetic algorithm with penalty value and average distance in case study 155
Figure 4.25: Optimized project schedule....................................................................... 57
Figure 4.26: Pareto front time-cost tradeoff for Case study 1 ....................................... 59
Figure 4.27: Updated schedule for objective 1 optimization ........................................ 60
Figure 4.28: Updated schedule for objective 2 optimization ........................................ 61
Figure 4.29: Pareto front of multi-objective optimization ............................................ 62
Figure 4.30: Some perspective views of the project ..................................................... 63
Figure 4.31: Project’s ground floor plan ....................................................................... 63
Figure 4.32: Project's first floor plan ............................................................................. 64
Figure 4.33: Risk degree of activity number 20 and 24, respectively ........................... 67
Figure 4.34: Multi objective optimization in Case study 2 ........................................... 68
Figure 4.35: Process of applying GA in MATLAB for achieving Multi-Objective
Optimization .................................................................................................................. 72
x
TABLE OF TABLES
Table 2.1: Mamdani and Sugeno advantages ................................................................ 14
Table 3.3: Determine ES and EF ................................................................................... 30
Table 3.4: Determine LS and LF ................................................................................... 31
Table 3.5: Membership function and five Euclidean distance values ........................... 35
Table 3.6: If-then rules in MATLAB ............................................................................ 36
Table 4.7: The project activities, description, duration and predecessors of case study 148
Table 4.8: Case study 1-Calculate project schedule ...................................................... 49
Table 4.9: Overlapping check for activity '2' ................................................................ 50
Table 4.10: Initial SOR value for all activities .............................................................. 51
Table 4.11: Probability (P) and Intensity (I) calculation ............................................... 52
Table 4.12: Initial overlapping duration of all activities ............................................... 53
Table 4.13: Case study 1 updated schedule after optimizing ........................................ 56
Table 4.14: Optimized SOR values for case study 1 ..................................................... 57
Table 4.15: New table activity for best solution 1 ........................................................ 59
Table 4.16: New table activity for best solution 2 ........................................................ 60
Table 4.17: Project's activity, duration, predecessors of case study 2 .......................... 64
Table 4.18: Top 10 risky activities of the project based on 5 Euclidean distance values66
Table 4.19: Movable duration corresponding with objective 1..................................... 68
Table 4.20: Movable duration corresponding with objective 2..................................... 69
Table 4.21: Movable duration exported from MATLAB.............................................. 70
Table 4.22: Comparison of the Optimum Solution from GA and Excel Solver ........... 73
xi
LIST OF ABBREVIATIONS
BIM
Building information modeling
AEC
The architecture, engineering, and construction industry
GA
Genetic algorithm
CPM
Critical path method
PERT
Program evaluation and review technique
PSO
Particle swarm optimization
DEA
Data envelopment analysis
DE
Differential evolution
SOR
Schedule overlapping ratio
RM
The risk cost
ES
Early start
EF
Early finish
LS
Late start
LF
Late finish
TF
Total float
1
CHAPTER 1: INTRODUCTION
1.1. General Introduction
The technology of successfully building information modeling (BIM) in the
architectural, engineering, and construction (AEC) industry is one of the most promising.
By utilizing BIM (Building Information Modeling) technology, a realistic digital
representation of a building is generated. This model, known as a building information
model, encompasses the entire lifecycle of the facility, including planning, design,
construction, and operation. Architects, engineers, and builders can leverage this model to
gain insights into possible design, construction, or operational issues. It enables them to
visualize and assess the building virtually, facilitating the identification and resolution of
concerns before the actual construction process begins. The role integration of all project
stakeholders is supported by the new AEC revolution known as BIM. Current BIM
solutions mainly concentrate on presenting design and construction-phase data in a clear
and simple manner. The basic simulation of construction schedule data is integrated with
standard Navisworks functions. While these BIM functions enable visualization of
construction schedule data, they lack additional decision-making capabilities. Such
visualization-based BIM functions are classified as passive BIM systems that do not have
active decision-making features to offer dynamic solutions.
1.2. Problem Statement
Construction projects often involve numerous activities that overlap with each
other, meaning that multiple tasks are executed at the same time based on the construction
schedule [1]. Besides, overlapping activities are occurred due to the reduction of schedule
or to reasonable resource usage. Real-life instances of schedule overlap can be observed in
various construction projects, such as the cleanup/de-mob (demobilization) and mob/setup
(mobilization/setup) stages of sequential tasks. These stages involve transitioning from one
task to another, where the cleanup and demobilization of resources from a completed task
overlap with the mobilization and setup activities for the next task. When multiple activities
overlap in a construction project, it can lead to various challenges with managing time and
resources, which are often unavoidable in most cases. This study specifically focuses on
activity overlaps and does not consider the actual distance between activities as a factor
that can present obstacles. The efficiency of building operations can be increased by
2
minimizing concurrent progress between tasks if there are few overlaps in the nearby work
area. Hossain and colleagues devised a simulation model to approximate the overall
duration of a project that incorporates overlapping tasks, as well as to predict the
anticipated number of reworks. If a project schedule can be optimized successfully, a
suitable system to consider would be an active Building Information Modeling (BIM)
system equipped with the required decision-making capabilities. Such a system would
enable efficient and effective decision-making throughout the project lifecycle. The results
indicate that the anticipated reduction in project duration and the number of reworks are
influenced by the reliability of information obtained during earlier stages and the sensitivity
of subsequent operations. Furthermore, unplanned overlap could result in excessive design
and construction work that could be very expensive rather than necessarily shortening the
project’s duration. The suggested optimization method helps in selecting an overlay
strategy by decreasing the expected amounts of reworks while keeping the project
completion date [2]. If activities overlap, there may also be a shortage of working area and
defection.
Various schedule compression techniques have emerged in response to the need for
project completion in a shorter amount of time. Fast-tracking is recognized by the Project
Management Body of Knowledge (PMOK) as a method for compressing the timetable.
Fast-tracking involves doing stages or operations that would typically be done in
succession in parallel, or more precisely, by overlapping them. As a result of these
overlaps, there may be more work and risk [3]. Implementing this approach may involve
completing tasks without having all the required information, leading to a trade-off
between the cost and benefits of time savings. However, this also increase the risk of
meeting the shortened project timeline [4].
1.3. Object and Range of Study
Object: The purpose of this research is to assess different levels of risk associated
with carrying out construction tasks that overlap and to create a systematic approach and
computer program for simulating schedules that minimize such overlaps in a specific
project. Additionally, the model will produce a range of ideal solutions, including the
schedule, expected duration, and risk cost for each task.
Range of study: Ho Chi Minh City, Vietnam.
3
1.4. Scope of the Study
To refine the research problem, the study delimits its scope by outlining the
following specifics:
a. Initially, a method is created for an automated exploration of potential overlaps in the
construction schedule.
b. If required, fuzzy algorithms and risk simulation model are established.
c. An optimization algorithm that employs the genetic algorithm (GA) is used for
activities with higher risks of overlap.
d. A Building Information Modeling (BIM) tool is utilized to generate a visually
dynamic representation of optimized schedule options.
e. The models are executed using the Genetic Algorithm in MATLAB.
f. Case studies used in the research are borrowed from prior studies and actual project.
1.5. Research Methodology
The following technique was used in this study to achieve the study's objectives:
a. Literature study
A literature review of current research developments is carried out to explore and
assess the pertinent issue connected to time-cost tradeoff and schedule optimization in
terms of the approaches and tools, then searched for prospective improvement that can be
achieved. The literature review serves as a general overview of overlapping principles and
overlapping time-cost tradeoffs.
b. Model development
A MATLAB programming-based model is developed through a thorough
examination of existing research, aiming to strike a balance between time and cost
considerations. The main objective of this model is to produce a range of optimal solutions
that minimize both project duration and expenses.
c. Validation of the developed model
To show the model's functionality, it was then put into a case study. The case study
is chosen from the previous research, and the result will then be compared to the earlier
findings of the primary research. This serves to verify the results and demonstrate the
effectiveness of the approach in solving the problem. Analysis and development of two
4
case studies are underway. One is a basic model to get at a decent outcome, while the other
is an example of how the model can handle a more challenging project.
1.6. Structure of the Study
The thesis includes five chapters:
-
Chapter 1: Introduction
-
Chapter 2: Literature review
-
Chapter 3: Methodology
-
Chapter 4: Model implementation and validation
-
Chapter 5: Conclusion and recommendation
-
References
5
CHAPTER 2: LITERATURE REVIEW
2.1. Definitions and Concepts
Three factors play a significant role in planning and controlling construction
projects: time, cost, and quality [5]. There are often various pathways in project schedules,
and one or more of them is critical. In many cases, overlapping non-critical activities are
negative to the project. On the other side, while overlapping critical activities might be
advantageous, it can also turn other noncritical activities become critical ones. The
overlapping principle, fuzzy logic, the Genetic Algorithm, and the trade-off between time
and cost in construction projects will be addressed in more detail in the following part.
2.1.1. Schedule
In project management, a schedule is a tool that is most commonly used to plan the
project step by step. A simple explanation of a schedule is that it's a plan indicating the
timing of every task within a project. By systematically analyzing each activity and its
relationship to the other activity, the project manager will be able to build a project on
paper before starting it. The schedule determines the start, duration, and finish date of
activities in the project. Knowing precisely the duration of the activities will have an impact
to the project cost. For instance, rent an equipment to do an activity without knowing
clearly how long the activity will take quickly reduce the planned profit. So, the project
manager must schedule the whole activities properly and effectively to meet the deadline
and not reduce profit.
Below is the process for scheduling the project:
1) Identify project activities
2) Determine activities sequence
3) Determine activities duration
4) Perform schedule calculation
5) Revise and adjust
6) Monitor and control
Several methods are commonly employed for scheduling construction projects. The
following are a few examples:
6
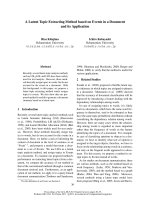
2.1.1.1. Critical Path Method (CPM)
The critical path method is the sequence of activities that results in the longest total
duration. It is the shortest possible time for the project’s completion [6].
When any activity in the critical path is delayed, it will impact the overall duration
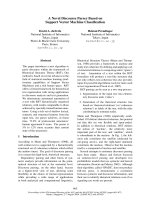
of the project. There are two ways to do CPM; they are AOA (Activity on Arrow) and
AON (Activity on Node). In AON, an activity is denoted by a box or node, whereas in
AOA, the activity is denoted by an arrow. AON, on the other hand, is preferred over the
AOA network due to its simplicity [7]. The two figures below describe the scheduling for
AON and AOA, respectively.
2
TF
3
3
Legend:
ES
1
EF
3
1
4
2
0
4
ID
LS
0
D
LF
0
0
0
START
0
0
0
2
1
0
0
2
4
2
2
2
2
2
4
1
3
1
6
5
4
3
0
4
Figure 2.1: Activity on Node (AON) (P. B. Tarigan, 2021)[8]
4
2
6
7
Start
Legend:
A3
3
1
4
ES
ID
EF
LS
Duration
LF
0
A1
2
A2
4
A5
6
0
2
2
2
4
2
6
A4
3
1
4
Figure 2.2: Activity on Arrow (AOA) (P. B. Tarigan, 2021)[8]
2.1.1.2. Program Evaluation and Review Technique (PERT)
PERT (Program Evaluation and Review Technique) is a statistical approach that is
utilized to analyze the tasks involved in completing a project. It is typically employed for
complex and uncertain projects when the specifics and durations of all activities are not
precisely defined. To use PERT, three-time estimates are assigned for each activity: the
optimistic time estimate (To), the most likely or normal time estimate (Tm), and the
pessimistic time estimate (Tp) [9]. The expected time can then be calculated as follows:
𝑇𝑒 =
𝑇𝑜 +4×𝑇𝑚 +𝑇𝑝
(1)
6
Standard deviation is calculated to see the probability to finish the project within
the expected time. Standard deviation and variance can be calculated as follows:
𝑆=
𝑇𝑜 −𝑇𝑝
(2)
6
𝑇𝑜 −𝑇𝑝 2
𝑆2 = (
6
)
(3)
2.1.2. Overlapping principle
In order to comprehend the principle of overlapping, it is important to recognize the
types of relationships that exist between activities. Bogus et al. (2005) have provided a
concise overview of Prasad's (1996) classification of the relationships between design
activities [10]. According to their research, four types of relationships are possible between
design activities:
8
a. Dependent activities: The first type of relationship involves an activity that is
dependent on another activity for final information.
b. Semi-independent activities: The second type of relationship occurs when an
activity requires only partial information from other activities to begin.
c. Independent activities: The third type of relationship occurs when there is no
information dependency between two activities.
d. Interdependent activities: The fourth type of relationship involves a two-way
information exchange between activities until they are both completed.
The risk of the relationships mentioned above varies significantly in terms of
activity overlap. The riskiest situation is when dependent activities overlap. This type of
connection is commonly referred to as a finish-to-start dependency, which implies that the
first activity (predecessor) must be finished before the second activity (successor) can
commence. Failing to complete the predecessor before starting the successor may
necessitate rework, as the successor may need to begin before the predecessor has supplied
all of the necessary information. Independent activities can overlap to any level without
losing any hazards. The availability of all necessary resources, including humans,
equipment, and materials, for both operations, must occur simultaneously. A typical project
schedule contains the majority of individual tasks. Activities that are semi-independent by
definition overlap to some extent. More overlapping, like dependent activities, will be
dangerous. Finally, for information to be shared and progress to be made, interdependent
activities must overlap. In other words, they overlap naturally rather than just as a means
to save time. Although its overlap carries the risk of delay and rework, it is necessary for
interdependent activities and should not be considered an additional risk. Based on the
above, no specific overlapping risk exists when independent or interdependent design
activities are overlapped. Risks are significant when overlapping dependent or semiindependent design activities.
9
Figure 2.3: Four types of activity relationships (Adopted from (Prasad, 1996)[11]; (Dehghan,
Hazini, & Ruwanpura, 2011)[3]
Figure 2.3 illustrates the process of overlapping two dependent activities, where the
start of one activity is reliant on the completion of another activity. This is because the
information generated by the predecessor activity is necessary for the successor activity.
However, in order to compress the timeline, the successor activity may intentionally begin
before the conclusion of its predecessor activity. This can be achieved if the predecessor
activity provides the successor activity with some preliminary information before it is
completed. The successor activity can then begin more quickly by using this initial data
and making relevant assumptions and predictions. During the time that the two activities
are in progress, some intermediate information may also be exchanged. Once the
predecessor activity is completed, it will provide its final information to the successor
activity.
The amount of rework required may be greatest when the successor activity needs
to implement a significant adjustment, and the final information provided by the
predecessor activity is substantially different from the preliminary information. The worstcase scenario in this situation is that the successor has to completely undo all of its
overlapping progress and start over. Because of this, any amount of rework cannot be
logically more than the time spent overlapping.
10
Figure 2.4: The mechanism of activity overlapping (Dehghan & Ruwanpura, 2011)[10]
Figure 2.5: Semi-independent activities' overlapping (Dehghan & Ruwanpura, 2011)[10]
The concept of overlapping dependent activities, as explained earlier, can be
expanded to semi-independent activities by treating the predecessor as two sequential
activities (A1 and A2). In this scenario, A1 takes place before the information exchange,
followed by A2 (as depicted in Figure 2.5). Consequently, A1 serves as the predecessor for
both A2 and B. This allows for the overlapping of activity A1 with activity B, utilizing the
mechanism of dependent activities, while activity A2 and activity B can overlap seamlessly
as they are independent.
There are two cases of overlap. Firstly, the overlapping of normal activities can be
reduced due to the unaffected project duration and risks. Secondly, the overlapping of
critical activities shall be decreased if the project manager determines the tradeoff between
time-cost and time-cost-quality because the more reduction in activities overlaps the more
project’s time lengthens. Besides, the critical activities are overlapped can lead to many
conflicts in worker’s productivity and rework time.
11
Construction overlap occurs when different stages of construction occur
concurrently instead of being completed sequentially, leading to a faster overall
construction schedule. Fast-tracking is a common cause of construction overlap, as it
involves compressing the construction schedule by overlapping tasks that would typically
be done separately.
While fast-tracking can speed up the construction process, it also increases the risk
of construction overlap. When different construction stages occur simultaneously, there is
a higher likelihood of conflicts arising between workers, materials, and equipment. This
can lead to delays, rework, and even safety hazards.
Fast-tracking also increases the complexity of project management, as it requires
close coordination and communication between different teams and contractors. This can
be challenging, as different teams may have different priorities and schedules, and it can
be difficult to ensure that everyone is on the same page.
Figure 2.6: Schedule compression comparison
2.1.3. Overlapping time impact
To accurately determine the time saved by overlapping design activities, it is
important to incorporate the overlapping mechanism in the project plan (as shown in Figure
2.7). While it may seem like overlapping two activities on the critical path of a project will
save time, this is not always the case. The actual time saved can be calculated by