Development of new insulation material from sugarcane bagasse and examination of the insulation effect depending on temperature and humidity
Bạn đang xem bản rút gọn của tài liệu. Xem và tải ngay bản đầy đủ của tài liệu tại đây (3.06 MB, 116 trang )
DISSERTATION FOR DOCTORAL (PHD) DEGREE
Le Duong Hung Anh
University of Sopron
Faculty of Wood Engineering and Creative Industries
Sopron
2023
DISSERTATION FOR DOCTORAL (PhD) DEGREE
University of Sopron
Faculty of Wood Engineering and Creative Industries,
József Cziráki Doctoral School of Wood Sciences and Technologies
Development of new insulation material from sugarcane bagasse and examination
of the insulation effect depending on temperature and humidity
in
Material Science and Technology
PhD Program: Wood Sciences and Technologies
Author: Le Duong Hung Anh
Supervisor: Dr. Zoltán Pásztory, Assoc. Professor
Sopron, Hungary
2023
DEVELOPMENT OF NEW INSULATION MATERIAL FROM SUGARCANE
BAGASSE AND EXAMINATION OF THE INSULATION EFFECT DEPENDING ON
TEMPERATURE AND HUMIDITY
Dissertation for doctoral (PhD) degree
University of Sopron
József Cziráki Doctoral School of Wood Sciences and Technologies
“Wood Sciences and Technologies” programme
Written by:
Le Duong Hung Anh
Made in the framework of
…................................................ programme
of the József Cziráki Doctoral School, University of Sopron
Supervisor: Dr. Zoltán Pásztory, Assoc. Professor
I recommend for acceptance (yes / no)
(signature)
The candidate reached …….... % at the complex exam,
Sopron, 21.06.2021
.......................................
Chairman of the Examination Board
As assessor I recommend the dissertation for acceptance (yes/no)
First assessor (Dr. ..............................................) yes/no
(signature)
Second assessor (Dr. ..........................................) yes/no
(signature)
(Possible third assessor (Dr. .......................................) yes/no
(signature)
The candidate reached .........% in the public debate of the dissertation
Sopron, …………..….2023
.......................................
Chairman of the Assessor Committee
Qualification of the doctoral (PhD) degree …..................................................
........................................
Chairman of the University Doctoral
and Habilitation Council (UDHC)
1.
DECLARATION
I, the undersigned Le Duong Hung Anh by signing this declaration certifying that my
PhD thesis entitled “Development of new insulation material from sugarcane bagasse and
examination of the insulation effect depending on temperature and humidity” was my own
work; during the dissertation, I complied with the regulations of Act LXXVI of 1999 on
Copyright and the rules of the doctoral dissertation prescribed by the Cziráki József Doctoral
School, especially regarding references and citations. 1
Furthermore, I declare that during the preparation of the dissertation, I did not mislead
my supervisor(s) or the program leader with regard to the independent research work.
By signing this declaration, I acknowledge that, if it can be proved that the dissertation is
not self-made or the author of a copyright infringement is related to the dissertation, the
University of Sopron is entitled to refuse the acceptance of the dissertation.
Refusing to accept a dissertation does not affect any other legal (civil law, misdemeanor
law, criminal law) consequences of copyright infringement.
Sopron, ……………2023
…………………………..
Le Duong Hung Anh
1
Act LXXVI of 1999 Article 34 (1) Anyone is entitled to quote details of the work, to the extent justified
by the nature and purpose of the recipient work, by designating the source and the author specified therein.
Article 36 (1) Details of publicly lectures and other similar works, as well as political speeches, may be
freely used for the purpose of information to the extent justified by the purpose. For such use, the source, along
with the name of the author, shall be indicated, unless this is impossible.
I
2.
Acknowledgements
A dissertation is an important accomplishment and achievements of life. It might not be
possible to complete the necessary research works reported in this thesis without the continuous
assistance, advice, encouragement and cooperations of my supervisor Assoc. Dr. Zoltán
Pásztory during my entire PhD study. I have received tremendous supports for technological
knowledge sharing, materials sourcing, guidance from my colleagues.
Furthermore, the reported works in this could not be conducted without the cordial
cooperations from the professors, teachers, and instructors from different laboratories of
University of Sopron. I am very grateful to get supported from Dr. Zoltán Bưrcsưk, Prof. Dr.
Zsolt Kovács, Zsófia Kóczán, Dr. K. M. Faridul Hassan for their continuous help and supports.
Moreover, I am also grateful and conveying special thanks to the administrative bodies of
University of Sopron for their kind supports during different official functioning of my Ph.D.
study in Sopron, Hungary.
Moreover, I would like to express my sincere gratitude to the “Tempus Public
Foundation” for providing me financial assistance through awarding “Stipendium Hungaricum
Scholarship” in 2019. I am also highly grateful acknowledging the supports from project,
TKP2021-NKTA-43 which has been implemented with the support provided by the Ministry
of Innovation and Technology of Hungary (successor: Ministry of Culture and Innovation of
Hungary) from the National Research, Development and Innovation Fund, financed under the
TKP2021-NKTA funding scheme.
Last but not least, I wish to express sincere thanks to my family and my precious friends
(Doan Thi Hai Yen, Le Van Tuoi) for their great support, enthusiasm, and motivation during
my difficult situations, which helped me enormously to keep patience during my Ph.D. study.
Finally, I am also grateful to the almighty creators of the Universe for providing me a
beautiful life with adequate strengths, capabilities, and knowledge.
II
3.
Table of Contents
DECLARATION ............................................................................................................... I
Acknowledgements .......................................................................................................... II
Table of Contents ............................................................................................................ III
List of Figures ................................................................................................................. VI
List of Tables .................................................................................................................. IX
List of Abbreviations ....................................................................................................... X
List of Notations ............................................................................................................XII
Abstract ............................................................................................................................. 1
CHAPTER I: INTRODUCTION ..................................................................................... 3
1.1. Problem statement, Potentiality, Gaps ................................................................ 3
1.2. Energy consumption in the building sector ........................................................ 3
1.3. The use of thermal insulation materials .............................................................. 4
1.4. Natural fibrous insulation materials.................................................................... 8
1.5. Thermal conductivity coefficient ........................................................................ 9
1.6. Factors influencing thermal conductivity of insulation materials .................... 11
1.6.1. Temperature ................................................................................................. 11
1.6.2. Moisture content .......................................................................................... 17
1.6.3. Density ......................................................................................................... 22
1.6.4. Thickness ..................................................................................................... 26
1.7. Research rationale and objectives ..................................................................... 28
1.8. Dissertation outline ........................................................................................... 28
1.9. Summary ........................................................................................................... 29
CHAPTER II: MATERIALS AND METHODS............................................................ 30
2.1. Materials ........................................................................................................... 30
2.1.1. Coir fiber ...................................................................................................... 30
2.1.2. Sugarcane bagasse fiber ............................................................................... 31
III
2.2. Sample preparation ........................................................................................... 32
2.2.1. Binderless coir fiber insulation boards......................................................... 32
2.2.2. Binderless bagasse fiber insulation boards .................................................. 32
2.2.3. Biocomposites and other samples ................................................................ 33
2.3. Methods ............................................................................................................ 34
2.3.1. Determination of thermal conductivity coefficient ...................................... 34
2.3.2. Examination of temperature-dependent thermal conductivity coefficient ... 35
2.3.3. Investigation of water absorption of natural fiber based insulation material35
2.3.4. Determination of moisture-dependent thermal conductivity coefficient ..... 37
2.3.5. Surface morphology and morphological analysis of binderless bagasse fiber
insulation boards ........................................................................................................... 38
2.3.6. Fourier transform infrared spectroscopy ...................................................... 39
2.3.7. Thermogravimetric analysis and the first derivative thermogravimetric ..... 40
2.3.8. Numerical simulations of heat and moisture transfer in the multi-layered
insulation materials ....................................................................................................... 40
2.4. Summary ........................................................................................................... 45
CHAPTER III: RESULTS AND DISCUSSION............................................................ 47
3.1. Determination of thermal conductivity coefficient of insulation materials ...... 47
3.1.1. Thermal conductivity of natural fiber reinforced polymer biocomposites .. 47
3.1.2. Thermal conductivity of cross-laminated coconut wood insulation panels . 48
3.1.3. Thermal conductivity of binderless natural fiber-based insulation boards .. 49
3.2. Examination of temperature-dependent thermal conductivity coefficient ....... 51
3.2.1. Temperature-dependent thermal conductivity of cross-laminated coconut
wood panels .................................................................................................................. 51
3.2.2. Temperature-dependent thermal conductivity of binderless coir fiber
insulation boards ........................................................................................................... 53
3.2.3. Temperature-dependent thermal conductivity of binderless bagasse fiber
insulation boards ........................................................................................................... 55
3.3. Investigation of water absorption of natural fiber insulation boards ................ 57
IV
3.3.1. Water absorption of binderless coir fiber insulation boards ........................ 57
3.3.2. Water absorption of binderless bagasse fiber insulation boards .................. 58
3.4. Examination of relative humidity dependence of thermal conductivity ........... 60
3.4.1. Relative humidity dependence of thermal conductivity of binderless coir fiber
insulation boards ........................................................................................................... 60
3.4.2. Relative humidity dependence of thermal conductivity of binderless bagasse
fiber insulation boards .................................................................................................. 62
3.5. Surface morphology and morphological analysis of binderless bagasse fiber
insulation boards ........................................................................................................... 64
3.6. Fourier transform infrared spectroscopic study ................................................ 66
3.7. Thermogravimetric analysis (TGA) ................................................................. 67
3.8. Numerical simulations ...................................................................................... 69
3.8.1. Heat and moisture transfer through the multi-layered building insulation
materials in stationary boundary conditions ................................................................. 70
3.8.2. Heat and moisture transfer through the multi-layered insulation materials in
dynamic boundary conditions ....................................................................................... 77
3.9. Summary ........................................................................................................... 82
CHAPTER IV: CONCLUSIONS AND FUTURE WORKS ......................................... 84
CHAPTER V: NOVEL FINDINGS OF THE RESEARCH .......................................... 86
List of publications ......................................................................................................... 89
References ....................................................................................................................... 91
V
5.
List of Figures
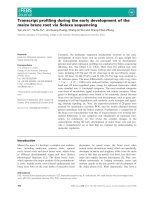
Figure 1.1 Classification of common insulation materials used in buildings ................... 5
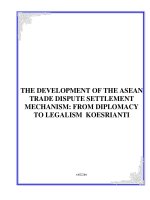
Figure 1.2 Common natural fibers used in reinforcement polymer composites ............... 9
Figure 1.3 Effect of mean temperature on thermal conductivity of various building
insulation materials: (a) inorganic materials; (b) organic materials; (c) advanced materials; (d)
combined materials ................................................................................................................... 16
Figure 1.4 Effect of moisture content on thermal conductivity of various building
insulation materials: (a) fiberglass; (b) rockwool; (c) natural materials; (d) aerogel ............... 21
Figure 1.5 Comparison of thermal conductivity regarding the density of common
insulating materials................................................................................................................... 22
Figure 1.6 Effect of density on thermal conductivity of various building insulation
materials: (a) conventional insulation materials; (b) natural fibrous insulation materials ....... 25
Figure 2.1 Coir fiber extracted from coconut husk resources ......................................... 30
Figure 2.2 Bagasse fiber extracted from sugarcane waste resources .............................. 31
Figure 2.3 (a) Tested sample; (b) Schematic of polystyrene specimen holder ............... 32
Figure 2.4 Fabrication of binderless bagasse insulation materials: (a) hydrodynamically
treated fiber; (b) disc shape wet mats; (c) and dry sample ....................................................... 33
Figure 2.5 (a) Rice straw/reed fiber reinforced PF biocomposites; (b) Coir fiber reinforced
PF biocomposites; (c) Cross-laminated made with coconut wood insulation panels. ........ 33-34
Figure 2.6 Transversal cut of a typical single heat flow meter apparatus ....................... 35
Figure 2.7 Photograph of water absorption process using a desiccator .......................... 37
Figure 2.8 Photograph of testing the moisture content percentage of CTCP specimen . 37
Figure 2.9 Photograph of digital microscope Targano FHD equipment ........................ 38
Figure 2.10 Photograph of SEM Hitachi S-3400N equipment ....................................... 39
Figure 2.11 Photograph of FT/IR-6300 equipment ........................................................ 40
Figure 2.12 Photograph of TGA equipment ................................................................... 40
Figure 2.13 Modelled image of multi-layered insulation materials with three layers
(Oriented strand board-Cellulose fiber board-Oriented strand board) ..................................... 41
Figure 2.14 Ambient data for temperature and relative humidity used on the exterior side
of the wall: (a) summertime; (b) wintertime ............................................................................ 45
Figure 3.1 Thermal conductivity values of CTCP regarding the increase of mean
temperature ............................................................................................................................... 51
VI
Figure 3.2 Thermal conductivitiy values of CTCP regarding the increase of density at
different mean temperatures ..................................................................................................... 52
Figure 3.3 Thermal conductivity values of BCIB regarding the increase of mean
temperatures ............................................................................................................................. 53
Figure 3.4 Thermal conductivity values of BCIB regarding the increase of density at
different mean temperatures ..................................................................................................... 55
Figure 3.5 Thermal conductivity values of BBIB regarding the increase of mean
temperatures ............................................................................................................................. 56
Figure 3.6 Moisture content of BCIB regarding the increased relative humidity levels 58
Figure 3.7 Water absorption percentages of bagasse fiberboard regarding the absorbent
time ........................................................................................................................................... 59
Figure 3.8 Moisture content of BBIB regarding the increased relative humidity levels 60
Figure 3.9 Thermal conductivity values of BCIB regarding the increased relative humidity
levels ......................................................................................................................................... 62
Figure 3.10 Thermal conductivity values of BBIB regarding the increased relative
humidity levels ......................................................................................................................... 63
Figure 3.11 Surface morphology of binderless bagasse insulation boards ..................... 64
Figure 3.12 SEM micrographs of bagasse particles: (a) 100×; (b) 450ì (magnification
bars with scale in àm are given on the photographs) ............................................................... 65
Figure 3.13 SEM micrographs of binderless bagasse fiber insulation boards: (a) 450× ,
(b) 100× (magnification bars with scale in µm are given on the photographs) ....................... 65
Figure 3.14 FTIR spectra of binderless bagasse fiber insulation board .......................... 66
Figure 3.15 (a) Thermogravimetric analysis (TGA) curve, (b) The first derivative (DTG)
of raw bagasse, bagasse particle, and long bagasse fiber ......................................................... 67
Figure 3.16 Thermogravimetric analysis curve and the first derivative of the TGA curve
of bagasse fiber insulation board .............................................................................................. 68
Figure 3.17 Influence of mean temperature and relative humidity in the effective thermal
conductivity values of the multi-layered wall structure at different thicknesses. .................... 70
Figure 3.18 Changes in the values of the effective thermal resistance regarding the
variations of mean temperature and thickness at different relative humidity levels: (a) 33%RH;
(b) 57%RH; (c) 75%RH ........................................................................................................... 73
Figure 3.19 Changes in the values of the effective thermal resistance regarding the
variations of relative humidity and temperature at different thicknesses: (a) 50 mm; (b) 120 mm;
(c) 150 mm; (d) 200 mm .......................................................................................................... 74
VII
Figure 3.20 Changes in the thermal transmittance coefficient regarding the increase in
thickness of insulation layer and variations of temperature and relative humidity ................. 75
Figure 3.21 Changes in moisture content and moisture storage capacity regarding the
variations of temperature, relative humidity at the 50 mm thickness of cellulose fiberboard . 76
Figure 3.22 The effective thermal conductivity variations regarding the ambient
temperature and relative humidity for 2 days in summertime and wintertime and their fitting by
LSM .......................................................................................................................................... 77
Figure 3.23 Variations of heat and moisture flux through: (a) internal; (b) external
surfaces (b) in summertime ...................................................................................................... 79
Figure 3.24 Variations of heat and moisture flux through: (a) internal; (b) external
surfaces (b) in wintertime ......................................................................................................... 79
Figure 3.25 Changes in moisture content regarding the ambient relative humidity: (a)
summertime; (b) wintertime ..................................................................................................... 81
VIII
6.
List of Tables
Table 1.1 Classification of the commonly used insulation materials and uncertainty about
their thermal conductivity .......................................................................................................... 6
Table 1.2 Linear relationship between thermal conductivity and mean temperature of
some commonly used insulation materials ............................................................................... 14
Table 1.3 Linear relationship between thermal conductivity and moisture content of some
traditional, alternative, and advanced materials ....................................................................... 20
Table 1.4 Linear relationship between thermal conductivity and density of some natural
fibrous insulation materials ...................................................................................................... 24
Table 1.5 Material cost, energy saving, and energy consumption regarding insulation
thickness of various thermal insulation materials .................................................................... 27
Table 2.1 Chemical compositions, physical properties of coir fiber .............................. 30
Table 2.2 Chemical compositions, physical properties of bagasse fiber ........................ 31
Table 2.3 Experimental design for rice straw/reed fiber reinforced PF biocomposites.. 34
Table 2.4 Experimental design for long/short coir fiber reinforced PF biocomposites .. 34
Table 2.5 Temperature variation between cold and hot sides ......................................... 35
Table 2.6 Solutions used for water absorption test and respective relative humidity..... 36
Table 2.7 Boundary conditions for stationary study of the influence of temperature,
relative humidity in thermal characterization of multi-layered insulators at different thicknesses
of insulation layer ................................................................................................................ 42-43
Table 3.1 Thermal conductivity and thermal resistance values of coir fiber reinforced
phenolic resin biocomposites (CFPC) and rice straw/reed fiber reinforced phenolic resin
biocomposites (REPC) ............................................................................................................. 48
Table 3.2 Thermal conductivity and thermal resistance values of cross-laminated coconut
wood insulation panel (CTCP) ................................................................................................. 49
Table 3.3 Thermal conductivity and thermal resistance values of binderless coir fiber
insulation boards (BCIB) and binderless bagasse insulation boards (BBIB) ........................... 49
Table 3.4 TG and DTA results for raw bagasse, long bagasse chip, bagasse particle, and
binderless bagasse insulation board ......................................................................................... 69
Table 3.5 Relationship between the λeff and mean temperature at different relative
humidity levels as a linear function .......................................................................................... 72
Table 3.6 Relationship between the λ eff and relative humidity at different mean
temperatures as a linear function .............................................................................................. 72
IX
7.
List of Abbreviations
ASTM
American Society for Testing and Materials
BBIB
Binderless bagasse fiber insulation boards
BCIB
Binderless coir fiber insulation boards
CFPC
Coir fiber reinforced phenol formaldehyde biocomposites
CTCP
Cross-laminated coconut wood panels
DTG
Derivative thermogravimetric
ENR
Expanded nitrile rubber
EPS
Expanded polystyrene
ETCs
Effective Thermal Conductivities
EVA
Ethylene vinyl acetate
FTIR
Fourier tranform infrared spectroscopy
GFPs
Gas filled panels
LWAC
Lightweight aggregate concrete
MC
Moisture content
MSC
Moisture storage capacity
OIT
Optimum insulation thickness
PCM
Phase change materials
PE
Polyethylene
PF
Phenol formaldehyde
PIR
Polyisocyanurate
PS
Polystyrene
PUR
Polyurethane
REPC
Rice straw and reed fiber reinforced phenol formaldehyde biocomposites
RH
Relative humidity
TGA
Thermogravimetric analysis
TIM
Thermal insulation material
X
XPS
Extruded polystyrene
VIPs
Vacuum insulation panels
WA
Water absorption
XI
8.
List of Notations
λ
Thermal conductivity coefficient (W/(m·K))
d
Thickness (mm)
ρ
Density (kg/m3)
R
Thermal resistance ((m2·K)/W)
R2
Coefficient of determination
U
Thermal transmittance coefficient (W/(m2·K))
w
Moisture content (%)
XII
Le Duong Hung Anh – PhD Dissertation | 1
9.
Abstract
The development of thermal insulation materials derived from natural fiber resources
used in buildings and constructions has been currently solving the global energy consumption
and preservation. The Ph.D. research works mainly focus on the following problems: the main
factors influencing the thermal conductivity coefficient of building insulation materials; the
fabrication of binderless insulation materials made of natural fiber and their thermal
conductivity under the effect of temperature and relative humidity; the water absorption of
natural fiber-based insulation materials regarding the variations of relative humidity; the
relationship between thermal conductivity value and their influencing factors; numerical
simulations of the heat and moisture transfer in multi-layered insulation materials used as an
exterior wall for building envelopes.
The findings from the Ph.D. research works can be figured out as follows: firstly, the
novel thermal insulation material made from sugarcane bagasse fiber produced without any
binders or additives showing a potentiality for building insulation applications due to their low
thermal conductivity coefficients which were found of 0.04–0.055 W/(m·K). Secondly, the
thermal conductivity values of natural fiber-based insulation materials were measured at
different operating temperatures range from -10 to 50 °C using the heat flow meter method.
Accordingly, the thermal conductivity values of binderless coir fiber insulation boards were
recorded from 0.037 to 0.066 W/(m·K) while the values found for binderless bagasse fiber
insulation boards were in the range of 0.041–0.057 W/(m·K). In addition, the percentage rate
of changes in the thermal conductivity values of binderless bagasse fiberboards was recorded
from 16 to 20% demonstrating that these boards had a lower heat consumption according to the
European-certified reference materials for thermal conductivity measurement. Thirdly, the
practical examination of relative humidity dependence of thermal conductivity demonstrated
the great influence of this factor on thermal performance. The thermal conductivity values of
three samples of binderless coir fiber insulation boards were recorded in the range of
0.049 – 0.066 W/(m·K), 0.058 – 0.094 W/(m·K), and 0.069 – 0.107 W/(m·K) regarding the
humidity range of 16.5–90%, whereas the values of thermal conductivity of three specimens of
binderless bagasse fiber insulation boards were found of 0.044–0.049 W/(m·K), 0.046–0.052
W/(m·K), 0.058–0.069 W/(m·K) when the relative humidity increased from 33 to 96%. As a
result, the obtained thermal conductivity values provided a better thermal insulated quality than
that of other bio-based products and composites. On the other hand, the water absorption of
natural fiber insulation materials related to relative humidity was also investigated using the
Le Duong Hung Anh – PhD Dissertation | 2
climatic chamber and the desiccator method. Results showed a similar sorption behaviour for
all tested specimens in that they exhibited a typical behaviour of natural fibrous materials with
a high increase of water absorption above 75% relative humidity. The water uptake of binderless
bagasse insulation boards in regards to the saturated level of 75% relative humidity was carried
out to examine the minimum time for the equilibrium state to be obtained. These results have
contributed to the investigation of improving the hygrothermal and durability performance of
natural fibrous insulation materials over time. Last but not least, numerical simulations of the
effect of heat and moisture on the effective thermal conductivity of the multi-layered insulation
materials and the moisture storage capacity related to the variations of ambient relative humidity
also contribute to further experimental investigation in the thermal efficacy of the next
generation of building insulation materials.
Le Duong Hung Anh – PhD Dissertation | 3
10.
1.1
CHAPTER I: INTRODUCTION
Problem statement, Potentiality, Gaps
Solving the matter of traditional energy consumption and searching the proper alternative
resources are vital keys to a sustainable development policy. In recent years, many different
thermal insulation materials have been developed for better energy efficiency and less
environment damage. These products have proved their efficiacy in buildings due to their
benefits such as low density, high thermal resistance, biodegradability, and low-cost
effectiveness. Many previous studies have been carried out to study the thermal performance of
building insulation materials from open-cell foam and inorganic fibrous materials. On the other
hand, the practical investigation on polymer composites made of natural fibers derived from
plant-based resources used in buildings has also shown a better thermal properties than that of
those from conventional resources. Most of the experimental works notably figured out the
mechanical properties, thermal conductivity coefficient and thermophysical analysis, however,
the influence of some factors such as the ambient temperature effect, the variations of moisture
absorption related to the relative humidity levels, or the effect of airflow velocity on the heat
convective conductance has not been experimentally considered.
Some research gaps can be identified from existing literature and published studies.
Firstly, there has been no detailed overview of the main factors influencing in the thermal
properties of building insulation materials. Secondly, almost empirical data evaluates the
coefficient of thermal conductivity of insulation materials and lessen attention to the thermal
effect depending on relative humidity. Besides, most natural fibrous insulating materials are
produced as polymer composites reinforced with fiber and synthetic adhesive resin. The
advantages of these products are high strength, high durability, and contributing significantly
to sustainable industrial applications. However, there may be safety risks when recycling
composites containing formaldehyde-based adhesives that emit volatile organic compounds.
Thus, binderless thermal insulation materials show more interested and being considered as one
of the research objectives in the Ph.D. works.
1.2
Energy consumption in the building sector
The global energy expenditure in industrial and residential construction has become one
of the most important concerns in the third decade of the 21 st century. Building construction,
raw material processing, and product manufacturing are the largest sources of greenhouse gas
emissions. Carbon dioxide compounds are the main by-products of fossil fuel consumption, and
Le Duong Hung Anh – PhD Dissertation | 4
since buildings are among the biggest consumers of energy, they are also major contributors to
global warming which is accelerating climate change and threatening the survival of millions
of people, plants, and animals. According to Directive 2010/31/EU of the European Parliament
and of the Council of 19 May 2010, on the energy performance of buildings, new construction
will have to consume nearly zero energy and that energy will be to a very large extent from
renewable resources, because the construction sector has been identified as the largest energy
consumer, generating up to 1/3 of global annual greenhouse gas emissions (GHG), contributing
up to 40% of global energy, and consuming of 25% of global water worldwide [1]. Global
energy consumption is predicted to grow by 64% until the year 2040 from the considerable
increase in residential, industrial, commercial, and urban construction due to the industrial
development and growth of population, according to the Energy Information Association in
2018 [2]. As a result, environmental disasters and climate change are becoming more apparent.
For instance, global warming from the greenhouse effect (45% carbon dioxide emissions in
which buildings and construction industry are major contributors, [3]) is predicted to raise the
Earth’s average surface temperature from 1.1 °C to 6.4 °C by the end of 2100 [4,5]. The
increased consumption of natural resources for lighting, refrigeration, ventilation, recycling,
heating, and cooling system in commercial buildings due to the acceleration of urbanization,
causes an enormous expenditure for energy. Therefore, it is necessary to use renewable
resources for the purpose of energy conservation and to enhance sustainable energy strategies
in the construction sector at the building level.
1.3
The use of thermal insulation materials
As the energy becomes more precious, the use of insulation materials is being enforced
in buildings. Thermal insulation is a material or combination of materials that retard the rate of
heat flow by conduction, convection, and radiation when properly applied [6]. Using thermal
insulation products helps in reducing the dependence on heating, ventilation, and air
conditioning (HVAC) systems to manage buildings comfortably. Therefore, it conserves energy
and decreases the dependence on traditional resources (coal, natural gas, petroleum, and other
liquids). Other advantages are profits, environmentally friendly materials, extending the periods
of indoor thermal comfort, reducing noise levels, fire protection, and so on [7]. These materials
will enable systems to achieve energy efficiency. They also have many applications in food
cold storage, refrigeration, petroleum and liquefied natural gas pipelines [8]. Sustainable
insulation products with lower embodied energy and reduced environmental emissions are also
increasing in popularity and a large number of innovative types of insulation are constantly
Le Duong Hung Anh – PhD Dissertation | 5
entering the market [9]. Most of the available thermal insulation materials can be classified in
four general groups including inorganic, organic, combined, and advanced materials as shown
in Fig. 1.1. They are created in several forms including porous, blanket or batt form, rigid,
natural form, and a reflective structure [10]. Inorganic materials (glass wool and rock wool)
account for 60% of the market, whereas organic insulation materials are 27%. Conventional
materials such as polyurethane (PUR), polyisocyanurate (PIR), extruded polystyrene (XPS),
expanded polystyrene (EPS) are preferred in many buildings and thermal energy storage
applications due to their low thermal conductivity and low cost [11].
Figure 1.1 Classification of common insulation materials used in buildings.
Mineral wool includes a variety of inorganic insulation materials such as rock wool, glass
wool, and slag wool. The average range of thermal conductivity for mineral wool is between
0.03 and 0.04 W/(m·K) and the typical λ-values of glass wool and rock wool are 0.03–0.046
W/(m·K) and 0.033–0.046 W/(m·K), respectively. These materials have the low thermal
conductivity value, are non-flammable, and highly resistant to moisture damage. However, it
can affect health problems, for example, skin and lung irritation [12]. Organic insulation
materials are derived from natural resources which are currently used in buildings due to their
attractiveness, renewable, high thermal resistance, environmentally friendly and required
energy to manufacture is less than that of traditional materials [10]. New advanced materials
such as vacuum insulation panels (VIPs), gas-filled panels (GFPs), aerogels, or phase changed
material (PCM) also showed their outstanding benefits in heat retardant capacity. Among them,
VIPs exhibit one of the lowest thermal conductivity values, from 0.002–0.004 W/(m·K) at the
pressure of 20–300 Pa or reaching approximately 0.008–0.014. W/(m·K) because the vacuum
Le Duong Hung Anh – PhD Dissertation | 6
cannot be fully maintained permanently. This super-insulated material is created inside the
panel which decreases the thickness of the thermal insulation materials, but the thermal
conductivity will increase irreversible over time due to diffusion of water vapor and air through
the envelope [12]. Aerogels are also considered as one of the state-of-the-art thermal insulators
with the range of thermal conductivity values from 0.013 to 0.014 W/(m·K) and the density for
buildings is usually 70–150 kg/m3 [13]. However, its commercial availability is very limited
due to the high-cost production [14]. GFPs and PCM are the thermal insulation materials of
tomorrow due to their low thermal conductivity values, 0.013 W/(m·K) and 0.004 W/(m·K),
respectively. While GFPs are made of a reflective structure containing a gas insulated from the
external environment by an envelope impermeable as possible, PCM stores and releases heat as
the surrounding change by transforming from a solid state to liquid when heated and turning
into a solid state when the ambient temperature drops [10,13,14]. Table 1.1 shows the detailed
thermal properties of some common insulation materials, the data are collected and synthesized
according to the literature and practical experiments.
Table 1.1 Classification of the commonly used insulation materials and uncertainty about
their thermal conductivity.
Main
Subgroup
group
Insulation Maximum
Density
Thermal
Material
(kg/m3)
conductivity
Temperature
Long-term
Ref.
(W/(m·K))
(°C)
Inorganic
Fibrous
Glass wool 500
13–100
0.03–0.045
[12,13
,15]
Rock wool 750
30–180
0.033–0.045
[7,12,
13,15,
16]
Cellular
Calcium
300
115–300
0.045–0.065
[16]
430
115–220
0.04–0.06
[16]
70–160
0.046–0.07
[7,16,
silicate
Cellular
glass
Vermiculit 1600
e
Ceramic
17]
N.A.
120–560
0.03–0.07
[16]
Le Duong Hung Anh – PhD Dissertation | 7
Organic
Foamed
EPS
80
15–35
0.035–0.04
[7,1316]
XPS
75
25–45
0.03–0.04
[7,11,
1316,18]
PUR
120
30–100
0.024–0.03
[1316,19]
PIR
100
30–45
0.018–0.028
[13,20
]
Foamed,
Cork
110–120
110–170
0.037–0.050
expanded
[13,14
,16]
Melamine
N.A.
8–11
0.035
[16]
150
40–160
0.022–0.04
[13,16
foam
Phenolic
foam
Polyethyle
]
105
25–45
0.033
[16]
Fiberglass
350
24–112
0.033–0.04
[7,18]
Sheep
130 – 150
25–30
0.04–0.045
[16]
Cotton
100
20–60
0.035–0.06
[16]
Cellulose
60
30–80
0.04–0.045
[7,13,
ne foam
Fibrous
wool
fibers
14,16]
Jute
N.A.
35–100
0.038–0.055
[13]
Rice straw
24
154–168
0.046–0.056
[13]
Hemp
120
20–68
0.04–0.05
[16]
Bagasse
200
70–350
0.046–0.055
[13,21
]
Coconut
220
70–125
0.04–0.05
[13,16
,21]
Combined
Boards
Flax
N.A.
20–80
0.03–0.045
[16]
Gypsum
N.A.
N.A.
0.045
[16]
foam
Le Duong Hung Anh – PhD Dissertation | 8
Wood
180
350–600
0.09
[16]
110
30–270
0.04–0.09
[16]
N.A.
150–300
0.002–0.008
[13,16
wool
Wood
fibers
Advanced
VIPs
materials
]
Aerogel
N.A.
60–80
0.013–0.014
[13,14
,16,22
]
There is uncertainty about the thermal conductivity values for inorganic, organic, and
advanced materials which are 0.03–0.07 W/(m.K), 0.02–0.055 W/(m.K), and lower than 0.01
W/(m.K), respectively. Generally, the nominal thermal conductivity of porous materials range
from 0.02 to 0.08 W/(m.K), while the thermal conductivity values of alternative insulation
materials made from natural fibers vary from 0.04 to 0.06 W/(mK) according to the Table 1.1.
Conventional materials such as mineral wool, foamed polystyrene are mainly used in thermal
energy storage systems due to long term usage, and low cost. Natural fibers-based insulation
materials derived from agricultural waste such as coconut, rice straw, bagasse, etc., currently
applied in some building applications due to the environmentally friendly properties [23,24].
However, the main disadvantage is their relatively high-water absorption, resulting in high
thermal conductivity. Another new development material is aerogel and VIPs with a low
thermal conductivity of approximately 0.017–0.021 W/(m.K) and 0.002–0.008 W/(m.K),
respectively, which exhibits excellent thermal insulation properties. In fibrous insulating
materials, the fineness of the fibers and their orientation play a main role. In foam insulating
materials, the thermal conductivity is determined by the fineness and distribution of the cells
and particularly by the gases in those cells. Insulating materials made from wood fibers or wood
wool, the density factor is critical for the insulating capacity. The range of temperature shows
the minimum and maximum service temperatures based on manufacturers information.
Insulating materials can react very differently to hot and cold environment and there is no
uniform test method that enables a direct comparison between insulating materials [16].
1.4
Natural fibrous insulation materials
In recent days, researchers, engineers and scientists are attracted towards the use of
natural fibrous materials in the manufacturing of composites because of their eco-friendly
features, low cost, lightweight, abundant, renewable, better formability. Fig. 1.2 shows some
Le Duong Hung Anh – PhD Dissertation | 9
natural fibrous materials from plant-based resources commonly used in reinforcement polymer
biocomposites. Natural fibers have good mechanical strength; lesser weight leads to demand
for applications in engineering field. Based on the sustainability benefits, natural fibers are now
being rapidly replacing synthetic fibers in composites and also finds wide applications ranging
from automotive applications to textile manufacturers who are focusing utilizing natural fibers
as raw materials to improve their arts and skills in their industries [25]. The growing interest in
employing natural fibres as reinforcement in polymer-based composites is mostly because of
the availability of natural fibers from natural resources, meeting high specific strength and
modulus. However, some drawbacks were found since the natural fibers used to fabricate the
composites, such as the mechanical properties were reduced because the low interfacial bonding
between the natural fiber and matrix or the void has turned into a stress concentration [26].
Another disadvantage is the hydrophilicity of natural fibers resulting in the incompatible with
hydrophobic polymers, thus, leading to a drop in mechanical, thermophysical properties of the
composites due to the fiber swelling at the fiber matrix interphase [27].
Figure 1.2 Common natural fibers used in reinforcement polymer composites.
1.5
Thermal conductivity coefficient
Insulation materials are supposed to conduct heat badly in order to prevent large heat
losses. The lower the heat conduction in a material, the less heat flows through it. The thermal
performance of a building envelope depends to a great extent on the thermal effectiveness of
the insulation layer which is mainly determined by its thermal conductivity value (λ-value).
Thermal conductivity is the time rate of steady-state heat flow through a unit area of a