Study of nutrients recovery from poultry wastewater by modified biochar for soil application
Bạn đang xem bản rút gọn của tài liệu. Xem và tải ngay bản đầy đủ của tài liệu tại đây (2.59 MB, 149 trang )
VIETNAM NATIONAL UNIVERSITY HO CHI MINH CITY
HO CHI MINH CITY UNIVERSITY OF TECHNOLOGY
---------------o0o---------------
NGUYEN LAN THANH
STUDY OF NUTRIENTS RECOVERY FROM POULTRY
WASTEWATER BY MODIFIED BIOCHAR FOR SOIL
APPLICATION
NGHIÊN CỨU THU HỒI CHẤT DINH DƯỠNG TỪ NƯỚC
THẢI CHĂN NI BẰNG BIOCHAR BIẾN TÍNH ĐỊNH
HƯỚNG PHÂN BÓN
Major: Environmental Engineering
Major code: 8520320
MASTER’S THESIS
HO CHI MINH CITY, July 2023
THIS THESIS IS COMPLETED AT
HO CHI MINH CITY UNIVERSITY OF TECHNOLOGY – VNU-HCM
Supervisor: Dr. Vo Thanh Hang
Examiner 1: Assoc. Prof. Ph.D. Nguyen Tan Phong
Examiner 2: Dr. Huynh Thi Ngoc Han
This master’s thesis is defended at HCM City University of Technology, VNU- HCM
City on 29th July 2023.
Master’s Thesis Committee:
1. Chairman: Assoc. Prof. Ph.D. Dang Viet Hung
2. Member : Assoc. Prof. Ph.D. Dang Vu Bich Hanh
3. Examiner: Assoc. Prof. Ph.D. Nguyen Tan Phong
4. Examiner: Dr. Huynh Thi Ngoc Han
5. Secretary: Dr. Le Thi Huynh Tram
Approval of the Chairman of Master’s Thesis Committee and Dean of Faculty
of Environment and Natural Resources after the thesis being corrected (If any).
CHAIRMAN OF THESIS COMMITTEE
HEAD OF FACULTY OF
ENVIRONMENT AND
NATURAL RESOURCES
VIETNAM NATIONAL UNIVERSITY - HO CHI MINH CITY
HO CHI MINH CITY UNIVERSITY OF TECHNOLOGY
SOCIALIST REPUBLIC OF VIETNAM
Independence – Freedom - Happiness
THE TASK SHEET OF MASTER’S THESIS
Full name: Nguyen Lan Thanh
Student ID: 2070577
Date of birth: 13/10/1998
Major: Environmental Engineering
Place of birth: HCM city
Major ID: 8520320
I.
THESIS TITLE (In Vietnamese):
Nghiên cứu thu hồi chất dinh dưỡng từ nước thải chăn nuôi bằng biochar biến tính
định hướng phân bón
II.
THESIS TITLE (In English):
Study of nutrients recovery from poultry wastewater by modified biochar for soil
application
III. TASKS AND CONTENTS:
-
Content 1: Biochar preparation and modification.
-
Content 2: Evaluating factors effect on synthetic wastewater.
-
Content 3: Evaluating factors effect on poultry wastewater.
-
Content 4: Evaluating the slow-released ability of biochar fertilizer.
-
Content 5: Soil application.
IV. THESIS START DAY: (master’s thesis decision date) 14/02/2022.
V.
THESIS COMPLETION DAY: (master’s thesis decision date) 12/06/2023
VI.
SUPERVISOR: Dr. Vo Thanh Hang
Ho Chi Minh City, date …,…2023
SUPERVISOR
(Full name and signature)
HEAD OF DEPARTMENT
(Full name and signature)
DEAN OF FACULTY OF ENVIRONMENT AND NATURAL RESOURCES
(Full name and signature)
ACKNOWLEDGEMENT
I would like to express my heartfelt gratitude and appreciation to everyone who
has helped me along the way to finishing this thesis. Due to a lack of time and
knowledge, some of the information in this thesis cannot be sufficient and complete;
please be understanding for my shortcoming. First and foremost, I want to express my
gratitude to Dr. Vo Thanh Hang, Assoc. Prof. Ph.D. Nguyen Nhat Huy, M.Sc. Lam
Pham Thanh Hien, M.Sc. Vo Thi Thanh Thuy for their guidance, patience, and
invaluable insights throughout the entire research process. Their knowledge,
encouragement, and constructive criticism were instrumental in shaping the direction
and quality of this thesis. I am also eternally thankful to our laboratory 710 H2 group
members, who has shared their knowledge and provided a stimulating academic
environment. Their dedication to learning and research has had a significant impact on
my intellectual development. Furthermore, I would like to acknowledge my friends and
family for their unwavering support, encouragement, and understanding throughout this
challenging but rewarding academic endeavor. Their faith in my abilities and consistent
motivation has been critical to my success. Lastly, I would like to acknowledge the
countless individuals who have contributed in numerous ways, whether through
discussions, assistance, or moral support. Your contributions may not be mentioned
individually, but they have played a key role in shaping my academic and personal
growth. To all those mentioned and those who remain unnamed, I am profoundly
grateful for your support and belief in me. This thesis would not have been possible
without your contributions.
Ho Chi Minh City, July 2023
Nguyen Lan Thanh
i
ABSTRACT
In this research, we propose and evaluate a novel approach for the treatment of
poultry wastewater using a composite adsorbent derived from agricultural waste and
water supply sludge. The ultimate objective is to transform the treated wastewater into
a viable fertilizer suitable for agricultural applications. The modified biochar, a key
component of the adsorbent, was synthesized by incorporating crop residues, water
treatment plant sludge, and magnesium salt. The resulting biochar was subjected to a
comprehensive characterization process encompassing scanning electron microscopy,
energy-dispersive X-ray spectroscopy, Brunauer-Emmett-Teller analysis, and X-ray
diffraction. Subsequently, the adsorption performance of the modified biochar was
assessed with respect to ammonia and phosphate removal, employing both synthetic
and actual poultry wastewater samples. The study also investigated the influence of
various experimental parameters, including the nitrogen-to-phosphorus (N/P) ratio,
initial concentrations of ammonium and phosphate, pH, and the quantity of biochar, on
the adsorption capacity of ammonia and phosphate. The outcomes of the experimental
design revealed that the optimal conditions yielded remarkable adsorption capacities of
60.64 mgNH4+-N/g and 66.24 mgPO43--P/g. These conditions encompassed an N/P ratio
of 1.25, an initial concentration of 90 mg/L, a pH level of 6, and a biochar mass of 0.105
g. The optimum value was applied for produced biochar as a fertilizer and assessed for
slow-released ability. The pink swamp mallow was treated with biochar, chemical and
untreated for control sample. We cannot conclude the slow-released ability of this
biochar, but the plant with biochar treated develop normally like the others.
ii
TÓM TẮT LUẬN VĂN THẠC SĨ
Trong nghiên cứu này, chúng tôi đề xuất và đánh giá một phương pháp mới để
xử lý nước thải gia cầm bằng cách sử dụng chất hấp phụ tổng hợp có nguồn gốc từ chất
thải nông nghiệp và bùn nước cấp. Mục tiêu cuối cùng là sử dụng nguồn dinh dưỡng có
sẵn trong nước thải trở thành phân bón ứng dụng cho nơng nghiệp. Than sinh học biến
tính, được tổng hợp bằng cách kết hợp phế phẩm nông nghiệp, bùn nhà máy xử lý nước
và muối magie. Than sinh học thu được được phân tích tính chất bằng các phương pháp
hiện đại bao gồm kính hiển vi điện tử quét, quang phổ tia X phân tán năng lượng, phân
tích Brunauer-Emmett-Teller và nhiễu xạ tia X. Sau đó, hiệu suất hấp phụ của than sinh
học biến tính được đánh giá bằng hiệu suất loại bỏ amoni và phốt phát trên cả mẫu nước
giả thải và mẫu thực tế. Nghiên cứu cũng đánh giá ảnh hưởng của các thơng số thí
nghiệm khác nhau, bao gồm tỷ lệ nitơ-phốt pho (N/P), nồng độ ban đầu của amoni và
phốt phát, độ pH và lượng than sinh học đến khả năng hấp phụ của amonia và phốt phát.
Kết quả thiết kế thực nghiệm cho thấy các điều kiện tối ưu cho khả năng hấp phụ vượt
trội là 60,64 mgNH4+-N/g và 66.24 mgPO43--P/g. Những điều kiện này bao gồm tỷ lệ
N/P là 1.25, nồng độ ban đầu là 90 mg/L, độ pH là 6 và khối lượng than sinh học là
0.105 g. Giá trị tối ưu được áp dụng cho than sinh học được sản xuất làm phân bón và
đánh giá khả năng nhả chậm. Cây sâm bố chính được bón bằng phân từ than sinh học,
và so sánh với phân hóa học cũng như một mẫu đối chứng. Kết luận, than sinh học chưa
thể đánh giá được khả năng nhả chậm, nhưng cây sâm bố chính sử dụng than sinh học
có tốc độ phát triển cũng như tính chất như hai loại đối chứng.
iii
THE COMMITMENT OF THE THESIS’ AUTHOR
I hereby declare that this thesis is solely my original work and that the content
presented within it is entirely accurate. The data and tables used for analysis and
guidance in this study have been sourced from various references, and proper
attributions are provided in the references or footnotes immediately beneath the
respective tables. Moreover, to provide additional clarification for the analyzed and
referenced arguments, explanatory documents are included in the appendix, along with
annotated data sources.
Ho Chi Minh City, July 2023
Nguyen Lan Thanh
iv
TABLE OF CONTENT
ACKNOWLEDGEMENT ............................................................................................... i
ABSTRACT
................................................................................................... ii
TÓM TẮT LUẬN VĂN THẠC SĨ ............................................................................... iii
THE COMMITMENT OF THE THESIS’ AUTHOR .................................................. iv
TABLE OF CONTENT.................................................................................................. v
ACRONYMS
................................................................................................ viii
LIST OF FIGURES
.................................................................................................. ix
LIST OF TABLES
.................................................................................................. xi
CHAPTER 1 INTRODUCTION .................................................................................. 1
1.1
Motivation ............................................................................................... 1
1.2
Research’s aim and content..................................................................... 2
1.2.1
Research’s aim ......................................................................................... 2
1.2.2
Research’s content .................................................................................... 2
1.3
Research’s subject and scope .................................................................. 3
1.3.1
Research’s subject .................................................................................... 3
1.3.2
Research’s scope ...................................................................................... 3
1.4
Scientific contribution and prospective application ................................ 3
1.4.1
Scientific contribution .............................................................................. 3
1.4.2
Prospective application............................................................................. 4
CHAPTER 2 LITERATURE REVIEW ....................................................................... 5
2.1
Overview of animal agriculture .............................................................. 5
2.2
Environmental affection .......................................................................... 6
2.2.1
Polluted by solid waste ............................................................................ 6
2.2.2
Polluted by wastewater ............................................................................ 8
2.3.1
Mechanical treatment method ................................................................ 12
2.3.2
Physicochemical treatment method ........................................................ 13
2.3.3
Biological processes ............................................................................... 14
2.3.4
Brief conclusion ..................................................................................... 14
2.4
Adsorbent material ................................................................................ 15
2.4.1
Adsorption procedure ............................................................................. 15
2.4.2
Adsorbent materials ................................................................................ 15
2.5
2.5.1
Biochar .................................................................................................. 16
Definitions .............................................................................................. 16
v
2.5.2
Biochar properties ................................................................................. 17
2.5.3
Application of biochar ............................................................................ 20
2.5.4
Biochar production ................................................................................. 21
2.5.7
Application in Viet Nam ........................................................................ 29
2.6
Agricultural waste ................................................................................. 30
2.6.1
Definition................................................................................................ 30
2.6.2
Animal agriculture waste........................................................................ 30
2.6.3
Crop residues .......................................................................................... 31
2.6.4
The reality of crop residues in Vietnam ................................................. 31
2.7
Sludge .................................................................................................... 33
2.7.1
Definition of sludge ................................................................................ 33
2.7.2
The negative effect of sludge ................................................................. 36
2.7.3
Sludge treatment method ........................................................................ 37
2.8
Review studies in Vietnam and international ....................................... 39
2.8.1
In Vietnam .............................................................................................. 39
2.8.2
International............................................................................................ 40
2.8.3
Brief conclusion ..................................................................................... 41
CHAPTER 3 MATERIALS AND METHODS ......................................................... 43
3.1
Equipment and material ........................................................................ 43
3.2
Material preparation .............................................................................. 44
3.2.1
Biochar preparation ................................................................................ 44
3.2.2
Sludge preparation .................................................................................. 45
3.4
Adsorption experiment .......................................................................... 46
3.4.1
Evaluating adsorption of biochar and sludge on synthetic wastewater.. 46
3.4.2
Evaluating adsorption of biochar and sludge on real wastewater .......... 46
3.4.3
Evaluating slow – release ....................................................................... 47
3.4.4
Soil application ....................................................................................... 48
3.5
Analyzing method ................................................................................. 48
3.5.1
Ammonium analyzing method. .............................................................. 48
3.5.2
Phosphate analyzing method. ................................................................. 49
3.6
Calculation ............................................................................................ 51
3.6.1
Removal efficiency................................................................................. 51
3.6.2
Adsorption capacity ................................................................................ 51
CHAPTER 4 RESULTS AND DISCUSSION ........................................................... 54
4.1
The preliminary results ......................................................................... 54
vi
4.2
Biochar characterization ....................................................................... 56
4.2.1
Surface morphology and pore structure of 10% Mg-biochar................. 56
4.2.2
Compositions and structure of modified biochar ................................... 57
4.3
Optimization .......................................................................................... 62
4.3.1
Model fitting and statical analysis .......................................................... 62
4.3.2
Interactive effect of variable on models ................................................. 66
4.4
Optimization results .............................................................................. 71
4.4.1
Application on sythetic wastwater ......................................................... 71
4.4.2
Application on actual wastewater .......................................................... 72
4.5
Slow-release experiment ....................................................................... 74
4.5.1
Slow release in water .............................................................................. 74
4.5.1
Slow release in soil ................................................................................. 76
4.6
Soil application ..................................................................................... 77
4.7
Cost for 5 g of modified biochar ........................................................... 82
CHAPTER 5 CONCLUSION AND RECOMMENDATION ................................... 84
5.1
Conclusion ............................................................................................ 84
5.2
Recommendation .................................................................................. 84
PUBLICATIONS
................................................................................................. 86
REFERENCES
............................................................................................... 119
APPENDIX I
............................................................................................... 130
APPENDIX II
............................................................................................... 133
APPENDIX III
............................................................................................... 134
VITA
............................................................................................... 135
vii
ACRONYMS
3D plot
Three-dimension Plot
A/O
Anaerobic/Oxide
BOD
Biological Oxygen Demand
CCD
Central Composite Design
CEN
The European Standardization Committee
COD
Chemical Oxygen Demand
EDS
Energy-Dispersive X-ray Spectroscopy
FTIR
Fourier Transform Infrared Spectroscopy
MAP
Magnesium Ammonium Phosphate
MPP
Magnesium Potassium Phosphate
N2
Nitrogen
NH4+
Ammonium
NO2-
Nitrite
NO3-
Nitrate
P
Phosphorus
PO43-
Phosphate
RSM
Response Surface Material
SBR
Sequencing Batch Reactor
SEM
Scanning Electron Microscope
SS
Suspended Solids
TKN
Total Kjeldahl Nitrogen
XRD
X-Ray Diffraction
viii
LIST OF FIGURES
Fig. 2.1 Diagram for removal and generation solid liquid pollutants ......................... 16
Fig. 2.2. The image of biochar ..................................................................................... 17
Fig. 2.3. (a) Mound kiln; (b) Pit Kiln ........................................................................... 21
Fig. 2.4. (a) Brick Kiln; (b) Metal Kiln ........................................................................ 22
Fig. 2.5. Loaded technique of biochar for different emphases .................................... 24
Fig 3.1. Biochar preparation procedure ........................................................................ 44
Fig 3.2. Sludge preparation procedure ......................................................................... 45
Fig 3.3. The chicken coop in District 12. ..................................................................... 47
Fig 3.4. Ammonia analysis method .............................................................................. 49
Fig 3.5. Phosphate analysis method ............................................................................. 50
Fig 4.1. The influence various types of biochar (with or without sludge) on phosphate
and ammonium adsorption capacity ............................................................................. 55
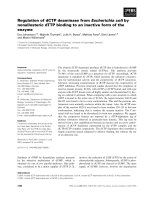
Fig 4.2. SEM images of raw material and MgCl2 10% modified biochar a) raw bagasse
scaled up x10000 times; b) raw sludge scaled up x10,000 times; c) BS scaled up x 10000
times.............................................................................................................................. 56
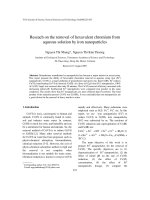
Fig 4.3. Analyzed element in EDS and % element in material (a) Mg-BS before
adsorption; (b) Mg-BS after adsorption; (c) raw water treatment plant sludge; (d) raw
bagasse. ......................................................................................................................... 58
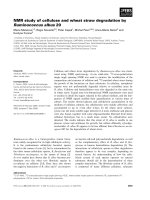
Fig 4.4. XRD analysis of BS before (B-adsorb) and after (A-adsorb) adsorption
nutrients from wastewater. ........................................................................................... 60
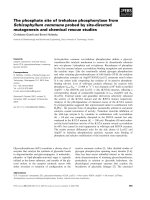
Fig 4.5. The isotherm plot adsorption and desorption of BS (a), and the pore distribution
of BS (b) ....................................................................................................................... 62
Fig 4.6. The normal distribution plot of adsorption capacity (a) Ammonium (b)
Phosphate ...................................................................................................................... 64
Fig 4.7. Normal probability plots of residual for (a) Ammonium adsorption capacity
(mg/g) (b) Phosphate adsorption capacity (mg/g) ........................................................ 65
ix
Fig 4.8. The predicted vs. actual response values plot for (a) Ammonium adsorption
capacity (mg/g); (b) Phosphate adsorption capacity (mg/g) ........................................ 66
Fig 4.9. 3D surface plot and perturbation plot of ammonium adsorption capacity ...... 67
Fig 4.10. 3D surface plot and perturbation plot of phosphate adsorption capacity ...... 70
Fig 4.11. The adsorption capacity (a), removal efficiency (b) of phosphate and
ammonium ion .............................................................................................................. 72
Fig 4.12. Outlet concentration of ammonium and phosphate leachate from water ..... 75
Fig 4.13. Outlet concentration of ammonium and phosphate leachate from (a) sand and
(b) soil ........................................................................................................................... 76
Fig 4. 14. The Pink Swamp Mallow blooming ............................................................ 78
Fig 4.15. (a) the height and (b) largest diameter of pink swamp mallow roots ........... 79
Fig 4.16. The expression of Pink Swamp Mallow (a), (b) the flower blooming, (c), (d)
(e) leaves of biochar, chemical, and untreated. ............................................................ 80
Fig 4.17. Qualitative sample extracting fluid from three treated plant (1 – biochar, 2 –
chemical, 3 – untreated) (a) raw extracting fluid (b) sample with NaOH 10%, (c) sample
2 times distilled with NaOH 10% ................................................................................. 81
x
LIST OF TABLES
Table 2. 1. Chemical composition of manure (following basic factor) .......................... 6
Table 2. 2. Chemical position of broiler and turkey manure from South California ..... 7
Table 2. 3. Characteristics of poultry and swine wastewater ....................................... 10
Table 2.4. Product (dry %) with different types of pyrolysis ....................................... 23
Table 2.5. The differences in materials and applications of biochar, activated carbon
and regular charcoal...................................................................................................... 27
Table 2.6. Mass yield of main crops in Vietnam from 2000 to 2020 ........................... 31
Table 2.7. The characteristic of sludge in water plants in HCM city ........................... 35
Table 3.1. Equipment for experiment ........................................................................... 43
Table 3.2. Machine for experiment .............................................................................. 43
Table 3.3. Experimental range and levels of the independent variables ...................... 46
Table 3.4. Standard curve for phosphate concentration ............................................... 50
Table 4.1. Analysis of variances for fit of phosphate ion, and ammonium ion qe (mg/g)
from central composite design ...................................................................................... 63
Table 4.2. Results of synthetic wastewater for testing the predicted model ................ 72
Table 4.3. Comparison of others research .................................................................... 74
Table 4.4. Properties of root pink swamp mallow........................................................ 82
Table 4.5. The total price of 5g modified biochar (0% loss) ........................................ 83
xi
CHAPTER 1
1.1
INTRODUCTION
Motivation
Nowadays, animal agriculture plays an important role in Vietnam agriculture (about
28% of production value). Approximately 4.58 million tons of meat including pigs, cows
and poultry were slaughtered in 2014 in Vietnam. According to the General Statistics
Office in 2012, pork production accounted for 72.6%, while that of poultry, cows and
buffaloes was 18, 6.3 and 1.8% respectively [1]. Moreover, according to Department of
Livestock of Vietnam in 2020, despite all adverse events, global poultry production still
grew well, up 1.3% compared to 2020. Total poultry production was about 131.6, 133.4,
and 135.2 million tons in 2019, 2020, and 2021, respectively. Since 2000, the annual global
poultry meat production has continuously increased and surpassed pork production.
Poultry meat production in 2021 reached 135.2 million tons and accounted for over 40%
of total meat production, commercial poultry meat in 2021 reached 15.6 million tons,
accounting for over 37% of total commercial meat. Due to the following increased
consumption demand, farms will spring up all over Vietnam.
The spread of spontaneous animal agriculture production is detrimental to the
environment industry because these household do not ensure the sanitation of the barns as
well as the treatment of waste in a secure manner. According to information from the
Ministry of Agriculture and Rural Development, animal waste is surveyed about 80 million
tons a year, 80% of which is discharged from establishments, small cattle and hennery
farms and large farm. However, up to 36% of this 80% is discharged directly into the
environment without treatment. The amount of waste that is directly discharged over time
will cause many serious impacts to the water, soil, and air environment around that area.
Furthermore, the hennery manure and pig manure contains about 70%-90% nitrogen,
phosphorus, magnesium, potassium, and others [1]. In which, a large amount of phosphorus
1
and nitrogen (main nutrients in animal agriculture wastewater) discharged into the aquatic
environment can cause eutrophication affecting aquatic organisms.
Furthermore, Viet Nam is an agricultural country which plays an important role in
Viet Nam’s economic. According to the Department of Crop Production, Ministry of
Agriculture and Rural Development, the waste from paddy field accounted for 50% dry
waste, it meant each 1 tons of paddy had nearly 1 tons of waste [2]. There are about 61.43
million tons of agricultural waste included 39.9 million tons of straw, 7.99 million tons of
rice husk, 4.45 million tons of bagasse, 1.2 million tons sugarcane stalks, … Besides, nearly
80% of the agricultural waste was discharged directly into the environment or burned
which was negative affect on the environment [2].
Due to the above problems of the animal agriculture treatment, and the agricultural
waste management, some research about those issues needs to be explored. Today, the
ideas of cleaner production instead of end-of-pipe treatment have been and are being paid
attention all around the world. Instead of using wastewater treatment methods, present
research is focusing on reusing nutrients such as N and P to create another product with
economic benefits. Furthermore, reused the crop residues and fabricated biochar as an
adsorbent for nutrient recovery from poultry wastewater was a good idea for dealing with
all the problems above. At the present in Vietnam, studies on the recovery of N and P with
different purposes have not been widely studied. Therefore, from the practical requirements
in Vietnam, the study aims to propose the topic "Study of recovery nutrients from poultry
wastewater by modified biochar for soil application".
1.2
Research’s aim and content
1.2.1 Research’s aim
This study aims to fabricate the slow-release fertilizer from N and P in poultry
wastewater by the modified biochar from crop residues and sludge.
1.2.2 Research’s content
2
-
To achieve this aim, this study has implemented the following contents as below:
-
Content 1: Biochar preparation and modification.
-
Content 2: Evaluating factors effect on synthetic wastewater.
-
Content 3: Evaluating factors effect on poultry wastewater.
-
Content 4: Evaluating the slow-released ability of biochar fertilizer.
-
Content 5: Soil application.
1.3
Research’s subject and scope
1.3.1 Research’s subject
The research subjects of this study include:
-
Ammonium and Phosphate from poultry wastewater
-
Synthetic wastewater
-
Wastewater from small hennery
-
Plant for soil application
1.3.2 Research’s scope
This research takes place in environmental analysis laboratory, room 710, building
H2, Ho Chi Minh University of Technology in second campus. The experiment is
proceeded in batch using wastewater from poultry farm.
Time for research: from 3/2022 – 12/6/2023
1.4
Scientific contribution and prospective application
1.4.1 Scientific contribution
This study provides data on the ability to recover nutrients by adsorption method
for the goal of slow-release fertilizer for plants with poultry wastewater. At the same time,
the topic is the basis for further research processes related to fertilizers for crop and
cultivation.
3
1.4.2 Prospective application
Taking advantage of nutrients from wastewater as fertilizer for crops helps farmers
save some production costs, as well as protect the environment. From there, it is possible
to expand the production scale as well as reduce the costs of environmental treatment.
4
CHAPTER 2
2.1
LITERATURE REVIEW
Overview of animal agriculture
The animal agriculture in Vietnam accounts for about 28% of the agricultural value
and is an essential factor of the agricultural sector in Vietnam [3]. The growth value of the
animal agriculture industry is higher than the crop and service sectors, reaching an average
value of 5.27% per year. According to statistics in 2014 in our country, pork accounted for
the majority of 73%, the rest was poultry meat 19%, beef 6%, and other types of buffalo
meat accounted for 2% [1].
According to the General Statistics Office in 2020, poultry production will develop
stably, although avian influenza still occurs in some areas. Also in 2020, African fever
happens but the total number of pigs in the country in 2020 still increase by 17% compared
to 2019 [1]. Over the next decade (2021-2030), FAO predicts that poultry meat production
will continue to grow at a high rate and outpacing the growth of other meats. By 2030,
poultry meat will account for over 41% of all meat production and over 52% of all
commercial meat. The potential demand for meat consumption in Vietnam is mainly still
high in the domestic market. However, in the past decade consumption demand has tripled
while meat production has only doubled. Therefore, Vietnam had to import meat to meet
its demand. According to data from the General Statistics Office, in 2016 the total number
of livestock farms in the country was 20869, in which many concentrated in provinces and
cities such as Hanoi (3,189), Hung Yen (648), Vinh Phuc (1,007), Central Highlands
(4,041), Thai Nguyen (800), Dong Nai (3,811) and Binh Duong (901). Our country has
about 29.1 million pigs, about 8 million buffaloes, and 361.7 million poultry. Which,
livestock farming still accounts for about 65-70% of quantity and output. From the number
of heads of livestock and poultry, it can be converted to the amount of solid waste (manure,
leftovers, or scattered food) that the herd of livestock and poultry wastes is about over 86
5
million tons, and about over 57 million cubic feet of liquid waste (urine, barn wash water,
blanket yard).
2.2
Environmental affection
2.2.1 Polluted by solid waste [4], [5]
Solid waste in animal agriculture includes manure and animal feed (food for raising
cattle, chicken, …). Food spillage, production packaging, hazardous waste.
-
Hazardous waste: In terms of care or vaccination activities for pigs and chickens a
large amount of medical waste such as needles, cotton balls, medicine bottles,
bottles is generated. In addition, there are animal corpses due to illness or accidents,
placenta during childbirth, these types of waste are listed as hazardous waste that
needs to be handled separately.
-
Pig has dry manure and urine while fresh chicken manure consists of feces with a
white paste mixed with the manure. Manure is the residue of animal feed after
passing through the digestive system, is not absorbed, or used up, and excreted from
the body. Feces contain a very small amount of garbage, fillers, and leftovers. The
chemical composition of feces includes cellulose, lignin, proteins, decomposed
products of proteins, lipids, organic and inorganic acids. Urine is the part of
nutrients in animal feed that has been digested, dissolved in the blood after
metabolism is excreted in the form of water. The chemical composition of cattle
urine is mainly urea, uric acid, hippuric acid, inorganic salts of K, Na, Ca, and Mg.
Poultry litter concludes thirteen types of plant nutrients like N, P, K, Na Mg, Cu,
Zn, Fe, B, Cl, Mo, Mn, S and Ca.
Table 2. 1. Chemical composition of manure (following basic factor) [6], [7]
Cattle
Ability for
manure
Chemical composition (% weight)
6
production of
500 kg cattle
Fresh
Volume weight Solute Nitrogen Phosphorous C/N Potassium Calcium
(kg)
Pigs
0.028
28.40
7.02
0.83
0.47
2025
0.150.95
0.090.34
Table 2. 2. Chemical position of broiler and turkey manure from South California [8]
Chicken (broiler litter)
Turkey (grower litter)
Moister (%)
21.5
26.5
TS (%)
78.5
73.5
N-NH4 (lb./ cu.ft.)2
11
12
Organic – N
60
42
Nitrate – N
0.7
0.3
Total N
72
54
P2 O 5
69
64
Mg
8.1
6.9
Na
10
7.4
According to the Ministry of Agriculture and Rural Development, animals generate
about 80 million tons of waste each year. Small cattle or hennery farms in rural areas and
large concentration sites account for 80% of the total waste. Animal waste is directly
released into the environment at around 36%. After being discharged directly into
7
environment, the water source will be polluted. If waste is buried in the ground, it will
pollute the soil as well as the odor will affect the surrounding air environment.
2.2.2 Polluted by wastewater [9], [10]
Wastewater from the animal agriculture is mainly generated by the cleaning of the
barn as well as the hygiene of the animals, consisting of urine, feces, and barn cleaning
water. The main components of polluting wastewater are organic matter, nitrogen and
phosphorus, excess drug components, and pathogenic bacteria. The waste is discharge
directly into canals and rivers without any treatment, causing water pollution [9], [11].
Poultry wastewater typically contains more than 1% of total solids (TS) mainly
organic and concentrations, chemical oxygen demand (COD), varies from less than 10 g/L
to more than 100 g/L in harsh case. There is also nitrogen and phosphorus in wastewater
with a total nitrogen (TN) of 0.2–7.3 g-N/L and a total phosphorus (TP) concentration of
about 0.2–0.5 g-P/L [9], [10].
The poultry litter should be covered if it is not using for land application in 1 or 2
days. This will conserve the nitrogen contained in poultry manure, also decrease the
nitrogen losses about 17 percent, odor, flies and leachate waste [8].
-
Organic and inorganic substances
The organic substances that have not been assimilated and absorbed by cattle will
be excreted in feces, urine, and other metabolic products. Excess feed is also a source of
organic pollution.
In animal agriculture wastewater, organic compounds have nearly 70-80%
including proteins, amino acids, fats, carbohydrates. Most are easily degradable organic
substances, enrich in nitrogen, phosphorus. Inorganic substances account for 20-30%
including sand, soil, salt, urea, ammonium, chloride salts, sulfate...
8
Chemical compounds in feces and wastewater are easily decomposed. Depending
on anoxic or anaerobic conditions, the decomposition process produces different products
such as amino acids, fatty acids, aldehydes, CO2, H2O, NH3, H2S. If the decomposition
process is present O2, the products formed will be CO2, H2O, NO2, NO3. If the
decomposition process takes place in anoxic conditions, it will form products like CH4, N2,
NH3, H2S, Indol, Scatol... The gases produced by anaerobic and anoxic decomposition such
as NH3, H2S … causing a stench in the farming area, which adversely affects the air
environment.
Wastewater is a complex mixture of beneficial and harmful microorganisms,
including various types of parasite eggs, bacteria, and viruses that can cause diseases such
as E. coli, Salmonella, Shigella, and Proteus Arizona. In healthy animals and humans, these
microorganisms coexist in a symbiotic balance within the digestive tract. However, when
a pathological condition arises, such as diarrhea in cattle, the balance is disrupted, leading
to an overgrowth of pathogenic bacteria that can outcompete the beneficial bacteria. In
cases of infectious diseases, the excretion of pathogenic bacteria in wastewater can pose a
significant risk to the environment and other livestock.
-
Nitrogen and phosphorous [12], [13]
The nitrogen and phosphorous adsorption ability of cattle and poultry is not good,
so they will be excreted in feces and urine after eating food containing nitrogen, and
phosphorous. Form of nitrogen in poultry feces is ammonium (N-NH4+), which can convert
into NH3 at base pH level [8]. Ammonia in poultry manure can be loosed from the feces
surface whether it is storage or soil application. Poultry wastewater often include high
levels of nitrogen and a part of phosphorus. Total nitrogen content in wastewater of cattle
and poultry farm measured after biogas production is about from 100 to 594mg/l,
phosphorus from 13.8 to 62 mg/L. Nitrogen is excreted in urine and feces in the form of
urea, then urea is quickly converted to NH3 according to the following equation:
9
NH4 + OH- + CO2
(NH2)2CO + H2O
NH3 + CO2 + H2O
Microorganisms release the enzyme urease, which converts urea into ammonia.
From there, ammonia evaporates into the air, causing odors, affecting the surrounding
environment. N and P exist in water in the form of ammonium (NH4+), nitrate (NO3-) and
phosphate (PO43-). A large amount of N and P are contained in animal agriculture
wastewater, these two nutrients can cause eutrophication, affecting aquatic habitats.
Table 2. 3. Characteristics of poultry and swine wastewater
Criteria
BOD5
COD
SS
Unit
mg/L
mg/L
mg/L
N-
pH
NH4
+
mg/L
TN
TP
PO43-
mg/L
mg/L
mg/L
Poultry wastewater
1341 Parit Raja,
1821
Malaysia
1602 ±
[14], [15]
243
Celaya,
3154-
7.3 –
162.6 –
7719
8.6
564
5422 ±
2282
4524-
5800-
8700
11600
Tamilnadu,
750-
3000-
India [17]
1890
4800
Slaughter
1600-
1500-
house [18]
1300
2200
Gto.,
Mexico[16]
-
8.2 ±
-
0.42
17.1
-
6-95
7-7.6
16-165
65-87
12.3 ±
4.25
215
6.1-7.1
10
361 ±
7–
10.5-
7.17-
2.75-
111.50
12.74
7.81
-
16-32
109305
12-20
Ontario,
Canada
[14]
610 –
1250 –
4635
15900
-
4.9 –
8.1
-
50 –
841
-
N. A
Swine wastewater
Huong
192-
Thuy, Hue
582
(after
biogas) [13]
307±9
0
264-789
188-821
463±12
373±12
7
3
106-
355-
421
712
122-492
-
259±7
536±8
4
9
318±84
Xuan Tho
III, Dong
1664-
2561-
1700-
7.23-
304-
512-
Nai (after
3268
5028
3218
8.1
471
594
-
1327.08
210
4.3
61.75
-
3950
-
7.6
-
Jeongup,
TCOD
10.5±0.
Korea [21]
23821.5
400
13.8-62
-
biogas)
Chuong My,
Ha Noin
(after
-
biogas) [19]
China (after
biogas) [20]
TCN 678 2006
300
695
125
-
8.02±0
3053.6
527.0±6
667.1±
5
.11
±19.5
7.0
4.2
-
-
-
20
5
11