tóm tắt: Nghiên cứu ảnh hưởng của một số thông số công nghệ đến quá trình gia công tia lửa điện bề mặt trụ ngoài thép 90CrSi với dung dịch điện môi trộn bột nano SiC
Bạn đang xem bản rút gọn của tài liệu. Xem và tải ngay bản đầy đủ của tài liệu tại đây (1.62 MB, 30 trang )
MINISTRY OF EDUCATION AND TRAINING MINISTRY OF
INDUSTRY AND TRADE
NATIONAL RESEARCH INSTITUTE OF MECHANICAL
ENGINEERING
------- *** -------
NGUYỄN MẠNH CƯỜNG
RESEARCH ON THE EFFECTS OF SOME PROCESS PARAMETERS
ON ELECTRICAL DISCHARGE MACHINING PROCESS
OF 90CrSi STEEL EXTERNAL CYLINDRICAL SURFACE
USING DIELECTRIC SOLUTION MIXED WITH SiC NANO POWDER
SPECIALITY: MECHANICAL ENGINEERING
Code: 9520103
SUMMARY OF THE Ph.D. THESIS
Hanoi - 2023
1
Hà Nội - 2023
The work was completed at the Institute of Mechanical Engineering
- Ministry of Industry and Trade
Scientific instructor 1: Assoc. Prof. Vũ Ngọc Pi
Scientific instructor 2: Assoc. Prof. Lê Thu Quý
Reviewer 1: …. ….….….….….….….….….….….
Reviewer 2: …. ….….….….….….….….….….….
Reviewer 3: …. ….….….….….….….….….….….
The thesis is defended in the Doctoral Thesis Evaluation Council of
the Institute
Place of meeting: National Research Institute of Mechanical
Engineering
No4, Pham Van Dong Str., Cau Giay Distr., Hanoi, Vietnam
At .... AM ..., date ……………………….., 2023
Thesis can be found at the following libraries:
-
Vietnam National Library
-
Library of Mechanics Research Institute
-
Library of Thai Nguyen University of Technology
2
LIST OF PUBLICATIONS
1. Thi-Hong Tran, Manh-Cuong Nguyen, Anh-Tung Luu, The-Vinh Do, ThuQuy Le, Trung-Tuyen Vu, Ngoc-Giang Tran, Thi-Tam Do and Ngoc-Pi Vu,
Electrical Discharge Machining with SiC Powder-Mixed Dielectric: An
Effective Application in the Machining Process of Hardened 90CrSi Steel,
Machines (MDPI), July 2020 (SCIE Q2);
/>2. Vu Ngoc Pi, Do Thi Tam, Nguyen Manh Cuong, Thi-Hong Tran; Multiobjective Optimization of PMEDM Process Parameters for Processing
Cylindrical Shaped Parts Using Taguchi Method and Grey Relational
Analysis; International Journal of Mechanical and Production Engineering
Research and Development (IJMPERD) ISSN (P): 2249–6890; ISSN (E):
2249–8001 Vol. 10, Issue 2, Apr 2020, pp 669-678. (Scopus Q3)
/>3. Tran Thi Hong, Bui Thanh Danh, Nguyen Van Cuong, Le Hong Ky, Nguyen
Hong Linh, Nguyen Thi Thanh Nga, Tran Ngoc Giang, Nguyen Manh
Cuong*; A Study on Influence of Input Parameters on Surface Roughness in
PMEDM Cylindrical Shaped Parts; Materials Science Forum (Volume
1018), January 2021, pp. 65-70. (Scopus Q4)
/>4. Tran Thi Hong, Nguyen Van Cuong, Bui Thanh Danh, Le Hong Ky, Nguyen
Hong Linh, Vu Thi Lien, Nguyen Thai Vinh, Nguyen Manh Cuong*; MultiObjective Optimization of PMEDM Process of 90CrSi Alloy Steel for
Minimum Electrode Wear Rate and Maximum Material Removal Rate with
Silicon Carbide Powder; Materials Science Forum (Volume 1018), January
2021, pp. 51-58. (Scopus Q4)
/>5. Tran Thi Hong, Nguyen Hong Linh, Nguyen Van Cuong, Bui Thanh
Danh, Le Hong Ky, Le Thu Quy, Nguyen Manh Cuong, Vu Ngoc Pi, Do
Thi Tam*; Effect of Process Parameters on Machining Time in PMEDM
Cylindrical Shaped Parts with Silicon Carbide Powder Suspended
Dielectric; Materials Science Forum (Volume 1018), January 2021, pp. 97102. (Scopus Q4)
/>
1
INTRODUCTION OF DISSERTATION
1. Dissertation title
Research on the effects of some process parameters on electrical discharge machining
process of 90CrSi steel external cylindrical surface using dielectric solution mixed with
SiC nano powder.
2. Rationale of the study
Electrical discharge machining (EDM) is one of the most popular advanced
machining technologies in the world. This is an effective machining method that is used
to process conductive materials, high hardness, and difficult-to-machine parts. For
example, parts in aircraft engines, power generation turbines, molds, etc. There are
several disadvantages of EDM method such as: it cannot machine non-conductive
materials; low material removal rate (MRR); the electrode wears out quickly, leading to
reduced dimensional accuracy of the machined part.
There have been many domestically and internationally studies to provide solutions
to enhance the performance of EDM process such as: Optimizing machining process
parameters; Selecting electrode materials; choosing nano powder materials to mix into
the dielectric solution. Among the above solutions, performing EDM process with
conductive powder mixed into dielectric solution (PMEDM) is the solution that gives
very positive results. This method has been receiving much attention in EDM research.
Previous research findings indicate that PMEDM can concurrently improve both
productivity and quality of the machining process, hence boosting the electrode's
durability. However, several issues with this technique remain unresolved, including the
powder material, powder size, powder concentration, machining process mechanism,
and so on. As a result, many scientists have been interested in conducting research on
the theoretical fundamentals, as well as optimization and application of this technology.
PMEDM machining research reveals that this is a very difficult field due to the vast
number of process parameters, each of which has a very varied effect on the goal
functions. Furthermore, numerous optimization methods have been applied in this field,
such as the Taguchi method, artificial neural network, target surface approach, and so
on. The majority of the study has focused on simple optimization problems. target.
However, the PMEDM process's multi-objective optimization problem requires
consideration as well.
Parts with external cylindrical surfaces, such as shaped tablet punches and shaped
steel sheet punches, are used in actual manufacturing. These parts are typically made of
tool alloy steels such as SKD11, SKD61, 90CrSi, and others. These are pieces that are
difficult to machine using conventional methods. Processing this type of detail with the
EDM method is a very effective way for processing the aforesaid details. A number of
research have been conducted on the use of EDM machining to process 90CrSi material
parts with curved outer cylindrical surfaces. When utilizing EDM, studies have
demonstrated clear results in terms of both productivity and surface quality. However,
no research on PMEDM for details with external cylindrical surfaces made of 90CrSi
alloy steel has been conducted to yet.
1
From the above analysis, the topic “Research on the effects of some process parameters
on electrical discharge machining process of 90CrSi steel external cylindrical surface
using dielectric solution mixed with SiC nano powder” is urgent.
3. Subjects and research goals of the thesis
3.1. Scope of the study
The object of research is the PMEDM process when machining small-sized
external cylindrical shaped parts. The scope of the study is limited to external cylindrical
shaped parts tempered 90CrSi tool steel with a maximum dimension of less than 20 mm.
Also, the electrode material is red copper and EDM processing with dielectric solution
mixed with 500 nm SiC powder.
3.2. Objectives of the study
Investigation of the effects of input parameters of the PMEDM process including
the servo voltage (SV), the discharge current (IP), the pulse on time (T on), the pulse off
time (Toff), the powder concentration (Cp) on the surface roughness (Ra), the material
removal rate (MRR), and the tool wear rate (TWR) when machining external cylindrical
shaped parts with 90CrSi material and the pulse electrode is red copper. In addition,
finding a reasonable set of input process parameters to achieve the smallest Ra, the
highest MRR, or smallest TWR. Conducting multi-objective optimization of process
parameters to simultaneously achieve smallest Ra, largest MRR and smallest TWR.
4. Research methodology
Using theoretical research methods combined with experimental methods; Using
statistical analysis techniques and develop empirical models; Using the Taguchi method
and Gray Relational Analysis (GRA) method for single-objective and multi-objective
problems.
5. Significances
5.1. Scientific significances
This dissertation has contributed to improving knowledge about PMEDM process,
especially about PMEDM external cylindrical shaped parts. Specifically:
- Contribute to clarifying the influence of input process parameters (SV, IP, T on,
Toff, Cp) on Ra, MRR, and TWR when machining external cylindrical shaped parts with
90CrSi steel using dielectric solution mixed with SiC nano powder.
- Formulas have been proposed to predict SR, MRR and TWR when processing
with reasonable input process factors.
- Finding the effectiveness of PMEDM when using SiC nano powder and copper
electrodes to process external cylindrical shaped parts.
- The results of the thesis can be used as a reference for scientific research on
PMEDM process
2
5.2. Practical significances
Successfully applied PMEDM method to process small-size external cylindrical
shaped parts when using SiC nano powder and copper electrodes. The results can be
applied to mechanical manufacturing companies when processing tablet punches (or
steel plate punches) with external cylindrical shaped surfaces to improve the efficiency
of the machining process.
5.3. New contributions of the thesis
- For the first time, the PMEDM method has been successfully applied to process
parts small-size external cylindrical shaped parts when using SiC nano powder and
copper electrodes.
- Evaluating the influence of several input process parameters on SR, MRR, and
TWR when machining external cylindrical shaped surface of 90CrSi parts using SiC
nano powder dielectric solution and copper electrodes.
- Solving single-objective and multi-objective optimization problems by applying
the Taguchi method and GRA to provide a reasonable set of technological parameters
when PMEDM.
- Proposing empirical formulas to predict SR, MRR, and TWR values when
PMEDM.
CHAPTER 1. OVERVIEW OF ELECTRICAL DISCHARGE MACHINING
1.1. Electrical discharge machining
Mechanism of Electrical Discharge Machining
Figure 1.1 is a diagram of the
principle of EDM process. In the
EDM process:
- Eletrodes are EDM tools;
There are many material types
used to make electrodes such as:
Cu, Cu-Zn alloy, Al, graphite, etc.
All electrode materials are
characterized by good electrical
conductivity and easy to machine
and create precise shapes.
Choosing
the
appropriate
Fig. 1.1 EDM schematic
electrodes is very important as
results in high material removal
rate, small electrode wear, and low processing costs.
- Machining parts (workpiece): Part materials in EDM machining must be
conductive. The ability to conduct electricity, heat, melting point, hardness... of the
machined part material affects the productivity and quality of processing.
3
- Dielectric solution: Dielectric solution has the effect of controlling the discharge
process, cooling the surface of the machined part as well as the electrode surface and
solidifying the chip, rolling the chip out of the machining area and putting it into the
filtering system, absorbing and releasing thermal energy.
Types of EDM:
EDM has the following main types: EDM, wire-EDM, EDM sawing, EDM
grinding, EDM drilling. Among these types, EDM is the most commonly used
machining form today.
1.2. Advantages and disadvantages of EDM
Advantages: Does not require the tool to have a hardness higher than the hardness
of the work piece; Does not cause deformation of machined parts; Able to machine
small-sized surfaces with complex shapes; Easy to automate because the machining
movements are quite simple; Causes little thermal deformation of machined parts;
Disadvantages: Can only process conductive materials; The machined hole surface
has a taper; Low productivity and machined surface quality; When increasing MMR,
the surface roughness also increases; During the machining process, the electrode is
worn, which negatively affects the machining accuracy;
1.3. Process parameters of EDM
+) Servo voltage Ud:
The voltage in EDM is related to
the discharge gap and the insulation of
the dielectric solution. The voltage at
the
discharge
gap
increases
continuously until an ion current
appears to break down the insulation of
the dielectric solution. When the
current begins to appear, the maximum
voltage (U0) decreases and remains in a
stable state. (Ud) at the discharge gap
(Figure 1.2). MMR, TWR and SR
increase as voltage increases.
Fig. 1.2: Relation between sevro volatage,
+) Discharge current Id: This is one of
current and time in EDM
the most important input parameters of
the EDM machining process. High
current will increase MRR but also increase TWR and reduce machined surface quality.
+) Pulse on time Ton: (Figure 1.2) includes delay time (Tde) and spark discharge time
(Td). Ton and number of pulse cycles (Tp) per second are important quantities. In EDM,
the MRR is proportional to the amount of energy used during T on.
+) Pulse off time Toff: (Figure 1.2) Toff has an impact on material removal productivity
and the stability of the machining process.
4
1.4. Productivity, surface quality and machining accuracy
+) Productivity: also known as MRR which is determined by the ratio between the
volume of workpiece material removed and the processing time.
+) Tool wear rate TWR: is the amount of electrode material worn out in a unit of
processing time.
+) Quality of machined surface: The surface machined by EDM is characterized
by its shape, chemical composition, micro-organization and mechanical properties.
+) Processing accuracy: Machining dimensional accuracy in EDM is often
determined through two parameters: overcut amount (d) and machined surface profile
accuracy.
1.5. Powder mixed electrical discharge machining (PMEDM)
Fig. 1.3 PMEDM schematic
Fig. 1.4 Discharge process of EDM and
PMEDM
Scientists have researched the impact of combining nano- and micro-sized metal
powders or alloys into dielectric solutions in the EDM process (PMEDM) in recent years
to improve the machining process while also improving machined surface quality.
Figure 1.3 depicts the PMEDM method's machining diagram. When conductive powder
particles are present, the spark discharge process varies dramatically (such as increasing
the discharge gap, the number of sparks fired in one phase, and the pulse length (Figure
1.4).
1.6. Literature of EDM and PMEDM
1.6.1. Vietnamese publications
- Vu Quang Ha (2012) studied the influence of technological regime on
productivity and surface quality when wire EDM cutting. Research on electrode profile
wear and machined surface quality when EDM was conducted by Tran Quang Huy in
2019. In this work, the author used two types of electrode materials: red copper and
plated red copper. chromium with machined parts being SKD11 steel.
5
- Research to determine the
optimal technology mode when EDM
machining with different types of
electrodes combined with different
types of processing materials. In his
research, Nguyen Van Duc proposed
the optimal technological regime
when pulsing SKD11 steel with
copper electrode material.
- Tran Thi Hong at al. has
published some research results on
EDM when machining shaped
Fig. 1.5: External cylindrical shaped parts
external cylindrical surfaces when
machined by EDM
machining 90CrSi steel (Figure 1.5)
with copper electrodes. In this
studies, the influence of input technology parameters (T on, Toff, IP, SV) on output results
(Ra, TWR, MRR) was investigated.
- Banh Tien Long and Nguyen Huu Phan have studied the effect of Ti powder on
MRR, TWR, and surface quality of parts. From the results of the study, processing
SKD61 steel using Ti powder can made a improvement in machining productivity and
surface quality compared to when not used the powder. Specifically, MRR increased by
474.5%, TWR decreased by 64.4%, Ra decreased by 41.3%, and the number and size
of microcracks on the machined surface were smaller. Also, the white layer thickness is
more uniform and the mechanical properties of the surface layer are enhanced.
- Le Van Tao et al. have conducted a study for evaluating the influence of process
parameters when PMEDM SKD61 steel with WC powder on SR. The results of the
study showed that Ra improved by 53.3%, and microhardness increased by 81.5%.
1.6.2. Overseas publications
Research on EDM and PMEDM focuses mainly on the following directions:
- Improving machining productivity, mainly to increase MRR, and reduce TWR.
- Improving surface quality after machining using EDM and PMEDM methods to
reduce SR, reduce surface microcracks, and increase microhardness of the surface layer.
a) MRR and TWR in PMEDM
- Shabgard et al. conducted a study on PMEDM SKD61 with red copper electrodes.
It was noted that IP and Ton have a great influence on MRR, TWR and SR. Accordingly,
increasing IP causes MRR, TWR and Ra increase rapidly. Also, when T on increases,
MRR and Ra increase but TWR decreases sharply.
- M.L. Jeswani investigated PMEDM with mixing graphite powder with Cp = 4 g/l
into an oil dielectric solution. It was reported that MRR increased by 60% and TWR
decreased by 28%.
- When machining titanium alloy, Chow Han-Ming et al. employed SiC powder
and Al powder with an oil solvent. Their findings demonstrate that incorporating SiC
powder and Al powder into the oil dielectric solution increases the discharge gap,
resulting in an increase in MRR. Similarly, Tzeng Y.F et al. processed SKD11 steel with
6
Al, Cr, Cu, and SiC powder. It was discovered that the powder concentration, powder
size, particle density, and electrical and thermal conductivity of the powder all had a
significant impact on the machining process. A proper powder concentration will boost
MRR while decreasing TWR.
- H.K Kansal et al. performed an optimization study to find optimum input
parameters when PMEDM pure Ti material using Si powder. It was noted that increasing
powder concentration helps improve both MRR and SR. Also, it was found that the
optimal process mode is Cp = 2 g/l, IP = 3 A.
- Yoo Seok Kim and Chong Nam Chu investigated PMEDM process with graphite
mixed powder to machine small holes with diameter of 100 µm and depth of 300 µm,
STS304 steel material. From the results, mixing graphite powder in solvent with
appropriate concentration can reduce the machining time up to 30.9%, and TWR up to
28.3% for comparing to EDM machining without powder.
- A.P. Tiwary et al. evaluated the influence of the concentration of three different
powders including copper, nickel and cobalt in the dielectric, deionized water, on the
MRR material removal rate and the amount of TWR electrode wear when machining
Ti-6Al-4V. The recommended optimal input parameters are IP = 1.5A and Cobalt
powder concentration is 4 g/l.
b) Ability to improve machined surface quality of the PMEDM method
- Mohri et al. investigated the effects of PMEDM process with Si powder with
particle size of 10-30μm. The obtained results show that the machined surfaces have
good wear resistance and small surface roughness (Ra) (2μm).
- Yoshiyuki Uno and Arika Okada studied the influence of Si powder on the surface
formation mechanism. It was reported that Si powder mixed in dielectric solution allows
creating product surfaces that have smaller surface roughness than conventional EDM
methods.
- According to Jahan, mixing nano-sized graphite powder into dielectric solution
in pulse machining and electric spark milling reduces Ra (can reach 38 nm). Besides,
Prihandana noted that microcracks on the machined surface will decrease in both
number and size when pulsing with powder mixing.
- Pichai Janmanee et al. conducted a study on PMEDM with Ti powder to improve
machined surface quality. In their results, the hardness of the processed surface layer of
WC material increased significantly when pulsed with a powder concentration of 50 g/l.
In the layer 5 µm deeper than the surface, the microhardness reaches 1750 HV. It is due
to the formation of TiC through powder mixing, while if EDM not mix powder, the
hardness of the base metal layer only reaches 998 HV.
To evaluate the influence of powder mixed into diselectric solution on the change
of machined surface layer during PMEDM, A. Batish and colleagues studied the
influence of Al, graphite, Cu and W powders. Their results show that, when machining
with W powder, the surface hardness is the greatest. Also, the microhardness of the
PMEDM surface depends on other parameters such as powder material, powder
concentration, IP, Ton, electrode material.
Thus, in studies to improve the efficiency of the electroporation process, the
PMEDM method is an effective solution to increase MRR and reduce TWR as well as
improve machined surface quality.
7
Conclusions of chapter 1
In this chapter, an overview of the development history, machining principles,
types of electric spark machining, parameters affecting the machining process and
parameters evaluating the effectiveness of EDM machining and PMEDM was surveyed.
Domestic and international research has focused on EDM and PMEDM in the following
directions: the effect of mixing powder into dielectric solution on MRR, TWR, and
machined surface quality with different types of Different powders, different processing
materials. In addition, the parameters of electricity, powder and electrode materials
receive the most research attention.
Most research focuses on machining surfaces with holes and cavities. Research into
EDM machining of shaped external cylindrical surface has just begun and is still very
limited. In particular, research on PMEDM when machining shaped external cylindrical
surface has not been done so far. This is the reason for choosing the topic: "Research on
the effects of some process parameters on electrical discharge machining process of
90CrSi steel external cylindrical surface using dielectric solution mixed with SiC nano
powder".
CHAPTER 2. EXPERIMENTAL MODEL OF EDM 90CrSi STEEL WITH
POWDER MIXED IN DIELECTRIC SOLUTION AND BUILDING
EXPERIMENTAL SYSTEM
2.1. Model for improving PMEDM process efficiency
2.1.1. Diagram and basis of research on PMEDM process
The general model for EDM as well as PMEDM is shown in Figure 2.1. In the
model, X are the input parameters, which need to be researched and an experimental
plan needs to be developed. Y are the output parameters, or results. Z are controlable
parameters which depend on the purpose of the study the value of Z can be chosen. E is
the "noise" or the incontrolable parameters
2.1.2. Selecting input parameters
The input parameters of the EDM
process are selected to include 4
parameters: voltage (SV); discharge
current intensity (IP); pulse generation
time (Ton); pulse off time (Toff). These are
the main technological parameters that
have the most influence on the machining
Fig. 2.1. Experimental Schematic Diagram
process. In addition, the powder
concentration in the dielectric solution used in PMEDM is also a parameter that greatly
affects productivity and machined surface quality. Therefore, this is also an input
technology parameter chosen by the author for research.
2.2. Experimental system
2.2.1. EDM machine
The EDM machine used in the experiment is a CNC EDM machine from Sodick
brand, Japan, model: MarkA30.
8
2.2.2. Experimental workpieces
a)
b)
Fig 2.2. Dimensions of the workpiece and electrode
- Workpiece material is tempered 90CrSi tool steel with surface hardness 58-60
HRC; the workpiece dimensions are as shown in Figure 2.2a
2.2.3. Electrodes
The electrode material chosen for the experiment is red copper (Cu). The electrode
shape and size are as shown in Figure 2.2b.
2.2.4. Nano powder
The powder mixed into the dielectric solution for use in the experiment is SiC
(silicon carbide) powder, 500 nm particle size, 99% purity.
2.2.5. Dielectric solution
The dielectric solution chosen for experiments is Diel MS7000 pulse oil.
2.2.6. Experimental setup
The experimental setup and dielectric solution tank and experimental equipment are
shown in Figure 2.3.
2.2.7. Input parameter ranges
The current IP ranges from 4 – 8 (A); The pulse on time from 6 – 14 (µs); the pulse
off time 14 – 30 (µs); the servo volatage from 3 -5 (V).
Fig 2.3. Experimenatl setup
9
2.2.8. Parameters and concentration of SiC powder mixed into the dielectric
solution:
Using SiC powder with the particle size of 500 nm and the powder concentration from
0 - 4.5 (g/l).
2.3. Testing equipments
Testing equipment includes: Electronic scale WT3003NE; SV3100 Mitutoyo Machined
Surface Roughness Tester; CRYSTA-Apex S544 CMM coordinate measuring machine;
Scanning electron microscope (SEM/EDX) Jeol JMS 6490.
Conclusions of chapter 2
Analyzed and selected input parameters and output results of the study. The input
process parameters include: SV, IP, T on, Toff and Cp. The output parameters include Ra,
MRR, and TWR.
A model has been proposed to improve the efficiency of the PMEDM process using
SiC powder in a dielectric solution when pulsing a part with a cylindrical outer surface
to shape the 90CrSi material.
An experimental system has been built, using reliable measuring equipment to meet
the requirements of experimental research.
CHAPTER 3. EXPERIMENTAL STUDY OF THE EFFECTS OF INPUT
PARAMETERS ON SURFACE ROUGHNESS, MATERIAL REMOVAL RATE
AND TOOL WEAR RATE WHEN IMPULSE MACHINING OF 90CrSi STEEL
WITH DIELECTRIC SOLUTION MIXED WITH SiC POWDER
3.1. Experiment
3.1.1. Experimental purpose
- Determine the influence of pulse process input parameters on Ra, MRR, TWR when
90CrSi steel is pulsed through quenching with a dielectric solution containing SiC nano
powder.
- Propose appropriate pulse technology modes to achieve the smallest Ra, the largest
MRR and the smallest TWR.
3.1.2. Experimental design
The selection of input parameters, workpieces, electrodes, nano powders and
measuring instruments, machines and laboratory equipment has been presented in
chapter 2. The output parameters as stated above include 3 parameters : Ra, MRR and
TWR.
Table 3.1. Input factors and their levels
Levels
Input factors
Powder Concentration Cp [g/l]
1
2
3
4
5
6
0
2.0
2.5
3.5
4.0
4.5
Pulse on Time Ton [µs]
6
10
14
-
-
-
Pulse off Time Toff [µs]
14
21
30
-
-
-
Peak Curent IP [A]
4
8
12
-
-
-
Discharge Voltage SV [V]
3
4
5
-
-
-
10
Experimental planning method: the Taguchi method was chosen to design and
analyze experimental results. The Minitab 19 software and Taguchi L18 (6^1 3^4) design
were used to design and analyze the experimental results. The experimental plan and
results are shown in Table 3.1. The declaration of experimental variables is described in
Figure 3.1.
3.1.3. Experimental performing
Experiment of PMEDM 90CrSi steel with dielectric solution mixed with SiC nano
powder was carried out according to the experimental plan. Ra measurement results,
average value of Ra after pulse, and the calculation of S/N ratio were shown in Table
3.2.
Fig. 3.1. Declare experimental variables according to the Taguchi method (L18 = 6^1
3^4=18 runs)
3.2. Results and analysis
3.2.1. Effect of input parameters on surface roughness
Table 3.2. Experimental plan and output results
TT
Cp
Ton
Toff
IP
SV
1
2
3
4
5
6
7
8
9
10
11
12
0
0
0
2
2
2
2.5
2.5
2.5
3.5
3.5
3.5
6
10
14
6
10
14
6
10
14
6
10
14
14
21
30
14
21
30
21
30
14
30
14
21
4
8
12
8
12
4
4
8
12
12
4
8
3
4
5
4
5
3
5
3
4
4
5
3
Ra [µm]
Run 1 Run 2 Run 3
S/N
2.960
2.239
5.066
2.411
2.749
4.942
2.158
3.895
3.840
2.791
3.421
2.685
11
2.930
2.161
5.117
2.434
2.839
5.200
2.232
3.882
3.733
2.620
3.559
3.068
2.928
2.383
5.125
2.482
2.601
5.174
2.196
3.868
3.790
2.528
3.490
2.906
-9.3651
-7.0932
-14.1561
-7.7567
-8.7278
-14.1627
-6.8308
-11.7804
-11.5680
-8.4602
-10.8576
-9.2198
Mean
2.93933
2.26100
5.10267
2.44233
2.72967
5.10533
2.19533
3.88167
3.78767
2.64633
3.49000
2.88633
13
14
15
16
17
18
4
4
4
4.5
4.5
4.5
10
14
6
10
14
14
30
14
30
14
21
30
4
8
8
12
4
8
4
5
5
3
4
3
2.959
2.646
1.614
3.752
4.404
2.864
2.795
2.670
1.655
3.613
4.298
2.732
2.763
2.785
1.741
3.926
4.491
2.795
-9.0673
-8.6305
-4.4587
-11.5172
-12.8658
-8.9355
2.83900
2.70033
1.67000
3.76367
4.39767
2.79700
+) Effect of input factors on surface roughness Ra
ANOVA values of average surface roughness ((Ra) ̅) are shown in Table 3.3 and
Figure 3.2. Accordingly, Ton contributes the largest amount to Ra (29.71%), followed
by Cp (18.65%), voltage (15.43%), IP (11.05%) and finally T off (10.79%). From Table
3.4 and Figure 3.2, it can be seen that when pulsed with a solution mixed with nano
powder, the surface roughness is smaller than when pulsed without powder.
̅̅̅̅
Table 3.3. ANOVA of 𝑅𝑎
̅̅̅̅
Table 3.4. Effect of input factors on 𝑅𝑎
.
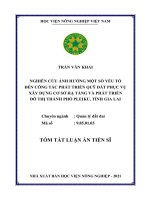
Fig 3.2. Effect of main factors on Ra
The relationship between powder concentration and Ra is shown in Figure 3.3. This
figure shows the relationship between powder concentration and Ra: When the powder
concentration increases from 2 ÷ 4 (g/l), the graph has a very large downward slope,
meaning Ra drops sharply (29.86%) from 3,426 µm to 2,403 µm.
12
Ra (µm)
4
3.5
3
2.5
2
1.5
1
0.5
0
3.434
3.426
3.288
3.653
3.008
2.403
0
2
2.5
3.5
4
4.5
Cp (g/lit)
Fig 3.3. Effect of powder concentration on surface roughness
To evaluate the effect of mixing powder into a dielectric solution on the quality of
the machined surface, the technique of analyzing the machined surface captured by a
scanning electron microscope (SEM) was applied. A number of SEM samples were
selected, including: Pulse sample without powder mixing with the following parameters:
Cp = 0 (g/liter); Ton = 6 (µs); Toff =30 (µs); IP =12 (A); SV =35 (V); Average Ra 2.388
(μm). Pulse sample mixed with powder with parameters: Cp = 6 (g/liter); Ton = 6 (µs);
Toff = 14 (µs); IP = 8 (A); SV = 3 (V); Average ra 2,080 (μm).
From the SEM analysis results (Figure 3.4), it can be seen that when the pulse is
mixed with powder (Figure 3.4b), the number of dents is greater than when there is no
powder mixing (Figure 3.4a).
Figure 3.5 shows that the number of cracks when machining with powder mixed
(2 cracks - Figure 3.5b) is significantly reduced compared to when machining without
powder mixing (5 cracks - Figure 3.5a). Figure 3.6 shows the structure of the machined
surface layer when machining without powder mixing and with powder mixing.
a)
b)
Fig 3.4: Machined surface topography
13
a)
b)
Fig 3.5. Microscopic cracks on the machined surface
The results of measuring the thickness of the white layer on the SEM are given in
Table 3.5 for samples when pulsed without mixing powder and Table 3.6 for samples
when pulsed with powder mixed. Accordingly, the thickness of the whitening layer
when machining with powder mixed is lower and more uniform than without powder
mixing. That leads to better surface quality when machining with powder mixed than
without mixing powder.
a)
b)
Fig 3.6. Structure and whitening layer on machined surface
14
Table 3.5. Thicknesses of White layers when processed without mixing powder
Table 3.6. Thicknesses of White layers when processed with mixing powder
+) Determination of optimum input factors for getting minimum SR:
To determine a reasonable pulse mode, it is necessary to analyze the variance of
the S/N ratio of Ra to find a reasonable level of input parameters.
Table 3.7. ANOVA of S/N of ̅̅̅̅
𝑅𝑎
Source
Cp
Ton
Toff
IP
SV
Residual Error
Total
DF
5
2
2
2
2
4
17
Seq SS
24.018
8.067
30.207
14.147
17.310
19.694
113.443
Adj SS
24.018
8.067
30.207
14.147
17.310
19.694
Adj MS
4.804
4.033
15.103
7.074
8.655
4.924
F
0.98
0.82
3.07
1.44
1.76
P
0.524
0.503
0.156
0.339
0.283
ANOVA S/N values of Ra are shown in Table 3.7, Table 3.8 and Figure 3.7. From
the results, it shows that Cp = 4 g/l (Cp5), Ton = 6 µs (Ton1), Toff = 21 µs (Toff2), IP = 8 A
(IP2), SV = 4 V (SV2) are the levels and the values of the input parameters give the
largest S/N ratio. This is the reasonable level and value of the process parameters to
achieve the smallest surface roughness.
Table 3.8. Influence of input factors on S/N of Ra
Level
1
2
3
4
5
6
Delta
Rank
Cp
-10.205
-10.216
-10.060
-9.513
-7.386
-11.106
3.721
1
Ton
-8.833
-9.993
-10.417
Toff
-9.479
-8.312
-11.451
IP
-9.797
-8.638
-10.808
SV
-11.077
-8.741
-9.425
1.584
5
3.139
2
2.170
4
2.336
3
15
Fig 3.7. Effect of main factors on S/N of Ra
+) Prediction of surface roughness:
̅̅̅̅𝑂𝑃 ) is determined by the levels of
The predicted average surface value (𝑅𝑎
parameters that have a strong influence on the S/N of surface roughness according to
the formula:
̅ + 𝑇̅𝑜𝑛1 + 𝑇̅𝑜𝑓𝑓2 + ̅̅̅
̅̅̅̅
𝑅𝑎𝑂𝑃 = 𝐶𝑝5
𝐼𝑃2 + ̅̅̅̅
𝑆𝑉2 − 4 ∗ 𝑇̅𝑅𝑎
(3.4)
And we have:
̅̅̅̅
𝑅𝑎𝑂𝑃 = 2.403 + 2.804 + 2.618 + 2.817 + 2.772 − 4 ∗ 3.202 = 0.606 𝜇𝑚
Experimental results with input parameters: Cp = 4 g/l, Ton = 6 µs, Toff = 21 µs, IP
= 8 A, SV = 4 V, the average Ra after 3 experiments is 0.656 µm. This value differs
100
(0.656 − 0.606) ∙
= 7.62 % from the predicted value. This result shows that, in
0.656
the optimal pulse mode using SiC powder, the surface roughness is reduced by 5.67
times (82.35%) compared to when nano powder is not used.
Fig. 3.8. Normal probability plot
Fig. 3.9. Probability plot original data
+) Evaluate the reliability of the model:
The reliability of the model is evaluated through the normal distribution graph
(Figure 3.8) and the probability distribution graph of the original data (Figure 3.9). From
these figures, it can be seen that the Ra data follow the law of normal distribution.
16
3.3.2. Effect of input parameters on MRR
Table 3.9. Experimental plan and MRR and S/N
No.
Cp
Ton
Toff
IP
SV
1
2
3
4
5
6
7
8
9
10
11
12
13
14
15
16
17
18
0
0
0
2
2
2
2.5
2.5
2.5
3.5
3.5
3.5
4
4
4
4.5
4.5
4.5
6
10
14
6
10
14
6
10
14
6
10
14
10
14
6
10
14
14
14
21
30
14
21
30
21
30
14
30
14
21
30
14
30
14
21
30
4
8
12
8
12
4
4
8
12
12
4
8
4
8
8
12
4
8
3
4
5
4
5
3
5
3
4
4
5
3
4
5
5
3
4
3
MRR [g/h]
Run 1
0.01921
0.01011
0.24745
0.00341
0.33044
0.03213
0.00179
0.03924
0.33835
0.45369
0.05054
0.00254
0.32517
0.00777
0.00886
0.31019
0.00702
0.00799
Run 2
0.01925
0.01012
0.24651
0.00339
0.33016
0.03213
0.00178
0.03916
0.33835
0.45233
0.05058
0.00253
0.32488
0.00775
0.00883
0.30989
0.00701
0.00798
Run 3
0.01925
0.01012
0.24698
0.00340
0.33016
0.03216
0.00179
0.03908
0.33808
0.45278
0.05049
0.00253
0.32547
0.00774
0.00885
0.31019
0.00700
0.00800
S/N
-34.3156
-39.8957
-12.1468
-49.3611
-9.6230
-29.8586
-54.9584
-28.1426
-9.4149
-6.8794
-25.9281
-51.9155
-9.7577
-42.2115
-41.0643
-10.1703
-43.0820
-41.9507
Average
0.019241
0.010121
0.246981
0.003404
0.330254
0.032142
0.001787
0.039163
0.338263
0.452930
0.050535
0.002536
0.325175
0.007752
0.008847
0.310090
0.007013
0.007989
The results of determining MRR of 3 experiments according to formula 3.1 and
their average value for each option in 18 different runs are presented in Table 3.9.
+) Effect of input parameters on MRR
The results of calculating the S/N ratio (according to formula 3.5) of 18
̅̅̅̅̅̅̅ ) are shown
experiments are shown in Table 3.9. ANOVA values of average MRR (𝑀𝑅𝑅
as Table 3.10. Table 3.11 and Figure 3.11 show the influence of input parameters on
̅̅̅̅̅̅̅). The influence of the parameters on 𝑀𝑅𝑅
̅̅̅̅̅̅̅ in % is as follows: IP has
pulse arrival (𝑀𝑅𝑅
the largest contribution to MRR (55.98%), followed by T on (9.16%), Toff (8.66%), SV
(5.77%) and finally is Cp (2.33%).
From Figure 3.10, it can be seen that when machining with a dielectric solution
mixed with a concentration of nano powder, the MRR is higher than when machining
with a dielectric solution without powder mixed. MRR reaches its highest value when
Cp is at level 4 (3.5 g/l), at this level MRR increases by 183.11% compared to without
powder (Figure 3.12).
̅̅̅̅̅̅̅
Table 3.10. ANOVA of 𝑀𝑅𝑅
̅̅̅̅̅̅̅
Table 3.11. Effect of input factors on 𝑀𝑅𝑅
17
MRR (g/h)
0.2
0.15
0.1
0.16867
0.12193 0.1264
0.09211
0.113920.10836
0.05
0
0
2
2.5
3.5
4
4.5
Cp (g/lit)
̅̅̅̅̅̅̅
Fig 3.10. Main effects plot for 𝑀𝑅𝑅
Fig 3.11. Relation between Cp and MRR
+) Determine the appropriate input factors to achieve the largest MRR
According to Table 3.11 and Figure 3.8, nano powder concentration Cp = 3.5
(g/liter) (Cp4), Ton = 6 (µs) (Ton1), Toff = 30 (µs) (Toff3), IP = 12 (A) (IP3), SV = 5 (V)
(SV3) are the levels and values of input parameters for the largest MRR. This is a
reasonable level and value of the input process parameters to achieve the largest MRR.
+) Predict MRR value
̅̅̅̅̅̅̅𝑂𝑃 ) is determined by the levels of
The predicted average MRR value (𝑀𝑅𝑅
parameters that have a strong influence on the S/N of MRR according to the formula:
̅ + 𝑇̅𝑜𝑛1 + 𝑇̅𝑜𝑓𝑓3 + ̅̅̅
̅̅̅̅̅̅̅
𝑀𝑅𝑅𝑂𝑃 = 𝐶𝑝4
𝐼𝑃3 + ̅̅̅̅
𝑆𝑉3 − 4 ∗ 𝑇̅𝑀𝑅𝑅
(3.6)
Substituting the number, we have:
̅̅̅̅̅̅̅𝑂𝑃 = 0.16867 + 0.18544 + 0.18151 + 0.28344 + 0.15808 − 4 ∗ 0.121901
𝑀𝑅𝑅
= 0.48954 𝑔/ℎ
Conduct validation experiments with the following input parameters: C p = 3.5
(g/l), Ton = 6 (µs), Toff = 30 (µs), IP = 12 (A), SV = 5 (V) we have the average pulse
removal capacity received after 3 experiments is 0.442 (g/h). This value is 9.71%
different from the predicted value. From here it can be seen that with the optimal pulse
mode (using nano powder), the ablation productivity increases 4.79 times compared to
the average level without using nano powder 0.09211 (g/h).
3.3.3. Effect of input parameters on TWR
Table 3.12. Experimental plan and TWR and calculated S/N
No
.
Cp
1
2
3
4
5
6
7
8
9
10
11
12
13
14
15
16
17
18
0
0
0
2
2
2
2.5
2.5
2.5
3.5
3.5
3.5
4
4
4
4.5
4.5
4.5
Input parameters
Ton
Toff
IP
6
10
14
6
10
14
6
10
14
6
10
14
6
10
14
6
10
14
14
21
30
14
21
30
21
30
14
30
14
21
21
30
14
30
14
21
4
8
12
8
12
4
4
8
12
12
4
8
12
4
8
8
12
4
SV
Run 1
3
4
5
4
5
3
5
3
4
4
5
3
3
4
5
5
3
4
94.68
14.95
72.89
47.30
179.87
16.81
60.71
43.58
69.63
641.74
41.38
5.79
75.00
5.43
69.67
317.20
14.19
6.18
TWR (mg/h)
Run 2
Run 3
18
91.52
16.67
64.79
46.34
174.58
18.10
58.65
38.91
57.34
657.39
37.93
5.02
64.29
6.07
60.80
292.03
10.32
9.48
97.04
18.97
48.59
46.82
171.93
12.93
59.68
40.47
53.24
636.52
36.21
4.63
71.43
6.71
64.60
312.17
12.90
7.01
Average of
TWR
94.412
16.864
62.092
46.821
175.459
15.948
59.680
40.986
60.068
645.217
38.506
5.149
70.238
6.067
65.024
307.133
12.473
7.554
S/N
-395.030
-245.804
-359.742
-334.092
-448.851
-241.358
-355.174
-322.624
-356.309
-561.949
-317.240
-142.717
-369.489
-156.910
-362.750
-497.520
-219.913
-177.107
+) Effect of input parameters on TWR:
The results of calculating the S/N ratio of 18 experiments are shown in Table
3.12. From the ANOVA analysis results (Table 3.13), it can be seen that Ton is the
parameter with the largest percentage influence on TWR with 25.6%; Next is the
influence of the parameters Cp (17.5%), Toff (15.29%), IP (13.65%) and SV (7.04%).
Table 3.13. ANOVA of effect of input
factors o TWR
Table 3.14. Order of influence of input
parameters on TWR
The order of influence of input parameters is described in Table 3.14. From this
table, it can be seen that the order of influence of parameters on S/N ratio is Cp, Ton, Toff,
IP and SV respectively.
Fig. 3.12. Influence of input parameters on TWR
Figure 3.12 describes the influence of parameters on TWR electrode wear rate.
From the figure, it can be seen that Cp has an effect on TWR. Using the appropriate
powder concentration can reduce TWR. Specifically, with Cp = 4.0 g/l, the amount of
wear is smallest, and smaller than without mixing powder.
+) Determine the appropriate input factors to achieve the smallest TWR
Determining reasonable input parameters to achieve the smallest TWR is similar
to the case of determining Ra above. The appropriate pulse mode to achieve the smallest
TWR is: Cp = 4 g/l, Ton = 14 µs, Toff = 21 µs, IP = 4 A, SV = 3 V.
+) Predict the value of electrode wear rate:
̅̅̅̅̅̅̅𝑂𝑃 ) is determined by the
The predicted average electrode wear value ( 𝑇𝑊𝑅
levels of parameters that have a strong influence on the S/N of TWR according to the
formula:
̅ + 𝑇̅𝑜𝑛3 + 𝑇̅𝑜𝑓𝑓2 + ̅̅̅
̅̅̅̅̅̅̅
𝑇𝑊𝑅𝑂𝑃 = 𝐶𝑝5
𝐼𝑃1 + ̅̅̅̅
𝑆𝑉1 − 4 ∗ 𝑇̅𝐸𝑊𝑅
(3.11)
Thay số:
18
18
18
∑
𝑇𝑊𝑅𝐼 +∑𝑖=1 𝑇𝑊𝑅𝐼𝐼 + ∑𝑖=1 𝑇𝑊𝑅𝐼𝐼𝐼
𝑇̅𝑇𝑊𝑅 = 𝑖=1
= 3.857 (𝑚𝑔/ℎ)
54
19
(3.12)
To evaluate the determined results, a validation experiment was performed. This
experiment was performed with the following pulse parameters: C p = 4 (g/l), Ton = 14
(µs), Toff = 21 (µs), IP = 4 (A), SV = 3 (V). The average TWR determination result
obtained after 3 experiments is 3,533 mg/h. Thus, the error between the predicted results
and the experimental results is 8.4 (%).
+) Evaluate the reliability of the experimental model:
Fig. 3.13. Normal probability plot
a)
b)
c)
Fig. 3.14. Johnson conversion plot for TWR
Figure 3.13 shows the normal distribution graph of the residuals. It is easy to see
that the distributed residuals are scattered and quite close to a normal distribution
(oblique straight line). To evaluate more clearly, the Johnson transition plot (Figure
3.14) was used. This graph includes 3 figures: Figure 3.14a is the probability distribution
graph of the original data. Accordingly, there are some original data that do not follow
20
the normal distribution rule. Figure 3.14b is the result of Anderson-Darling (AD)
statistics. This figure shows that the data does not follow a normal distribution because
the p value of 0.005 is very small compared to the significance level of 0.05. Therefore,
it is necessary to use the Johnson transformation to convert the data into data that follows
the normal distribution law. Figure 3.18c shows the distribution graph of the converted
data. This figure shows that the conversion data (blue points) are all within the two
bounding lines. Additionally, the p value of 0.478 is much larger than the significance
level of 0.05. In other words, the transformed data follows the law of normal distribution
with a very high level, meaning the experimental model is reliable.
Conclusions of chapter 3
- The influence of parameters on surface roughness Ra is as follows: The influence
of Toff is the largest (29.71%); followed by Cp (18.65%), SV (15.43%), IP (11.05%) and
finally Ton (10.79%).
- Mixing SiC powder into dielectric solution when pulsed reduces Ra of the
machined surface (29.86%), increases MRR (358.15%) compared to when pulsed with
dielectric solution without mixing powder.
- A reasonable set of pulse mode parameters to achieve the smallest Ra surface
roughness is: Cp = 4 (g/l), Ton = 6 (µs), Toff = 21 (µs), IP = 8 (A), and SV = 4 (V).
- A reasonable set of pulse mode parameters to achieve maximum ablation
productivity is: Cp = 3.5 (g/l), Ton = 6 (µs), Toff = 30 (µs), IP = 12 (A), and SV = 5 (V).
- A reasonable set of pulse mode parameters to achieve the smallest tool wear rate
is: Cp = 4 (g/l), Ton = 14 (µs), Toff = 21 (µs), IP = 4 (A), and SV = 3 (V).
- Formulas have been built to calculate the optimal values of SR, MRR, and TWR,
when process the external cylindrical surface with a dielectric solution mixed with 500
(nm) particle size SiC powder.
CHAPTER 4. MULTI-OBJECTIVE OPTIMIZATION OF PROCESS
PARAMETERS IN ELECTRICAL DISCHARGE MACHINING FOR
HARDENED 90CrSi STEEL WITH SiC POWDER-MIXED DIELECTRIC
4.1. Problem Statement
This chapter applies multi-objective optimization the input parameters for
electrical discharge machining hardened 90CrSi steel with SiC powder-mixed dielectric
using single objective functions as Ra, MRR, and TWR. The Taguchi method and Gray
Relational Analysis are applied to solve the multi-objective optimization problem with
the given single objective functions.
4.2. Overview of the Taguchi Method and Gray Relational Analysis
The Taguchi method and Gray Relational Analysis (abbreviated as Taguchi-Gray)
are applied to solve the multi-objective optimization problem. Minitab software was
utilized for data analysis. The procedure for multi-objective optimization problems
includes 04 steps is presented as follows:
• Step 1: Construct a database in the form of orthogonal arrays.
21
• Step 2: Perform Gray Relational Analysis.
• Step 3: Optimize using the Taguchi method and Gray Relational Analysis.
• Step 4: Conduct experiments to validate the results.
4.3. Multi-objective optimization for cylinder surface with powder-mixed dielectric
using Taguchi method and Grey Relational Analysis
4.3.1. Construct the orthogonal arrays database
This step was carried out in Chapter 3, where the design and experimentation for
three single-objective functions, including minimum Ra, maximum MRR, and
minimum TWR, were conducted. Table 4.1 presents the orthogonal matrix of input
parameters and output results (Ra, MRR, and TWR).
Table 4.1. Orthogonal Matrix of Input Parameters and Output Results
Surface roughness
Electrode Wear Rate
Material Removal Rate
TWR (mg/h)
MRR (mg/h)
Ra (m)
1st
2nd
3rd
1st
2nd
3rd
1st
2nd
3rd
2.960
2.930
2.928
94.675
91.519
97.041
19.21
19.25
2.239
2.161
2.383
14.947
16.672
18.972
10.11
10.12
19.25
10.12
5.066
5.117
5.125
72.891
64.792
48.594
247.45
246.51
246.98
2.411
2.434
2.482
47.299
46.344
46.821
3.41
3.39
3.40
2.749
2.839
2.601
179.868
174.578
171.932
330.44
330.16
330.16
4.942
5.200
5.174
16.810
18.103
12.931
32.13
32.13
32.16
2.158
2.232
2.196
60.709
58.651
59.680
1.79
1.78
1.79
3.895
3.882
3.868
43.580
38.911
40.467
39.24
39.16
39.08
3.840
3.733
3.790
69.625
57.338
53.242
338.35
338.35
338.08
2.791
2.620
2.528
641.739
657.391
636.522
453.69
452.33
452.78
3.421
3.559
3.490
41.379
37.931
36.207
50.54
50.58
50.49
2.685
3.068
2.906
5.792
5.020
4.634
2.54
2.53
2.53
2.959
2.795
2.763
75.000
64.286
71.429
325.17
324.88
325.47
2.646
2.670
2.785
5.428
6.067
6.705
7.77
7.75
7.74
1.614
1.655
1.741
69.669
60.802
64.602
8.86
8.83
8.85
3.752
3.613
3.926
317.203
292.028
312.168
310.19
309.89
310.19
4.404
4.298
4.491
14.194
10.323
12.903
7.02
7.01
7.00
2.864
2.732
2.795
6.181
9.477
7.005
7.99
7.98
8.00
4.3.2 Grey relational Analysis
The analysis of Gray Relational relationships for multi-objective optimization
is carried out as follows:
+) Standardization of experimental data
This process is performed through the standardized value Zij (0≤Zij≤1), which is
determined by the formula:
𝑍𝑖𝑗 =
𝑆𝑁𝑖𝑗 −min(𝑆𝑁𝑖𝑗 ,𝑗=1,2,..𝑘)
max(𝑆𝑁𝑖𝑗 ,𝑗=1,2,..𝑛)−min(𝑆𝑁𝑖𝑗 ,𝑗=1,2,..𝑛)
where j represents the experiment number (j=18).
22
(4.3)